Trade Liberalization and Industrial Restructuring through Mergers and Acquisitions
(JOB MARKET PAPER)
Holger Breinlichy January 2006
Abstract
This paper analyzes mergers and acquisitions (M&A) as a previously neglected channel of industrial restructuring in the face of trade liberalization. Using the Canada-United States Free Trade Agreement of 1989 as a natural experiment, I show that trade liberalization leads to a signi…cant increase in M&A activity. I also provide evidence that resources are trans- ferred from less to more productive …rms in the process and that the magnitude of the overall transfer is quantitatively important. Taken together, these results suggest that M&A is an important alternative to the previously studied adjustment channels of …rm and establishment closure and contraction. This has strong implications for the design of competition policy in the wake of trade liberalizations since M&A may o¤er a more e¢ cient way of transferring re- sources than contraction and closure of low productivity …rms combined with internal growth of more e¢ cient …rms.
KEY WORDS: Mergers and Acquisitions, Trade Liberalization, International Trade, CUSFTA.
JEL CLASSIFICATION: F12, F15, L2, L4.
I am grateful to Stephen Redding, Keith Head, Anthony Venables, Henry Overman, Silvana Tenreyro and sem- inar participants at the London School of Economics, the University of Nottingham, the University of Bristol, the NEG Spring School 2005 in Cagliari, and the ETSG Meeting 2005 in Dublin for helpful comments and suggestions.
All remaining errors are mine.
yLondon School of Economics and Centre for Economic Performance, Houghton Street, London WC2A 2AE.
E-mail: [email protected].
1 Introduction
Recent economic research on the e¤ects of trade liberalization has highlighted the importance of studying the …rm- and establishment-level adjustment processes triggered by freer trade (a short and inexhaustive list of contributions includes Tybout et al., 1991; Tybout and Westbrook, 1995; Pavcnik, 2002; and Tre‡er, 2004). A central insight from these studies is that a substantial part of the impact of freer trade works through a reallocation of resources across individual plants and …rms. In particular, the contraction and exit of low productivity establishments and the expansion of more productive ones can explain a sizeable share of aggregate productivity increases found in the wake of trade liberalizations (see Pavcnik, 2002; and Tre‡er, 2004).
While this literature has thus demonstrated the general importance of micro-level resource reallocation in understanding the e¤ects of freer trade, the central issue of how resources are transferred between individual …rms is still not su¢ ciently well understood. In particular, only scarce attention has been paid to resource transfers through the market for corporate control, i.e.
through mergers and acquisitions (M&A). This is despite the fact that M&A can, in principle, play a similar role as the adjustment processes highlighted in the existing literature. Instead of closing down establishments, reducing output or exiting altogether, …rms also have the option to search for buyers interested in parts or the whole of their operations. Similarly, expanding …rms can buy and integrate other …rms rather than expand production at existing plants or open new ones.
Establishment-level studies which focus on plant-level contraction, exit or expansion implicitly ignore this potential margin of adjustment since they do not look at changes in ownership at continuing plants.1
The purpose of this paper is to investigate empirically whether M&A does indeed play a role in industrial restructuring in the face of trade liberalization. This is important for a number of reasons. First, studying M&A is necessary to obtain a more complete picture of the mechanisms
…rms use to adjust to freer trade and of the extent of inter-…rm resource transfers involved in this adjustment. Second, M&A is not just another way of transferring resources but is likely to be qualitatively di¤erent from the other adjustment forms in that it is swifter and potentially more e¢ cient. Instead of workers and capital becoming unemployed for some period before being rehired, acquisitions allow for an immediate transfer into new ownership. Also, M&A allows the takeover of entire production structures which may be most e¢ cient if preserved as a whole.
Finally, knowing whether or not M&A plays an important role in …rm adjustment to freer trade might also shed new light on results from previous plant-level studies. For example, reallocations of control rights at existing establishments and ensuing restructuring undertaken by the new management might be part of the reason for the important within-plant increases in productivity found in many studies (e.g. Tybout and Westbrook, 1995; Pavcnik, 2002).
The particular liberalization episode I will study in this paper is the Canada-United States Free Trade Agreement (CUSFTA) of 1989. As will be argued in more detail, CUSFTA provides
1Similarly, a smaller group of papers that use …rms rather than plants or establishments as their unit of analysis focus on exit by bankruptcy as the principal form of adjustment and do not consider M&A (see for example Gu, 2003; or Baggs, 2004). Note that throughout this paper, I will use the words ”establishment” and ”plant”
interchangeably to denote a unit of production within a …rm.
an ideal setting for the purpose of this study. Most importantly, it represented a clear-cut and unanticipated policy experiment which was not introduced in response to macroeconomic shocks nor accompanied by other major economic reforms. Furthermore, the main policy instrument used (tari¤ cuts) is easily quanti…able and shows a large variation across sectors. Finally, the large size di¤erence between the treaty partners and the implied variation in expected responses to the integration shock further increases the potential for convincing econometric identi…cation.
Against this background, I will present three main sets of …ndings. In a …rst step, I exam- ine whether there is evidence that CUSFTA led to more M&A activity. Using a di¤erence-in- di¤erences approach, I …nd a substantial increase in the number of domestic Canadian trans- actions which is positively correlated with the magnitude of tari¤ cuts across sectors. There is also an e¤ect on domestic U.S. M&A activity but one that is much less pronounced than in Canada, consistent with the idea that CUSFTA presented the bigger shock for the smaller Cana- dian market. Cross-border transactions show substantial changes around the implementation of CUSFTA as well, although the link to tari¤ cuts is less clear cut. In a second step, I examine
…rm-level characteristics of targets and acquirers in order to investigate whether acquisitions in- volve a transfer of resources from less to more productive …rms, as seems to be the case for the previously studied channels of adjustment (exit and contraction). This is indeed what I …nd:
acquirers tend to be bigger, more pro…table and more productive. In a …nal step, I look at the amount of inter-…rm transfers of output and employment in North America that were due to M&A during my sample period 1985-1997. Comparing results to resource transfers via exit and contraction, I …nd that M&A was quantitatively important relative to these alternative channels of adjustment. Taken together, these results suggest that M&A is an important alternative to the adjustment mechanisms of …rm and establishment closure and contraction that have been emphasized in earlier research.
A number of recent theoretical contributions in International Trade have also studied …rm- level reallocation processes triggered by trade liberalization (Melitz, 2003; Bernard et al., 2003;
Bernard, Redding and Schott, 2004; and Falvey, Greenaway and Yu, 2004). Similar to the empirical literature on plant- and …rm-level adjustment by which they were motivated, however, they do not examine M&A as a form of resource transfer. Another group of papers in International Trade does look at M&A but mostly in the form of cross-border transactions and in the context of foreign direct investment (e.g. Görg, 2000; Horn and Persson, 2001; Nocke and Yeaple, 2004; di Giovanni, 2005). Rather than analyzing M&A as a means of industry restructuring, they examine its role as an alternative form of foreign market access in addition to green…eld investment and exports. Bertrand and Zitouna (2005) and Neary (2005) present models in which M&A is a way of restructuring industries after trade liberalization, but they also restrict their analysis to cross-border mergers. In contrast, several theoretical contributions in Industrial Organization have directly focused on M&A as a mechanism for transferring resources between domestic …rms.
In particular, Jovanovic and Rousseau (2002, 2004) use models with heterogenous …rms to show how M&A can serve as a complement to exit and internal adjustment to …rm- and industry- speci…c shocks. However, they restrict their attention to closed-economy settings and only analyze domestic shocks.
On the empirical side, contributions in Corporate Finance and Industrial Organization have since long pointed out that M&A can play a substantial role in restructuring industries and that its consequences go far beyond a mere change in ownership (e.g. Jensen, 1993; Kaplan, 2000;
Copeland et al., 2003). Speci…cally related to the question at hand, authors like Jovanovic and Rousseau (2002) or Andrade and Sta¤ord (2004) have shown that M&A is indeed frequently used as a way of …rm expansion and complements or replaces internal investment in that respect.
Comparisons of empirical studies also show that acquisitions perform very similarly to other forms of investment in terms of abnormal stock market returns (Andrade et al., 2001). On the target’s side, takeovers usually bring large abnormal gains in share prices and most acquired assets show signi…cant increases in productivity (Maksimovic and Phillips, 2001; Andrade et al., 2001).
Finally, a number of recent studies have succeeded in directly linking increases in M&A activity to domestic shocks like deregulation and …nancial innovation (Mitchell and Mulherin, 1996; Mulherin and Boone, 2000; Andrade and Sta¤ord, 2004). The question of whether M&A also plays a role in the industrial restructuring necessitated by trade liberalization shocks, however, has not yet been addressed in a rigorous way. While there is some descriptive and anecdotal evidence to the a¢ rmative (Chudnovsky, 2000; OECD, 2001), no clear econometric results have been presented sofar.2 This is the gap the present contribution tries to …ll.
The remainder of this paper is structured as follows. Section 2 presents a simple model of trade liberalization and resource transfer via M&A. This section is intended to highlight the principal economic mechanisms at work and to give some guidance for the subsequent empirical analysis.
Section 3 provides additional background information on CUSFTA and section 4 describes the data. Section 5 proceeds to an empirical investigation of changes in M&A activity in the wake of CUSFTA, section 6 compares characteristics of targets and acquirers and section 7 provides evidence on the quantitative importance of M&A as a form of resource transfer. I conclude with a summary of …ndings and directions for future research (section 8).
2 Theoretical Framework
How might trade liberalization lead to increases in M&A activity? This section presents a simple model of M&A as a means of resource transfer between …rms in order to illustrate one potential mechanism. The model’s underlying idea is that all …rms possess assets that are of interest to other …rms, like speci…c production skills, marketing capabilities or physical capital (in the following I will simply talk of capital). Changes in demand and supply conditions will lead to changes in …rm-speci…c demand for these assets, with expanding …rms wanting to increase their stocks and contracting …rms looking for potential buyers. The M&A market then provides a
2An earlier study by Mitchell and Mulherin (1996) and a recent working paper by Greenaway et al. (2005) present (mixed) evidence on the link between import penetration rates and M&A. However, since there is no exogenous variation in this measure of exposure to trade, it is not obvious whether their results can be interpreted in favor or against a link between trade liberalization and M&A. For example, any negative productivity shock that triggers restructuring of a given industry is likely to involve M&A (see Andrade et al., 2001). At the same time, the decline in the sector’s relative productivity as compared to the rest of the world will lead to more imports and a higher import penetration rate. Such issues are reminiscent of the problems which plagued earlier studies on the link between trade and mark-ups, …rm size or productivity (as discussed in Tybout, 2001, or Fernandes, 2003).
channel through which the necessary transfer can take place. Against this background, I study the e¤ect of the demand shock arising from bilateral trade liberalizations such as CUSFTA.
The crucial feature of this shock is its di¤erential e¤ect across …rms with di¤erent levels of productivity. As a number of studies have shown, setting up export activities is costly and requires an initial investment (see Roberts and Tybout, 1997; Bernard and Jensen, 2004). Thus, only more productive …rms that can a¤ord these …xed costs will bene…t from liberalization through increased exporting opportunities. Low productivity …rms, in contrast, will su¤er lower pro…ts due to more intense product market competition from foreign …rms while at the same time being unable to bene…t from better access to the foreign market.3 Thus, while exporters need additional capital in order to expand operations, non-exporters attach less value to their existing capital stock. The presence of an M&A market then allows the two parties to engage in a mutually bene…cial transfer of capital.
The model presented below tries to capture this intuition in the simplest possible framework, building on the earlier contributions by Melitz (2003) and Jovanovic and Rousseau (2002). I analyze a setting with two symmetric countries in which M&A is used to transfer capital between
…rms with di¤erent productivity levels. I start in an initial steady state equilibrium in which
…rms have already acquired the optimal capital stocks associated with the prevailing level of trade costs. I then shock this equilibrium by an unanticipated lowering of trade barriers which triggers a transfer of capital via M&A from non-exporters to exporters (i.e. from less productive to more productive …rms).
2.1 Model Setup and Initial Equilibrium
Following Melitz (2003), I analyze a setting with two symmetric countries, home and foreign. In each country, …rms produce di¤erentiated varieties under monopolistic competition. Constant per-period demand in the initial steady state is generated by standard CES preferences:
u(q) = Z
"
q( ) 1d
1
where is the set of varieties available (both domestically produced and imported) andq( ) is consumption of any given variety. Utility maximization by consumers yields demand (q) and expenditure levels (r) of any variety as q( ) = p( ) P 1E and r( ) =p( )1 P 1E. In these expressions, p( ) is the price of variety , >1 the elasticity of substitution between any two varieties andP the CES price index de…ned as P =hR
" p( )1 d i11
. Total expenditure E consists of aggregate pro…ts only which I normalize to one in the following.
Turning to the supply side, I assume for simplicity that varieties are produced using non- depreciating capital (k) as the only factor of production. Firms are heterogenous in productivity levels (') and the amount of capital required to produce a given amount of output (q) is given byk= 'q +F. This production function implies a minimum capital stock ofF which …rms need to acquire in order to enter the market.
3This di¤erential e¤ect of bilateral trade liberalizations across …rms is also analyzed in Melitz (2003).
Both economies are endowed with a …xed capital stock ofK which is owned by …rms. Capital is traded on an M&A market at a price ofi=(1 ) where is the exogenously given and time- invariant discount factor (and i is thus the amortized per-period cost of acquiring one unit of capital). Writing the M&A price in this way facilitates the comparison of lifetime revenues and costs needed below for the …rms’ optimization problem. Capital acquired on the M&A market takes on the acquirer’s productivity ' after acquisition but I assume that the target’s variety cannot be used.4 Note that it would be straightforward to allow for internal investment or a market for used capital as additional channels through which …rms can adjust their capital stocks. Since none of the principal …ndings would be changed by these extensions, however, I prefer to stick to the more tractable model outlined here.5
As said, I consider an initial steady state equilibrium in which no …rm has an incentive to exit or enter the market or change its capital stock level. First consider the determination of the optimal capital stock of active …rms in this equilibrium. With every unit of capital …rms hold in addition to F, they can generate per-period revenues of p' but face opportunity costs of i=(1 ) since they could also o¤er their capital for sale on the M&A market. Since every
…rm is a monopolist for its variety, it chooses a price-output combination that maximizes total discounted pro…ts, given by T(') = 1pq 'q +F 1i . The optimal levels of prices and per- period output are thus p(') = 1'i and q(') = h
1 i '
i
P 1, requiring a capital stock of kd(') =h
1ii
' 1P 1+F.
In addition to selling domestically, active …rms can also export to the foreign market. However, they incur variable ”iceberg”-type trade cost in doing so, i.e. for every unit they ship only 1= units arrive while the rest melts during transport. The corresponding export price is thus px(') = 1 'i and per-period exports areqx(') =h
1 i '
i
P 1. In addition to incurring the variable trade costs measured by , exporters also have to make a one-time capital investment of Fx in order to serve the foreign market. Thus, total capital demand for export production is kx(') = h
1i i
' 1P 1 +Fx. Note that the investment Fx is needed in addition to the domestic setup capitalF and can be thought of as adapting products to foreign standards, establishing local distribution networks etc. (see Roberts and Tybout, 1997).
Given active …rms’ optimal capital stocks, it remains to determine the set of active …rms.
In each market, there is a large number (Me) of potential entrants. Firm productivities are initially drawn at random from a cumulative distributionV(') but all …rms acquire knowledge
4The assumption that productivity is owner-speci…c is a standard way in the theoretical literature on M&A to assure the pro…tability of mergers (e.g. Bjornvatn, 2004; Jovanovic and Rousseau, 2002). It is consistent with empirical observations for the U.S. that plant productivity increases after acquisitions by more productive owners and decreases if the acquirer’s plants are less e¢ cient on average (Maksimovic and Phillips, 2001). On the other hand, ruling out use of a target’s variety eliminates incentives for the most productive …rm to take over all remaining
…rms. Such a situation would certainly be inconsistent with empirical facts. It would also render meaningless any analysis of capital transfers via M&A in response to external shocks.
5Internal investment could be introduced, for example, by allowing …rms to employ labor from an additional sector to produce new capital. Distinguishing a market for used capital from the M&A market would be possible by introducing variable costs for adapting capital for sale (see Jovanovic and Rousseau, 2002). These additional forms of adjustment would put upper and lower bounds on the M&A price but would not eliminate resource transfers via M&A in reaction to trade liberalization.
about their productivity parameter ' before entry, i.e. before acquiring the minimum capital amount F or any additional capital.6 Thus, only those …rms will produce for which the sum of discounted future operating pro…ts given by 1pq 'q1i is at least equal to the setup costs F i=(1 ). Similarly, only …rms that can cover the …xed exporting cost Fxi=(1 ) through future exporting pro…ts will enter the export market. These two entry conditions can be used to obtain expressions for the threshold productivities at which production for the domestic and foreign market becomes pro…table (denoted' and 'x, respectively). Appendix A.1 provides the corresponding derivations and results but my interest here is on the resulting levels of capital demand for domestic and export production.
Demand for capital for domestic production (kd) comes from all …rms with' ' while …rms with ' 'x need additional capital (kx) to produce for the export market. To obtain explicit solutions for ' , 'x, kd, and kx, I choose a speci…c distributional form for V('). In line with other contributions in the heterogeneous …rm literature (e.g. Melitz and Ottaviano, 2005), I let' be Pareto-distributed, i.e. with cumulative densityV(') = 1 ' a, where >0,a > 1>0, and ' . With these assumptions, I can determine the market clearing price i=(1 ) and derive total capital stocks used for exporting and domestic production (see appendix A.2 for details):
Kd=
Z 1
'='
kd(')Mev(')d'=K
"
1 + a Fx F
1 a 1
# 1
(1) and
Kx=
Z 1
'='x
kx(')Mev(')d'=K
"
1 + a Fx F
1 a 1
# 1
(2) where 11a <0since by assumption a > 1>0.
2.2 Bilateral Trade Liberalization
Now consider an unanticipated decline in variable trade costs . Similar to Melitz (2003), I focus on a comparison of the old and the new steady state equilibrium and in particular on the changes in capital allocation between the two equilibria. It is clear from (1) and (2) that the amount of capital used for domestic and export production will be di¤erent in the new equilibrium, with Kx increasing and Kd decreasing. Intuitively, increased presence of foreign exporters will lower revenues for local …rms from production for the domestic market, implying lower returns to a
…rm’s existing capital stock. Consequently, import competing …rms o¤er part of their capital stock for sale on the M&A market and any …rm with'below the new entry threshold' will use M&A to exit the market altogether. While trade liberalization thus leads to an increase of supply
6Introducing uncertainty of potential entrants about their future productivity levels combined with an exogenous probability of …rm death as in Melitz (2003) would allow generating continuous entry and exit of …rms and steady state M&A activity (in the sense that entrants with insu¢ cient productivity would want to immediately resell their assets). However, the basic intuition of trade liberalization leading to a reshu- ing of resources to more productive
…rms can equally well be captured in the simpler model presented here.
in M&A capital, it also increases capital demand for export production. This is since lower costs for accessing the foreign market imply larger market shares for exporters who in turn demand additional capital. Better access to foreign markets also lowers the minimum productivity level required for pro…table exporting ('x), leading to an increase in the number of exporters.
Since the total capital stock per country is …xed atK, any increase in export capital demand is o¤set by an equal decrease in capital demand for domestic production. Thus, the total amount of reallocation of capital into export production can be determined by di¤erentiating either of expressions (1) or (2) with respect to . Opting for (1), I obtain:
dKd= a K
[1 + ]2 d >0 where I de…ned = a FFx
1 a
1 > 0 as an overall measure of initial trade costs. The total amount of capital transfers is simply the absolute value of this derivative, i.e. T =jdKdj. Since a,K, and are all positive,T can be written as:
T = a K
[1 + ]2 jd j (3)
That is, the amount of resource transfer via M&A is increasing in the magnitude of trade lib- eralization (as captured by jd j).7 Also note that capital is channelled from non-exporters to exporters. Since the presence of …xed exporting costs means that only the most productive among the active …rms will export, the transfer of capital is in e¤ect from less to more productive
…rms (see appendix A.1 for a formal derivation). Finally, note that revenues (r) and per-period pro…ts net of capital costs (that is,(1 ) T) are increasing functions of productivity ' in this model. This implies that acquiring …rms are also larger (in terms of sales) and more pro…table than targets.
2.3 Extensions and Questions for the Empirical Analysis
Although the model just presented is highly stylized, its central intuition holds much more gen- erally: trade liberalization has asymmetric e¤ects across …rms which in turn necessitates a redis- tribution of resources via M&A. In the within-industry setting analyzed here, this leads to the prediction that decreases in bilateral trade barriers lead to a transfer of resources from import- competing …rms to new and existing exporters. While a within-sector analysis will be part of the empirics, it is however useful to be aware of whether and how the theoretical results would have to be modi…ed in a more general setting.
First, while the model assumes two symmetric trading partners, the U.S. market is about ten times the size of the Canadian market. This suggests that trade liberalization should have a
7Note that interpreting the whole of T as M&A assumes that the export and domestic production unit of a
…rm sell or acquire all of their capital through the M&A market. Alternatively, one could assume that exporters reallocate capital internally from domestic to export production and acquire only the shortfall on the M&A market.
While this assumption considerably complicates the analysis, the principal results on which I will rely for my empirical analysis will remain unchanged: M&A is increasing in jd j and jd jenters the reallocation volume T multiplicatively (results available from author upon request).
much stronger e¤ect on M&A activity in Canada since increases in both import competition and exporting opportunities will be substantially bigger there.8
Second, extending the model to multiple sectors raises the possibility of diversifying or con- glomerate M&A transactions that go across industry boundaries. The basic intuition of the model will still apply, however: …rms want to acquire production capacity in other industries through acquisitions both because of improved exporting opportunities there or because increased import competition has made assets cheaper. Since the target’s capital is likely to be sector speci…c in the vast majority of cases, this argument also makes clear that the relevant reductions in variable trade costs in such a multi-sector model are the ones facing the acquisition target. This is because the acquirer will have to use the new production capacity to produce the target industry’s goods.9 Finally, acquisitions might also be cross-border in nature, e.g. expanding foreign exporters may want to acquire import competing domestic …rms. While the decrease in the latter …rms’
reservation price for their assets will encourage acquisitions, there will also be a counterbalancing e¤ect for horizontal M&A arising from tari¤-jumping considerations: decreases in variable trade costs make it easier to serve the foreign market via exports and thus reduce the incentives to establish production capacity there via acquisitions.10
The second key implication that arose from the theoretical model was that resource trans- fers will be from less to more productive …rms (since exporters are more productive than non- exporters). Again, a similar prediction should hold for acquisitions across both national and industry borders since M&A will only create value for the buyer if the acquired assets can be put to a more pro…table use. The productivity advantage of the acquiring …rm and the ensuing selection into exporter status is what allows this increase in pro…tability in my model.
To summarize, the model and the above discussion suggest addressing the following questions in the empirical analysis:
1. Do reductions in variable trade costs (tari¤ cuts) lead to more takeovers of …rms in the a¤ected sector? Is this e¤ect stronger in industries with larger tari¤ cuts (as predicted by equation 3)?
2. Is the e¤ect similar for within- and cross-industry acquisitions? Is it similar for domestic and cross-border transactions? Is there a stronger impact on the M&A activity in the smaller Canadian market?
3. Are acquirers more pro…table and more productive than targets? Again, does this e¤ect vary across the di¤erent M&A categories (within- vs. between-industry and domestic- vs.
8This intuition can be formalized by extending the above model to asymmetric countries. This requires a freely tradable numeraire good to …x the price of capital and to allow the derivation of closed form solutions (results available from the author upon request).
9An easy way of formalizing this intuition would be in a two sector model in which …rms can use production capacity in the other sector at their own productivity level'but …rst have to make an investmentIto acquire the necessary sector-speci…c production know-how (this would be addition toF). If the productivity of an acquirer from the non-liberalizing sector is high enough to be an exporter in the liberalizing sector, a lowering of trade costs might raise its potential pro…ts above the thresholdI and trigger entry.
1 0Both Bertrand and Zitouna (2005) and Bjornvatn (2004) formalize this trade-o¤ between declining reservation prices of potential targets and better export access to the foreign market.
cross-border)?
Answers to these questions will shed light on the qualitative characteristics of M&A as an adjustment mechanism in the face of trade liberalization. A further interesting question that arises is whether resource transfers via M&A are also quantitatively important. While the nature of my dataset does not allow a de…nitive answer to this question, I will provide some evidence that the overall amount of transfers is indeed likely to be large (section 7).
3 The Case of CUSFTA
The particular liberalization episode I will use for my empirical investigation is the Canada-United States Free Trade Agreements (CUSFTA) of 1989. The idea of abolishing trade barriers between Canada and the U.S. had been around for some time before CUSFTA but strong opposition in Canada had led to the eventual failure of all prior attempts at implementing free trade. Against this background and again against substantial political opposition, negotiations for CUSFTA started in May 1986, were …nalized in October 1987 and the treaty was signed in early 1988.
The agreement came into e¤ect on 1 January 1989 which was also the date of the …rst round of tari¤ cuts. Tari¤s were then phased out over a period of up to ten years with some industries eventually opting for a swifter phase-out.
In terms of economic analysis, CUSFTA presents several advantages over other trade liberal- izations. First, the main instrument of liberalization - tari¤ cuts - is easily quanti…able and shows a large variation across sectors which allows for the implementation of a di¤erence-in-di¤erences estimation strategy. Secondly, CUSFTA was a clearly de…ned policy experiment in the sense that it was neither part of a larger packet of market reforms nor was it introduced in response to a macroeconomic shock, two factors that have made the identi…cation of trade reform e¤ects extremely di¢ cult in other settings (Rodriguez and Rodrik, 2001; Tre‡er, 2004). In this sense, the reductions in tari¤ rates triggered by CUSFTA can to a large extent be regarded as exogenous - indeed, Tre‡er (2004) performs formal statistical tests for a wide range of speci…cations and dependent variables but …nds little evidence to the contrary.
In the context of studying the impact of trade liberalization on M&A, CUSFTA has two additional advantages. First, it was largely unanticipated since its rati…cation by the Canadian parliament was considered highly unlikely as late as November 1988.11 The fact that its even- tual implementation thus came very much as a surprise to all participants considerably reduces concerns about anticipatory M&A activity and makes the years before 1989 a suitable control period. In addition, CUSFTA was a liberalization agreement between industrialized countries
1 1See Morck et al. (1998) for a chronology of the events leading up to the eventual rati…cation of CUSFTA.
During the entire process, rati…cation was considered unlikely given both the prior history of failed rati…cations of already negotiated free trade agreements with the U.S. and the strength of the opposition to CUSFTA. Indeed, John Turner, the opposition leader and a strong opponent of free trade with the U.S., publicly vowed as late as October 1988 that he would dismantle CUSFTA in case of victory in national elections scheduled for November 1988. Since his Liberal Party had a lead of at least 10% in opinion polls until right before the election, rati…cation did indeed seem unlikely. However, against all odds, the Canadian Conservative Party emerged as the surprise election winner and the government was returned with a parliamentary majority su¢ cient to ratify CUSFTA.
with developed …nancial markets and few restrictions on mergers and acquisitions, at least in comparison to most other developing and developed countries. Indeed, although there exists, to my knowledge, no econometric evidence to date, there is some anecdotal evidence that CUSFTA has led to an increase in M&A activity (OECD, 2001). Given that a number of existing studies have shown that there has also been a substantial impact on economic variables other than M&A activity (e.g. Tre‡er, 2004, on productivity and employment; or Head and Ries, 1999, on plant scale and number of plants), it does thus not seem unreasonable a priori to expect an e¤ect of CUSFTA on the acquisition behavior of …rms.
4 Data and Descriptive Statistics
In line with existing studies, my empirical analysis of CUSFTA’s impact on M&A activity focuses on the manufacturing sector which still represents the bulk of tradable goods in an economy and is thus the sector most directly a¤ected by trade liberalization. The time frame for my analysis is 1985-1997, the period for which I have data on tari¤s, M&A activity and …rm-level characteristics of targets and acquirers.
Tari¤s and M&A Activity. I use annual three-digit U.S. and Canadian tari¤ data (140 industries) as my measure of the extent of trade liberalization.12 While CUSFTA also included provisions on non-tari¤ barriers, reductions of tari¤s were the main instrument of liberalization.
As has been pointed out among others by Tre‡er (2004) and Topalova (2004), tari¤ cuts also have the advantage of being a direct policy instrument and are as such less susceptible to endogeneity problems. This is in contrast to other more indirect measures like import penetration rates which are the result of a complex interaction process with a large number of additional factors.13
Data on M&A activity in the manufacturing sector comes from Thomson Financial’s World- wide M&A database. The principal sources of information used by Thomson are over 200 English and foreign language news sources, SEC …lings and their international counterparts, trade publi- cations and proprietary surveys of investment banks, law …rms and other advisors. The database includes all corporate transactions involving at least 5% ownership of a company and a transac- tion value of one million USD or more or where the value of the transaction is undisclosed. In line with the discussion in the previous sections, I use all M&A deals involving acquisitions of U.S. or Canadian manufacturing targets by other U.S. or Canadian …rms, yielding approximately 23,500 transactions in the period under study (1985-1997). I de…ne ”M&A” broadly to include sales of individual business segments and divisions as well as of entire companies. This is consistent with the idea from the theoretical model that M&A can both be a form of contraction and total …rm exit. I further consider acquisitions of both majority and minority interests since there is strong
1 2The data are the same as those described in Head and Ries (1999). I would like to thank Keith Head for making them available to me. Appendix B provides some additional details on their construction.
1 3Compare footnote 2 and Rodriguez and Rodrik (2001) for a more general discussion of the pitfalls of various other indirect measures. Of course, tari¤ rates are at the discretion of policy makers and as such subject to di¤erent endogeneity problems. However, as argued in the previous section, such concerns have less weight in the case of CUSFTA where tari¤ cuts were unexpected and largely exogenous (at least once one controls for the variation in initial tari¤ levels - as I will do by using industry …xed e¤ect, see below).
evidence that signi…cant in‡uence for the acquirer is already given at participation rates well below 50%.14 Transactions are classi…ed into three-digit industries and matched with the tari¤
data according to the primary activity of the target company or the acquired business segment (see appendix B for details). For the purpose of this study, I will use the number of mergers and acquisitions in a given period as my principal indicator for M&A activity. Using numbers rather then aggregate deal volumes has two principal advantages. First, it is the much more readily available indicator since for the majority of deals, transaction values are not published (this is the case for 55% of deals in my dataset). Second, value measures are extremely sensitive to the treatment of very large deals which often make up signi…cant proportions of the total deal volume despite representing only a few out of several thousand transactions every year. In my sample, for instance, the three biggest deals on average make up about 20% of the aggregate deal volume in a given year. Within three-digit industries (the aggregation level of my empirical analysis), the biggest transaction alone accounts on average for over 30% of the entire industry volume during 1985-1997.15
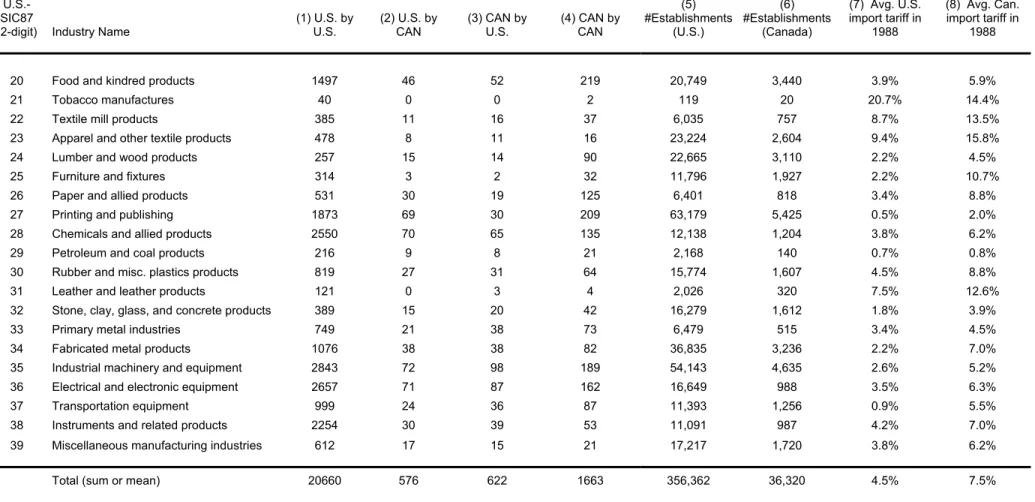
Tables 1 and 2 provide some descriptive statistics on M&A activity and manufacturing tari¤s in North America over the period 1985-1997. I start with an analysis of target …rms. The …rst four columns of table 1 show the number of M&A transactions in the U.S. and Canada at the two-digit level of the U.S. Industrial Classi…cation of 1987. As seen, domestic M&A activity (columns 1 and 4) is more common than cross-border transactions (columns 2 and 3), even for the smaller Canadian market. Looking across industries, it becomes apparent that there is substantial variation in the number of deals. One simple reason for this is probably that di¤erent industries have very di¤erent numbers of …rms and establishments and thus more or less
”potential” for takeovers. Sectors with more players usually also have lower concentration ratios and face less scrutiny by antitrust authorities. Columns 5-6 which list the average number of establishments per industry con…rm these conjectures: industries with more establishments have more M&A activity - the correlation coe¢ cient between the number of establishments and total M&A transactions is +52% for the U.S. and +55% for Canada.16 More subtly, there also seems to be a connection between M&A activity and initial tari¤ rates (columns 7-8): industries with higher import tari¤s in 1988 also experience less takeovers during the entire period 1985-1997 (the
1 4Morck et al. (1998) cite evidence that the threshold for e¤ective control lies on average at about 20% in the U.S. Similarly, the Canadian Competition Bureau (2002) considers all acquisitions of more than 10% of control rights as potentially anti-competitive, with the corresponding …gure for the U.S. being 15% (Brealey and Myers, 2000, chapter 33). In any case, minority acquisitions comprise only about 12% of transactions in my sample. See section 5 for robustness checks excluding this category.
1 5Robustness checks using value data despite these problems yield qualitatively similar results for domestic Canadian M&A activity as the count data estimates presented below (a "raw" regression with neither imputation of missing transaction values nor deletion of outliers yields an estimated per-percentage point e¤ect of tari¤ cuts on M&A activity of 14.6% - compared to 8.3% for the count results). For domestic U.S. transactions, these raw regressions yield a negative coe¢ cient on tari¤ cuts but this can be linked to just two to three massive outliers (in particular, the 20 billion USD acquisition of RJR Nabisco by Kohlberg, Kravis and Roberts in 1988). In any case, the qualitative picture that will emerge later on - a strong impact of CUSFTA on domestic Canadian M&A activity and a mostly insigni…cant one on the U.S. and cross-border categories - stays intact in these value regressions.
1 6The sources for the number of establishments are the U.S. Census Bureau and Statistics Canada. I use the number of establishments rather than the number of …rms since my de…nition of M&A includes both acquisition of entire …rms and of individual subdivisions and possibly plants.
correlation coe¢ cient is -32% for the U.S. and -48% for Canada). This seems in part to be a direct consequence of the relation between M&A activity and the number of establishments: highly protected industries are usually industries in decline which already have experienced shakeouts and have relatively few remaining players.
The next question is who the buyers of U.S. and Canadian manufacturing …rms are. Table 2 provides some information on this by listing the principal …eld of activity of acquiring …rms.
As the …gures show, roughly 70% of acquirers are also manufacturing …rms, both in the U.S.
and in Canada. Moreover, about 35% of transactions occur within the same three-digit sector and another 13% within the same two-digit sector, so that within-industry reallocation via M&A seems to be an important phenomenon. Around 17% of acquirers of U.S.-…rms (21% for Canada) have their principal …eld of activity outside manufacturing (SIC-codes 2-3), although this …g- ure probably overestimates the incidence of diversifying or conglomerate M&A. This is since about one quarter of non-manufacturing acquirers actually possess secondary …elds of activity in manufacturing, with the …gure being as high as 50% in some categories (see columns 3 and 7).17 The second to last line of table 2 lists a category of acquirers that deserves special attention.
The group ”Investors, n.e.c.”(SIC 6799) represents an amalgamation of di¤erent types of acquir- ers that are not easily classi…able elsewhere. The main subgroups of SIC 6799 are private equity and venture capital …rms, investor groups, and individual investors. In all cases, it seems likely that acquisition by these groups represents a signi…cant reallocation of resources in the sense that targets will be exposed to substantial changes in management practices, restructuring etc. Also, among investor groups, alliances of di¤erent manufacturing …rms are not uncommon so that part of SIC 6799 are indeed within-manufacturing acquisitions. For these reasons, I keep transactions involving SIC 6799 as part of my sample though I will present robustness checks excluding this category.
Target and Acquirer Characteristics. For the comparison of target and acquirer char- acteristics in section 6, I match the transaction parties from the Thomson M&A database to Compustat North America and Compustat Global using the CNUM-identi…er common to both datasets. Thomson Financial itself also provides …nancial data on a small number of targets and acquirers which I use to complement the information from Compustat. My indicators of
…rm performance will be net sales, pre-tax income, the number of employees, net capital stocks, and productivity and pro…tability measures based on these variables.18 The four indicators net sales, income, employees and net capital stocks are available for between 7,500 to 12,500 out
1 7Looking at secondary …elds of activity also increases the numbers of transactions that are potentially of within- industry nature. Columns 4 and 8 show the fraction of acquirers that have at least one manufacturing 3-digit SIC code that matches the primary or any secondary manufacturing SIC code of the target. If one counts all these transactions as intra-industry, the share of this reallocation type rises to 40% which represents only a modest increase of about 5%-points. Since this is clearly an upper bound, classi…cation according to primary …elds of activity seems to be a good approximation in determining the within- or between-industry nature of M&A.
1 8The exact sources for Compustat North America are data items 12 and 117 (net sales), 122 and 170 (pretax income), 29 and 146 (employees), and 8 and 141 ("net property, plants and equipment", used as proxy for net capital stocks). For Compustat Global, data are contained in items 1 (net sales), 21 (pretax income), 162 (employees), and 76 ("net tangible …xed assets", used as proxy for net capital stocks). I use 4-digit sectoral de‡ators to convert nominal values to 1987 values. I then convert entries in Canadian dollars to US dollars by using the exchange rate for the base year 1987.
of the 47,000 company-year combinations in my data (some companies are involved in several transactions in the sample period).
The use of Compustat implies that my sample for comparing target and acquirer character- istics consists mainly of publicly traded …rms (although about 5% of …rms are privately held).
I believe that this does not pose major problems for the analysis. First, publicly traded …rms make up a substantial fraction of the full sample of transaction parties used to analyze changes in M&A activity (about 35%, with private companies and …rm subsidiaries making up the remaining 65% in the Thomson M&A database). Second, as I will show in the next section, the impact of CUSFTA on publicly traded …rms was if anything slightly stronger than for the full sample of
…rms. Third, although the number of publicly traded …rms is small relative to the overall number of companies in Canada and the U.S., their overall share of output and employment is above 80%.19 Thus, even if target-acquirer di¤erences for non-publicly traded …rms were very di¤erent, the …ndings presented in section 6 would still have strong economic relevance.
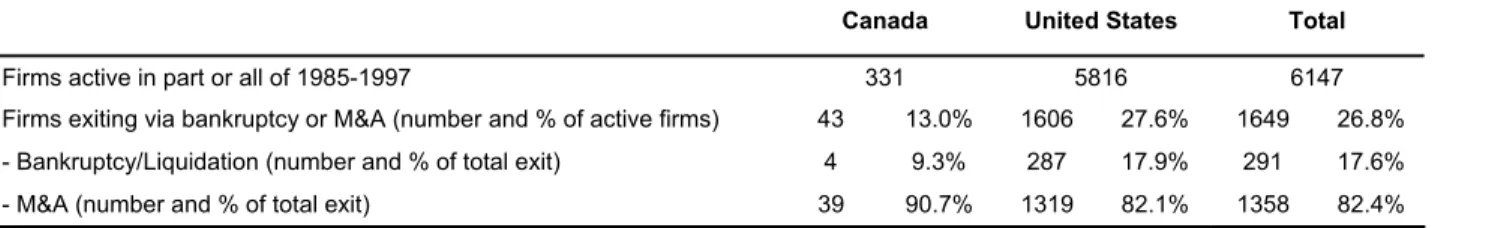
Quantitative Importance of M&A: For the comparison of the amount of …rm-level resource transfers via M&A, contraction and exit (section 7), I will again rely on information for publicly traded …rms from Compustat Global and Compustat North America. In addition to data on output (net sales) and employment, I use information on the reason for deletion of companies from the Compustat …les.20 I include all manufacturing …rms listed as active in either Compustat North America or Compustat Global at some point during the period 1985-1997. After dropping some smaller Canadian …rms for which no exit information is available, this yields a sample of 331 Canadian and 5827 U.S. …rms which again represent over 80% of manufacturing output and employment in North America.
5 Trade Liberalization and M&A
5.1 A First Look at the Figures
How has M&A activity in North America evolved over time and what was the impact of CUSFTA?
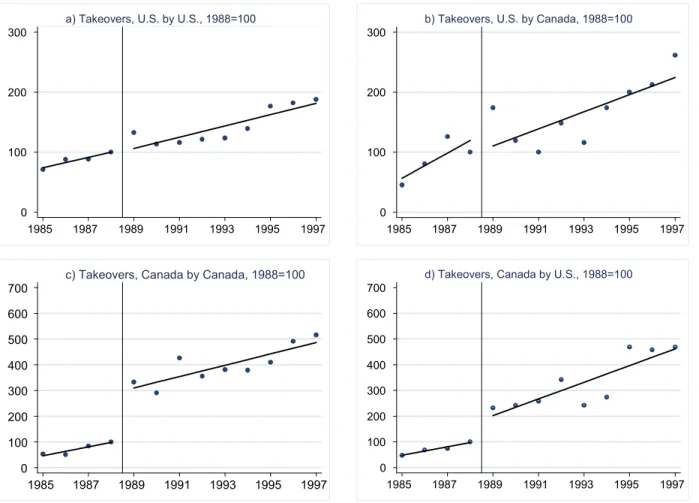
Figure 1) plots the number of yearly manufacturing M&A transactions over the period 1985-1997 for four di¤erent categories, all expressed as indices relative to 1988: domestic U.S. transactions, domestic Canadian transactions, acquisitions of U.S. …rms by Canadian …rms and acquisitions of Canadian …rms by U.S. …rms. The graphs also indicate the start date of CUSFTA (1 January 1989) by a vertical line and have linear splines …tted to the data points pre- and post CUSFTA.
The …gures do not reveal any clear e¤ect for both U.S. domestic activity and Canada-U.S.
takeovers. Takeovers of Canadian …rms, however, both by other Canadian and U.S. …rms, show a marked increase in 1989, the …rst year after the implementation of CUSFTA. At the same time,
1 9This …gure is based on a comparison of aggregate production and employment in Compustat North America and Compustat Global with comparable data from the UNIDO database.
2 0The relevant Compustat North America data items are 12 and 117 (net sales) and 29 and 146 (employees).
Date and reason for deletion are provided in data footnotes AFTNT33-AFTNT35. For Compustat Global, sales and employee data are contained in items 1 and 162, and reason and date of deletion in the variables INCO and INCOD.
all graphs display a general strong upward trend in the number of M&A deals over the entire period. This provides some …rst evidence on the problems of descriptive studies that comment on M&A activity in the wake of CUSFTA (such as OECD, 2001): the strong increases in transactions in the 1990s might simply re‡ect an underlying long-run trend. The before-after comparisons undertaken here do not have this problem although it could still be that changes around 1989 were due to other economy-wide factors contemporaneous to the …rst round of tari¤ cuts (for example, CUSFTA also contained a general liberalization agreement on cross-border capital ‡ows).
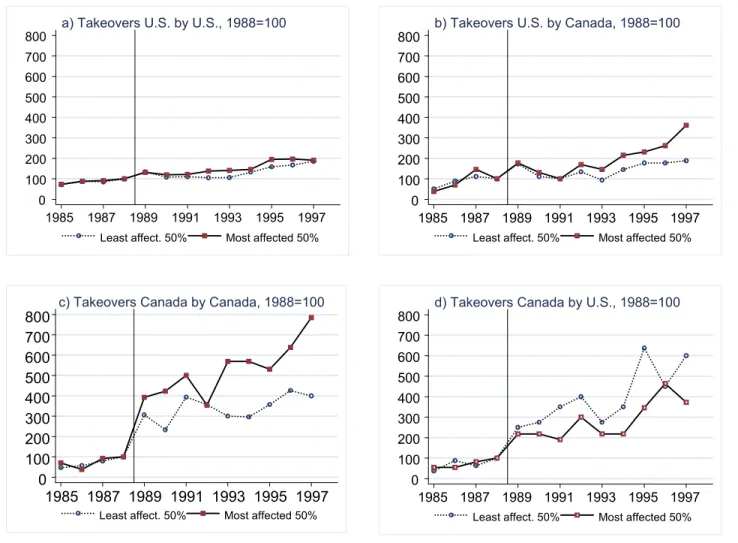
To provide stronger evidence that the observed changes in M&A activity are indeed due to the tari¤ cuts implemented through CUSFTA, I thus split transactions within each of the four categories into two groups (…gure 2). Those from the 50% of target industries that faced the steepest tari¤ cuts and those from the remaining 50%. I choose tari¤s levied by the target’s country for this classi…cation. In practice, U.S. and Canadian tari¤ cuts are very highly correlated so that results are similar when using the other tari¤ measure. From these …gures, a slightly di¤erent picture emerges. For the two domestic categories, the index of M&A activity is very similar across the two groups in the pre-CUSFTA period. From 1989 onwards, however, M&A activity in Canada increases by substantially more in the most a¤ected group. For the U.S., there is also a slightly more pronounced increase for this group although the di¤erence to the least a¤ected group is much smaller than in Canada. It thus seems that the impression from the initial graphs holds up to this di¤erence-in-di¤erences analysis. M&A activity in Canada rose sharply after 1989 and the magnitude of this increase seems to be related to the extent of tari¤
cuts across sectors. The impact on the U.S. is much smaller, consistent with the notion that the liberalization shock was substantially bigger in Canada which integrated with a market ten times her own size.
Turning to the cross-border categories (the two right hand side panels), the graphs show slightly more volatility than in domestic M&A activity, re‡ecting in part the smaller number of transactions across the U.S.-Canadian border. Still, it seems that e¤ects on cross-border M&A went in opposite directions. While Canadian acquisition activity in the U.S. shows a slightly stronger increase in the group of most a¤ected industries, the opposite holds true for takeovers of Canadian by U.S. …rms. This last …nding is consistent with tari¤-jumping motives as an additional determinant for horizontal cross-border M&A transactions. That is, in industries with stronger Canadian tari¤ cuts, U.S. …rms were less dependent on acquiring local production capacity to serve the Canadian market. Increasing returns to scale may have reinforced this trend by inducing U.S. …rms to concentrate production in their larger domestic market. Such a home-market-type e¤ect may also explain the stronger increases in Canadian acquisitions in the U.S. in the most-a¤ected group, which took place despite easier export access to this market.21
2 1An often cited example that …ts these explanations is the earlier North American Autopact of 1964 which liberalized automotive trade between Canada and the U.S.: no longer facing prohibitive tari¤s, U.S. …rms were able to concentrate production in their larger home market and serve the Canadian market through exports rather than through local production.
5.2 Econometric Speci…cation and Baseline Results
This section evaluates whether the impressions from the graphs of the last section carry over to a formal econometric analysis. Among other things, the results obtained so far have drawn attention to two potential pitfalls such an analysis faces. First, M&A activity shows strong inter- industry variation and is negatively related to initial tari¤ levels (see section 4). Since all tari¤s were eventually eliminated under CUSFTA, higher initial levels also meant stronger subsequent cuts, implying a potentially spurious correlation of tari¤ changes and M&A activity. Second, the strong increase in the number of mergers and acquisitions over the whole period 1985-1997 suggests the presence of a general economy-wide trend in M&A activity. Since all tari¤s came down after 1989 this could again lead to a spurious correlation with tari¤ cuts. To address these issues, I will implement a di¤erence-in-di¤erences approach by controlling for both industry and time …xed e¤ects.
To obtain guidance on the choice of an appropriate econometric speci…cation, I turn to the theoretical model derived earlier. There, the volume of capital reallocation was given by T = a K
[1+ ]2 jd j(equation 3), where jd j was the absolute change in variable trade costs, K an economy’s capital stock, a measure of initial trade costs (both …xed and variable), and a >0 the Pareto-distribution’s shape parameter.
First consider the choice of empirical proxies for jd j and T. In the model, variable trade costs are of the iceberg-type and thus relate to tari¤s t as = 1 +t which implies d = dt.
My measure for jd j = jdtj will thus be the absolute change in tari¤s from the pre-CUSFTA year of 1988 to the last year for which I have tari¤ data (1997). As dt 0 for all sectors, this absolute change isjdtj= dt=tari¤1988-tari¤1997. Because CUSFTA was a bilateral liberalization agreement and the treaty partners tended to protect the same sectors, the magnitude of U.S. and Canadian tari¤ cuts is very similar across industries. In line with previous empirical studies of trade liberalizations - which mostly look at unilateral tari¤ reductions by a particular country - I opt for domestic tari¤s. That is, I use Canadian tari¤ cuts when analyzing the impact of CUSFTA on takeovers of Canadian …rms and U.S. tari¤s cuts for transactions involving U.S.
targets.22 As already mentioned, my proxy for the amount of reallocation via M&A (T) is the number of transactions which I denote MA. In order to smooth the data and reduce the number of zero observations, I aggregate numbers over the pre- and post CUSFTA-period (1985-1988 and 1989-1997). This yields a panel with two time periods and 140 industries. With these choices of proxies forjd jand T, I can write my speci…cation as:
M A= a K
[1 + ]2 jdtj (4)
Given the multiplicative form of (4), one possibility would be log-linearization and estimation via OLS. However since the occurrence of zeros in MA is still frequent, in particular for the cross-
2 2Robustness checks using foreign tari¤ reductions as regressors yielded similar results which is unsurprising given the very high correlation of tari¤ cuts (in excess of 80%). An interesting area for future work would be to study more asymmetric liberalization agreements with su¢ cient independent variation in tari¤ cuts. Such agreements would allow to separately identify the e¤ects of import- and export-promoting policies on M&A activity.
border merger categories, such an approach is not feasible. Also note that MA is a non-negative and usually small integer, suggesting that count data models are a more appropriate choice here.
To obtain a corresponding speci…cation, I rewrite the right-hand side of (4) in exponential form:
M A= exp(lna+ lnK+ ln
[1 + ]2 + lnjdtj) (5) The identifying assumption I will initially make (but later relax) is that the various components of (5) besides jdtjare either time- or industry invariant and can thus be captured by time- and industry …xed e¤ects,di,dpre and dpost (wheredpre and dpost denote the pre- and post CUSFTA period, respectively).23 Writing (5) in expectations form and using the dummy variables just de…ned then yields a conditional mean exactly identical to the one found in …xed e¤ect count data models:24
E(M Aitjdt; di; dt) = it= exp(di+dpre+dpost+ dpostlnjdtjit) (6) Consistent estimates of the parameters in (6) can be easily obtained via …xed e¤ects Poisson esti- mation. I opt for Poisson rather than a negative binomial model since the former has the desirable robustness property that consistency of estimates will be achieved as long as the conditional mean (6) is correctly speci…ed - irrespective of whether MAitactually follows a Poisson distribution (see Wooldridge, 1999 and 2002; Santos Silva and Tenreyro, 2004). Standard errors will be a¤ected by deviations from the Poisson assumption but computation of variance-covariance matrices robust to overdispersion, heteroskedasticity and within-group correlation is straightforward (Wooldridge, 1999 and 2002).
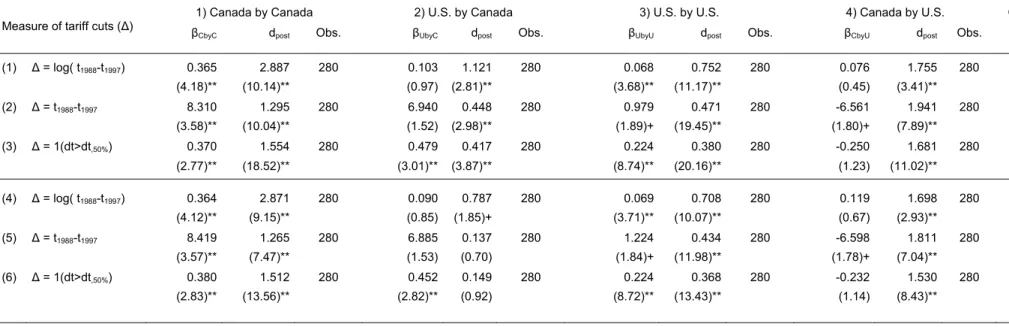
Table 3 reports results for my baseline Poisson …xed e¤ects model (6) for the full sample of acquirers, i.e. manufacturing …rms from the same three-digit sector as the target, manufactur- ing …rms from other sectors and …rms with principal activities outside manufacturing. Line 1 shows coe¢ cient estimates of and dpost for each of the four subgroups of M&A (domestic and cross-border transactions).25 As seen, the strongest impact of CUSFTA seems to be on domestic Canadian M&A activity which is consistent with the earlier graphical analysis. As an approxima- tion, the coe¢ cient estimates suggests that each doubling of tari¤ cuts in a given target industry led to an increase of 36.5% in the number of domestic Canadian M&A transactions. Results
2 3Since the parametera, initial trade barriers , and countries’ capital stocksKare all constant in the model, this identifying assumption is consistent with the earlier theory. Obviously, various industry-level shocks might cause time-industry-variation inaorK, a point which I discuss in more detail below and try to control for.
2 4Note that the below speci…cation implicitly sets tari¤ cuts in 1985-1988 to zero. This is necessary since my data sources do not contain US tari¤s for 1985 and 1986 and only imputed data for Canada (see appendix B).
However, as shown for example in Gu et al. (2003) and also evident in my Canadian tari¤ data, tari¤ changes in 1985-1988 were very small both in absolute terms and compared to the subsequent cuts. Thus, assuming a zero-change seems to be a good approximation (also see appendix B for a brief discussion of the very similar results obtained by using the imputed Canadian data).
2 5dpreis the excluded category so thatdpostgives the average relative increase of M&A activity in comparison to the pre-CUSFTA period that is not explained by tari¤ cuts. Note that contrary to what is sometimes asserted in the literature, there is no incidental parameter problem with the …xed e¤ects Poisson regressions (see Cameron and Trivedi (1998) for a proof). That is, conditional maximum likelihood estimation (using total industry transactions M Ai=P
tM Ait as the su¢ cient statistic) yields identical results to simple QML Poisson estimation with a set of industry dummies.
are also signi…cantly positive for U.S. domestic M&A activity, although the magnitude of the coe¢ cient estimate is only about 1/5 of its Canadian counterpart.
Lines 2-3 of table 3 show results for two alternative measures of tari¤ cuts. The …rst measure uses absolute changes in tari¤s, i.e. dpost (tari¤1988 tari¤1997) rather than dpost log(tari¤1988 tari¤1997). This gives equal weight to each percentage point of tari¤ cuts, irre- spective of the overall magnitude of the reduction. The second measure is a binary indicator taking the value one if an industry is among the 50% of industries with the highest tari¤ cuts, i.e.
dpost 1(dt > dt50%). This measure is thus similar to the one used in the graphic analysis from the last section. The results from these two alternative measures show a qualitatively similar picture to the baseline estimates for domestic M&A activity, i.e. the impact on Canada seems to have been much stronger.26 The coe¢ cient estimates for the absolute change in tari¤s - which is the most straightforward of all measures in terms of interpretation - indicate that for every percentage point decrease in tari¤s the number of takeovers of …rms in the a¤ected industries increased on average by 8.3%. Given that the mean decline in Canadian tari¤s at the three-digit level was about 8%, this suggests that CUSFTA increased M&A activity by approximately 65%.
The corresponding coe¢ cient for the U.S. is much lower (0.98) but still marginally statistically signi…cant. This again highlights the di¤erential impact of CUSFTA on the two markets, in particular if one takes into account that the mean U.S. tari¤ decline was only about 4% (yielding an estimated average impact on M&A activity of just 4%). Taking into account all three tari¤
cut measures, the picture is less clear for the cross-border merger categories since coe¢ cients are mostly statistically insigni…cant. Qualitatively, however, the estimates give a similar impression as the earlier graphs: Canadian acquisitions in the U.S. have gone up as a result of tari¤ cuts while U.S. acquisitions in Canada have come down.
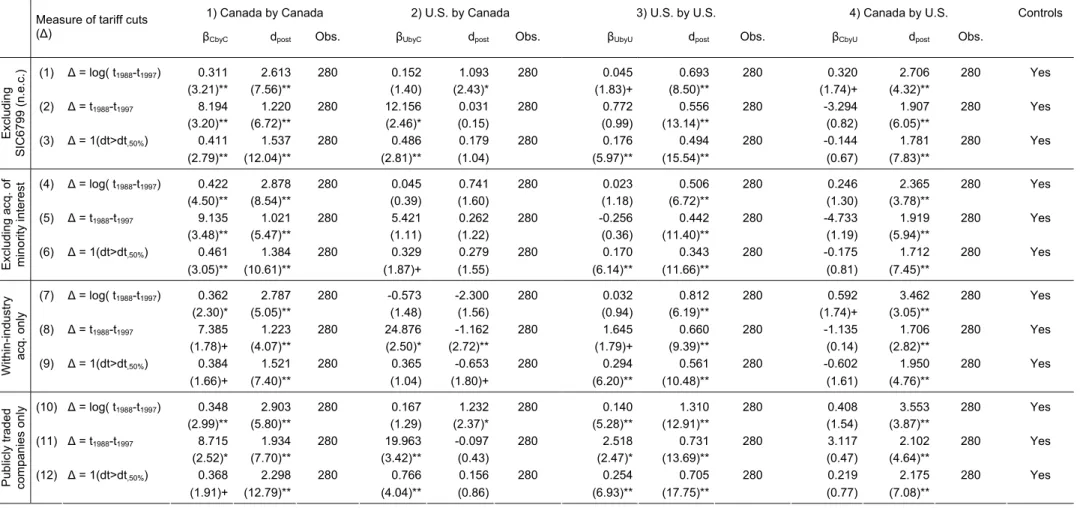
5.3 Robustness Checks
Control Variables I have so far relied on the assumption that tari¤ cuts were the only time- and industry-varying determinants of M&A activity, which allowed me to identify the e¤ect of CUSFTA from a simple di¤erence-in-di¤erences approach without additional controls. While M&A activity will in practice also be in‡uenced by other time-industry varying factors, one has to proceed carefully when choosing appropriate control variables. First, I will refrain from using a number of obvious industry-level variables like employment, output, the number of …rms or productivity growth. Besides likely endogeneity problems, the common concern with these variables is that there is ample evidence that they are themselves strongly in‡uenced by trade liberalization (for the e¤ects of CUSFTA see in particular Tre‡er, 2004, and Head and Ries, 1999).
Since it is indeed through their in‡uence on such variables that tari¤ cuts change incentives for M&A, controlling for them would invalidly attribute less of the increase in takeover activity to freer trade. A similar criticism applies to a number of determinants that have been proposed in
2 6Note that according to standard model selection criteria for maximum likelihood models (e.g. pseudo-R2s) the theory-based based measure (log tari¤ changes) actually provides a marginally better …t than the two adhoc- measures. For the three baseline speci…cations estimated here, the results for the pseudo-R2s are: 0.87 (log changes), 0.86 (absolute changes), and 0.85 (binary measure).