Nevertheless, the indicators presented and the resulting conclusions are the sole responsibility of the Ivie team. Taking into account the diverse perspectives and interests that potential users of the data may have when using the rankings.
Limitations of rankings and possible improvements
- RISKS OF THE RANKINGS
- LIMITATIONS OF THE INTERNATIONAL RANKINGS
- HOW TO COMPILE A RANKING
- INTERNATIONAL INITIATIVES FOR IMPROVEMENT
Thus, of the roughly 17,000 higher education institutions in the world, the best-known international rankings only provide information on about 1,000 universities, of which 500 are compared. Sustainability, in time and financially, so that students do not have to pay any costs for using the rankings.

Methodology
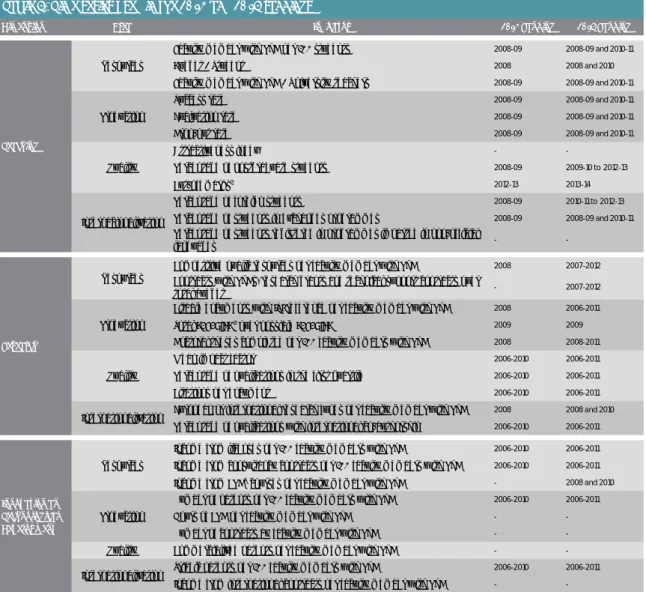
- ACTIVITIES STUDIED
- DISAGGREGATION OF ACTIVITIES
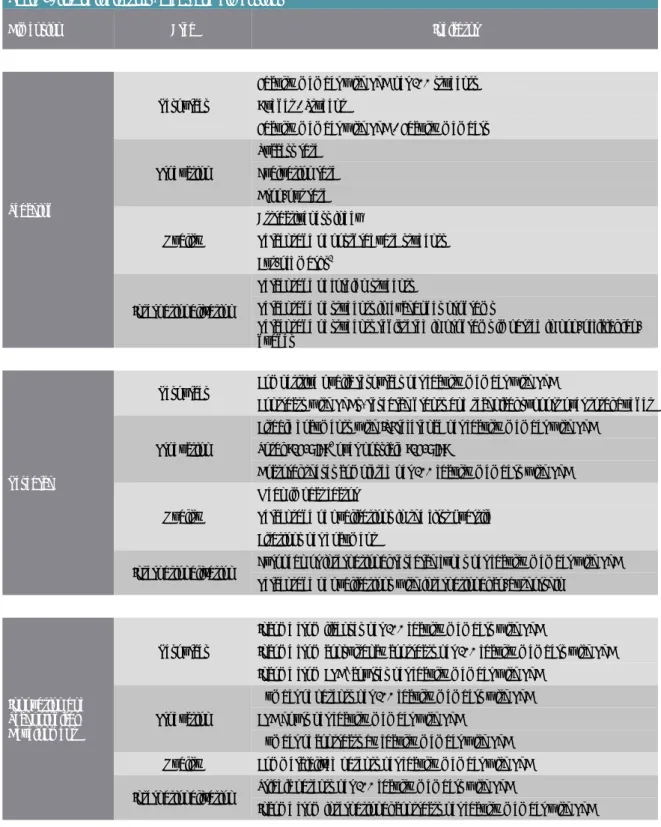
- INDICATORS, AREAS AND DIMENSIONS
- TIME COVERED BY THE DATA University rankings, though they aspire to offer an
- CRITERIA FOR THE
- Allocation of missing data
- Standardization of indicators One of the pillars upon which the construction of
- Weighting and aggregation of indicators within an area
- Weighting and aggregation of the area indicators within each dimension
- Weighting and aggregation of the dimensions to obtain the rankings
- RANKINGS OF VOLUME OF RESULTS VS. RANKINGS OF
- Interest of the two approaches The existing rankings adopt on occasions an
- Treatment of the size of universities
These problems do not have a perfect solution and we had to choose one of the alternatives. This addition was made possible thanks to the cooperation of the Spanish Ministry of Economy. The underlying process of compiling any ranking of universities constructed is structured according to the following steps — the fifth step is unnecessary in the case of the partial.
This occurs, for example, with the average impact of the publications index and its percentage in the first quartile. Consequently, the different simple indicators will be included with the same weight in the calculation of the arithmetic mean. Weighting and aggregation of the dimensions to obtain the ranking. Dimensions to obtain the ranking.
The final stage of the methodology determines how the various scales of the ISSUE project are constructed. Second, for an overall ranking that corresponds to the activities of the university as a whole, the three dimensions are weighted based on experts. For example, scholarly output is measured as a function of the number of faculty members with PhDs, while teaching output is relativized by the number of students.
We considered three indicators of university size: number of faculty members, number of students, and budget.
Rankings personalized by the user
EXAMPLES OF PERSONALIZED RANKINGS
Experts prepare the set of dimensions and relevant variables and, after the user has presented his/her assessment for each area, the online tool shows a synthetic quality of life index that takes into account the weights given by the user. In this case the considered user is the student who wants to choose a degree and is offered the opportunity to choose the subject he/she wants to study, the type of subject he/she is interested in and the aspects he/she considers most important (teaching, opportunities subsequent employment, research, etc.).
DESCRIPTION OF THE WEB TOOL FOR GENERATING PERSONALIZED
The tool is presented on the screen of the project website via the Select University tab. The importance to the user of the education, research and innovation and technological development activities. The names of the degrees that appear in the drop-down list are also not exhaustive or literal, as for example the bachelor's degrees with very similar names are grouped together.
For this, the user must mark those selected in the following table, where one of the options is "Any region". In this case, their interest will be to know which of the offered studies are valued best in the fields he/she is considering. After the user has entered the information in the three fields, the "Create Your Own Ranking" button appears on the screen.
When this button is clicked, the personalized ranking corresponding to the selection criteria entered will be displayed, listing in order the corresponding bachelor's degrees from the universities offering these studies in the areas considered. Together with the names of the bachelor's programs, a link to the web address of each university will appear.
COMPLEMENTARY INFORMATION ON THE
To determine the size of the corresponding icons, a synthetic indicator13 was calculated for each of them, based on the available data, which is generally per province. After ranking the universities in order of these indices, a large icon is assigned to those located in the tertile with the highest value in the distribution (best climate, highest cost, greatest connectivity, most socio-cultural opportunities) and ' an identical but smaller icon around that in the second tertile (between 33% . and 66%); finally those in the third tertile are indicated with small icons. It should be taken into account that three of the four environmental characteristics are more favorable the larger the icon (climate, transport and socio-cultural opportunities), while a higher cost of living should be understood as less attractive.
Finally, the 2014 edition includes as a novelty the cost per credit for the more than 2,500 degrees analyzed by U-Ranking. These prices may vary according to the autonomous community, university, cycle, despite the maximum limit set by the Spanish Ministry of Education, Culture and Sports14. Each sample was then divided into three sets bounded by the tertiles of each distribution to then be assigned to each group.
The amount that corresponds each year is determined by decree of the Community itself within the limits established by the Government with the proposal of the General Conference for University Policies. For this reason, and as a guide, the U-Ranking user will be able to find the price per credit at first registration for each Bachelor's degree.

Main results
- ISSUE RANKING OF PRODUCTIVITY (ISSUE-P)
- ISSUE RANKING OF VOLUME OF RESULTS (ISSUE-V)
- VOLUME RANKING VS
- ISSUE RANKING VS. SHANGHAI RANKING
- COMPARISON OF RESULTS OF OTHER INTERNATIONAL RANKINGS
- RESEARCH VS. TEACHING
- RANKINGS OF TEACHING, RESEARCH, AND INNOVATION AND
As in Table 7, each column contains one-third of Spanish universities according to their ranking order. The differences in the values of the indicators are much greater with the scale due to the importance of size. The first of them (Figure 4) represents the position of Spanish universities on the ISSUE-V scale on the horizontal axis, while the Shanghai scale represents it on the vertical axis.
The case of UNED stands out, which occupies a significantly better position in the ISSUE-V ranking than in Shanghai. Universities above the diagonal, on the contrary, are relatively more established in the adaptation for Spain of the Shanghai ranking. The remainder is Universitat Pompeu Fabra, placed in the second tertile of the ISSUE-V ranking.
The results correspond to our adaptation of the Shanghai Ranking by Docampo (2013) for Spanish universities ('Shanghai Ranking extended'). In it, almost half of the universities change tertiles between one location and the other. In the middle of the diagram (figure 6), the seven universities are seen placed in the first tertile in the three rankings.
The relative differences of the interquartile ranges are even greater in the case of this last dimension.

Conclusions
Most of them are also part of the group of Spanish universities that mostly appear at the top of the most popular international rankings, such as those of Shanghai, THE and QS. The ISSUE-V results largely agree with those of the Shanghai ranking - because this index is essentially based on volume indicators of results - although our overall ranking gives a more important role to the teaching dimension. Nine of the ten Spanish universities that currently appear in the Top 500 of the Shanghai ranking are part of the sixteen that make up the first tertile of the ISSUE-V ranking.
The fact that the results of the general rankings, which are based mainly on research indicators, match fairly well with others that take into account different dimensions (teaching, research, innovation and technological development) indicates the higher or lower quality of the individual university in But this correlation is far from perfect, so it is important not to leave out any dimension of university activity. Above all, the research scale is imprecise when we want to compare the pedagogical activity of universities, which is of interest to a large proportion of students.
The role of the web tool that has been developed is to provide students with quality information and rankings that can be accessed very easily. One general conclusion from the results of the project is that it confirms a notable diversity among the Spanish public universities in terms of their ability to generate results and their productivity.
Glossary of Indicators
Competitive public funding per PhD faculty member: Competitive public funding for non-directed research projects, including projects and complementary actions and ERDF funding, based on the total number of full-time PhD faculty members. ISI-referenced papers cited per PhD faculty member: ISI-referenced papers published per 100 PhD-equivalent full-time faculty members. Percentage of publications in the first quartile: Publications corresponding to journals in the first quartile of relevance in the Thomson Reuters classification by field, based on the total number of publications belonging to that field.
License revenue per 100 PhD faculty members 3: Revenue generated by use and exploitation. Number of patents per 100 faculty members with Ph.D. 3: Number of national patents awarded to each. Spanish University by the Spanish Patent and Trademark Office per 100 faculty members with a doctorate from IUNE (University OTRIs.
Triad patents per 100 faculty members with Ph.D.: The number of concurrent invention protections in different countries obtained through an international patent application per 100 faculty members with Ph.D. 3 Faculty members with doctorate degrees used to calculate indicators of innovation and technological development are those in the following categories: professor, university professor, associate professor, university associate professor and assistant professor, registered each year in centers belonging to public universities.
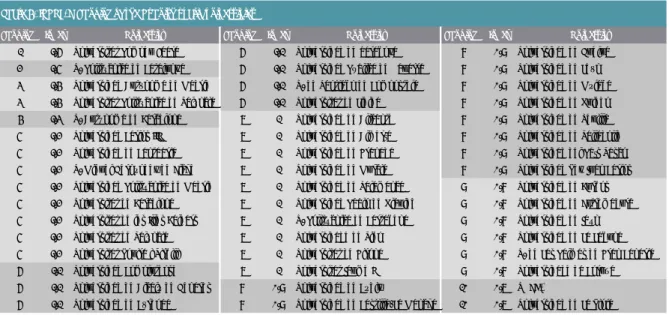
List of University Abbreviations
El efecto aglomeración de las universidades españolas en el Ranking de Shanghai (ARWU): el caso de las comunidades autónomas y los campus de excelencia. Ranking de la producción investigadora de las universidades en función del prestigio multidimensional de las áreas de impacto: las universidades españolas como estudio de caso.