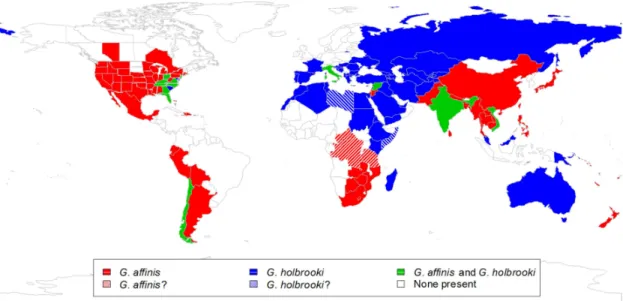
For example, non-native freshwater fishes are distributed worldwide and have invaded all continents (Fig. 2; Leprieur et al. 2008). Many human activities are associated with the introduction of non-native aquatic species to areas outside their native range (Leprieur et al. 2008; Ricciardi & MacIsaac 2011). Understanding the ecosystem impacts of non-native species at the macroecological level is useful for conservation purposes (Marr et al. 2013).
They are generally omnivorous, feeding on insects, crustaceans and many other taxa (Clem & Whitaker Jr. 1995; García-Berthou 1999; Gkenas et al. 2012). Mosquitofish is a so-called “limnophilic” species and water flow is known to influence its invasive success (Meffe 1984; Murphy et al. 2015). Measurements of metabolism and swimming ability allow us to determine the influence of physiological tolerance on the success of invasive species (Plaut 2001; Budy et al. 2013; Glazier 2014).
Ecological interactions are context dependent, where the sign or magnitude of effects is a function of the biotic or abiotic environment (Chamberlain et al. 2014).

Review of the world distribution and introduction correlates of mosquitofishes
To test for the preferred directions for each species, we used the Rayleigh test for circular uniformity (Jammalamadaka et al. 2001). To test whether the mean direction of distribution differed between the two species, we used Watson's two-sample test of homogeneity (Jammalamadaka et al. 2001). We also fitted a circular linear regression model (Jammalamadaka et al. 2001) to a circular dependent variable (i.e., distribution direction) and a linear independent variable (i.e., the year of introduction) to test whether the direction changed with year of introduction for each species.
We used the 'party' package (Hothorn et al. 2006) in R to estimate what are the main predictors mediating RECEIVER COUNTRY, ORIGIN. The absolute values of the lowest-ranking predictor were added to the plots as an indication of informative and important predictors (Strobl et al. 2009b).
Meta-analysis of the ecological impacts of mosquitofishes
Hedges' d is an estimate of the standardized mean difference that is not biased by small sample sizes (Rosenberg et al. 2000) and is a commonly used measure of effect size in ecological studies (Møller & Jennions 2002). We changed the sign of the effect sizes for those response variables in which a low value indicates the same as a high value for related variables (eg, reduced mortality equals increased survival; see Table 4 for details). Note: “–” means the sign of the effect size of the response variables has been changed; due to the opposite significance of some variables (e.g., increased mortality in the presence of mosquitofish equates to decreased survival).
We tested whether the mean effect sizes for each group were significantly different from zero and performed forest plots of the results (Jennions et al. 2013; Lajeunesse 2013). Forest plots are graphical summaries of results to illustrate individual point estimates and their CIs (Lewis & Clarke 2001). The Q and I2 statistics are commonly used to test heterogeneity between study variance (Rosenberg 2013), and the I2 statistic is a better measure of heterogeneity because it is independent of the number of studies and effect metrics, i.e.
We used mixed-effects models (i.e., meta-regression) with categorical moderator variables to test whether mean effect sizes differed between groups (eg, biota or taxonomic groups, types of variables) and with continuous predictors to test whether variances in effect sizes covary with fixed predictors (eg, water temperature, duration of experiment, density of mosquitofish and target species used; depth and volume of experimental setup). Other variables collected (i.e., salinity, dissolved oxygen, air temperatures; sex ratio, average size of mosquitoes used or target species) were not used in the analyzes due to many missing values. We considered all possible combinations of joint predictors and selected the model with the smallest value of the Akaike information criterion (corrected for small sample sizes, AICc) (Burnham et al. 2011).
We tested the model sum of squares (QM), to explain the amount of heterogeneity of the regression model, and residual sum of squares (QE), to explain the amount of heterogeneity that remains unexplained after the model is taken into account. 27 QM shows that mean effect sizes differ significantly between groups for models with only categorical variables and that at least one of the regression coefficients is different from zero for models with continuous predictors; a significant QE indicates that there is additional variance in the effect sizes to be explained (Rosenberg 2013). We also used the trim and fill method ( Duval & Tweedie 2000 ) to estimate the number of studies missing on one side of the funnel plot for the total data set.

Experiment on the swimming capacity and metabolism of eastern mosquitofish
We estimated uncertain numbers following Rosenthal (1979), to test whether the number of additional non-significant studies in the analysis would change the results of the meta-analysis from significant to non-significant. Mosquito fish were allowed to acclimate to the same environmental conditions (eg, water quality, aquatic vegetation, prey abundance) in the outdoor tank until the experiment was conducted (≈30 days). Thus, no adverse effects were caused to wildlife in the surveyed lagoon and all non-target fish were completely captured by the net.
Fatigue is defined as the point at which the fish can no longer maintain position relative to the current velocity in the respirometer (Kolok 1991; Plaut 2001). After an acclimation period (i.e., 1 h at 1.0 cm s–1 ), the oxygen consumption of individual fish swimming under each speed in the respirometer was recorded over 20 min. This time period (ie 20 min) is sufficient to detect a decrease in oxygen concentration (>5%. decrease in saturation) in the water (Plaut 2000).
Water was supplied to the respirometer from an intermediate tank while the velocity was slowly increased to increase the dissolved oxygen concentration at 100% saturation. The oxygen concentration in the respirometer during trials was always greater than 7.0 mg L–1 to avoid effects of hypoxic stress on physiological processes (Blaikie & Kerr 1996). Each mosquito was used only once per experiment, measured (TL, ±1 mm) and weighed (WW, ±0.1 mg) at the end of the experiment.
We log10-transformed all variables (TL, WW, Ucrit, MMR, RMR, FAS) to satisfy the assumptions of the parametric statistical methods (ie, normality, homoscedasticity and linearity). We first tested for interactions between the covariate and the categorical factor: if these interactions are significant, they indicate that the slopes are not homogeneous and that the parallelism assumption of standard ANCOVA is not met, but they also imply effects of the terms involved, although the factors alone are not significant (García-Berthou & Moreno-Amich 1993). Finally, the model tested differences between genders with WW as a covariate, which is equivalent to comparing intercept or mean values of the response variables adjusted for the mean weight (García-Berthou &. Moreno-Amich 1993).

World distribution and introduction correlates of mosquitofishes
AIC values and significance tests showed that the association between number of donations and date of first introduction of the two species yielded different GAM models and the moderators were clearly significant for G. Colors on the map indicate date of first introduction, except in the USA; Sites in white indicate that G. Colors on the map indicate the date of first introduction, except in the US and Mexico; The white areas indicate that G.
Variable significance plots for the predictor variables from the random forests (Fig. 18) showed that HOSTING SITE and ESTABLISHMENT of G. DATE OF ENTRY were mainly related to minimum and mean temperatures for both species, while site area was the most important predictor. for G. Both species were recently introduced to warmer temperature conditions, while G. affinis was introduced from large sites to smaller ones. 41 Figure 18: Variable significance plot for predictor variables from random forests: . probability of introduction of a) G. holbrooki and b) G. affinis; the probability of establishment of c) G. holbrooki and d) G.
AgriLand lg_GDPC Uitvoere lg_MeanTemp Bosse lg_FrostDays lg_Precip lg_Area lg_MinTemp PopDensity Latitude Longitude. Uitvoere AgriLand Breedtegraad PopDensity lg_FrostDays Bosse lg_MinTemp lg_MeanTemp lg_Precip lg_GDPC Longitude lg_Area. PopDensity Longitude AgriLand Bosse lg_MeanTemp Latitude lg_MinTemp lg_Area lg_FrostDays lg_Precip Exports lg_GDPC.
Exports AgriLand PopDensity lg_GDPC Latitude lg_Precip lg_FrostDays Longitude Forests lg_MinTemp lg_MeanTemp lg_Area. The red dashed lines are the absolute value of the lowest-ranking predictor (predictors to the right of the dashed vertical lines are significant), and higher values of the average decrease in accuracy on the x-axis indicate greater significance for the classification. The predictors are as follows: AgriLand is the percentage of agricultural land area; lg_Area is the total area of the country (km2; log10 transformed); Exports are the percentage of exports in gross domestic product; Forest is the percentage of land covered by forest; lg_Frost.Days is frost day frequency (days; log10 (x + 1)); lg_GDPC is gross domestic product per capita (US$; log10 transformed); lg_MeanTemp is the mean daily temperature (degrees C;.
Meta-analysis of the ecological impact of mosquitofishes
Mean effect sizes for agonistic behavior of native fish were positively related to depth of experimental setup (DEP) but negatively related to density of mosquitoes used (DMO), water temperature (TEM) and duration of experiment (DUR). The observed funnels were similar in pattern to a previous ecological meta-analysis by Maggi et al. 2015), indicating that there is considerable variation between studies for ecological experiments. These differences between the two species should result in different patterns of genetic structure and importance of enemy release (Wilson et al. 2009), which merit future research.
Cold conditions can delay larval development of Culicid mosquitoes (e.g., Carrington et al. 2013; Ciota et al. 2014). In contrast to other fish species, there was no significant relationship between the probability of settlement and the date of first introduction (García-Berthou et al. 2005). In other studies, land area and human development index were the most important predictors of the richness of alien invasive species at the global scale (Dalmazzone 2000; Westphal et al. 2008; McGeoch et al. 2010).
Rotifers generally increased even in the presence of mosquitoes, due to the reduction of large competitors (cladocerans, calanoid and ... 61 mosquitoes) and predators (cyclopoid mosquitoes) due to mosquito predation (Miracle et al. 2007). The meta-regression results are consistent with previous studies in which higher mosquito density or temperature produced larger effects (Taylor et al. 2001; Mills et al. 2004; Rowe et al. 2007; In contrast, in the very well-studied poeciliid, the guppy Poecilia reticulata , males preferred microhabitats with lower velocities than females, both in experimental channels (Hockley et al. 2013) and in the wild (Magellan & Magurran 2006).
Thus, native species can recover their 'stream niche' and prevent recolonization by invasive fish (Ward et al. 2003). 67 construction and water extraction can provide adaptations for new mosquito invasions (Gibson et al. 2014; Pool & Olden 2014). Distribution of the mosquitofish, Gambusia affinis (Baird & Girard), in Indiana, with comments on resource competition.
Predatory impact of mosquitofish (Gambusia holbrooki Girard) on zooplankton populations in a pond at Tenuta di Castelporziano (Rome, Central Italy). Comparative efficacy of threespine stickleback (Gasterosteus aculeatus) and mosquitofish (Gambusia affinis) for mosquito control.
