PERU 1950-1997 Hypothesizing that growth and living standards depend on a country's productive specialization, this section analyzes the evolution of living standards and the main economic activities that have characterized the last half century in Peru. Such growth levels gave these productive sectors a significantly larger share of global GDP in the first twenty years of the periods considered. The evolution in the 1980s was even more dramatic, given the greater vulnerability of the external sector.
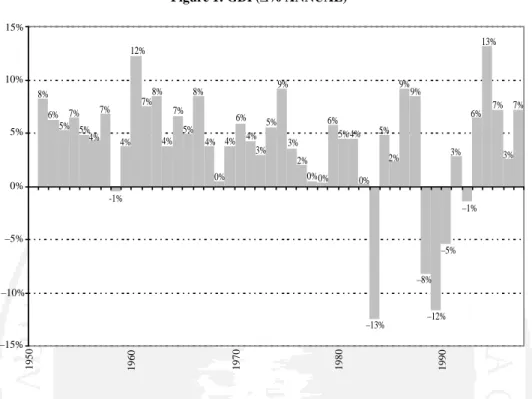
So far in the current decade, annual average growth has reached (5.7%) with construction leading growth at +12.1% per year, followed by electricity, gas and water (+6.6%) and trade and services (6.3%). In the 1980s and 1990s, manufacturing took a step back compared to the 1970s with a clear trend towards de-industrialization.
The long term factor: Specialization in sectors with diminishing returns and
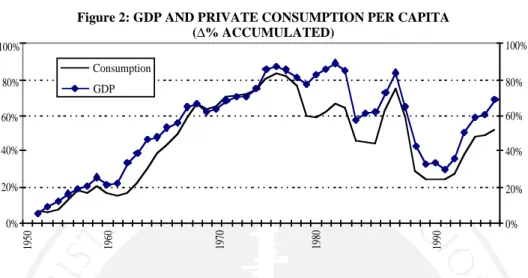
However, wages and salaries have fallen more sharply (–75% since 1973) than per capita consumption (–17% since 1975), indicating that blue-collar wages and salaries have borne the brunt of the adjustment. economic. More specifically, it determines whether higher relative development of primary goods, infrastructure, production or services is associated with higher living standards measured through wages and salaries or private consumption per capita. In other words, greater participation in primary activities leads to lower private consumption per capita, wages and salaries.
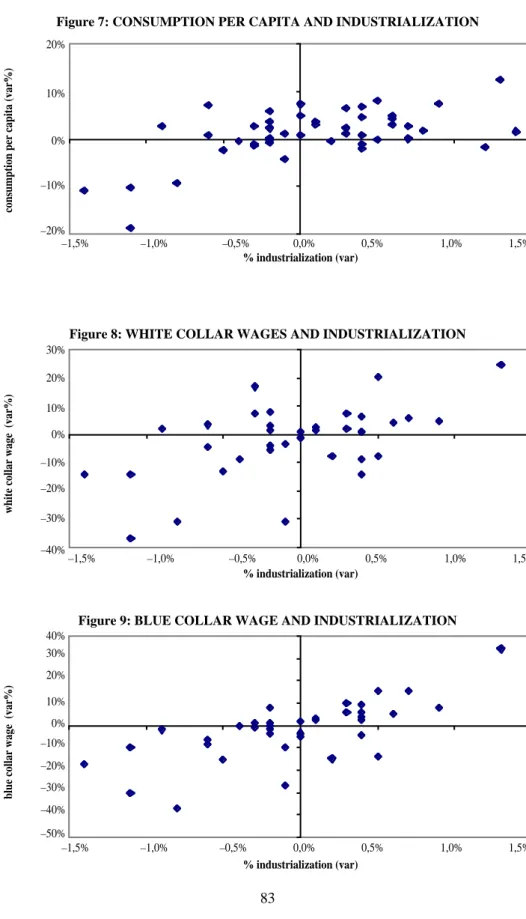
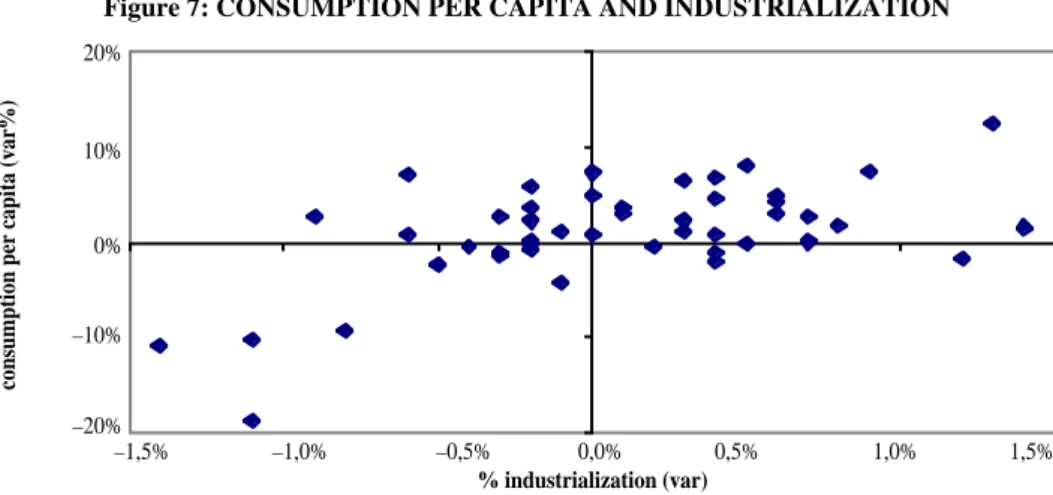
As industrialization increases, higher consumption and income per capita are observed. per capita (wages and salaries), which means that increases in the industrialization index would imply higher living standards. On the other hand, an additional percentage point in the share of manufacturing activities will increase consumption per inhabitant by 4.2%, the white-collar worker's real wage by 10.6% and the workers' real wage by 15.5%.
Short term factors
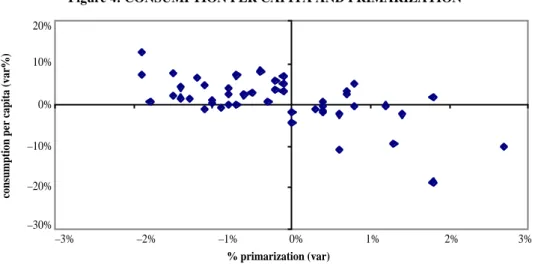
In the following three years, however, primary activity grew again to 23.7% while consumption fell by 8.7%, for a standard of living that was 7% lower than at the beginning of this stage in 1971 – despite quite similar priming levels. In the four years that followed, however, the importance of extractive activities rose again to 24.7% of total GDP while per capita consumption fell by 29.4% or below its 1985 level when the process began. Comparing the coordinates for and 1990, we see that the level of primary activities with the GDP is more or less similar.
In other words, from the point of view of living standards, the progress made in the 1980s has been completely in vain. In the current decade (see Figure 16), liberalization policies have translated into a slight decline in the level of primary activities, from 24% in 1991 to 22.5% in 1997, in parallel with an increase in per capita consumption population by 22.7%. % driven by higher incomes and expanded consumer lending. A major factor that led to a decline in the ratio of primary activities to GDP in the 1990s is the strong growth of the construction sector to reconstruct basic social infrastructure damaged by external factors such as weather and terrorism.
9 The shortage of foreign exchange reserves can be partly explained by excess domestic demand, which grew more than GDP in the pre-adjustment periods. An important factor generating this growth in demand is of course increased private consumption, which means that such fluctuations are also explained by higher living standards that create bottlenecks in the external sector. This happened even in the 1990s, despite capital inflows, which did not necessarily remove the restriction but may have temporarily lifted it, and the effect was similar to that of increased foreign flows in the 1970s.
If we determine the speed at which the economy reduces its primary activity level during the different periods in which the phenomenon actually occurred, we can find that in the recent period of economic liberalization from 1991 to 1997, primary activities fell by 0.25 percentage points per year. This means that market and liberalization policies in the 1990s led to lower primarization ratios, but at a significantly slower pace than when the process was induced or strategically guided by industrialization policies in the 1970s and 1980s. What went wrong over the past fifty years was the lack of consistency and coherence between short-term macroeconomic management and industrialization policies.
U NCOUPLING DEMAND AND SUPPLY
Major conclusions
This paper has shown that the priming of economic activities is closely related to the decline of living standards. For each additional percentage point of priming, per capita consumption fell by –2.6% while real white-collar wages fell by –5.4% and blue-collar wages by –7.4%. The impact on the manufacturing industry is in the opposite direction as for every percentage point increase in industrialization, per capita consumption increased by 4.2% and white-collar and blue-collar earnings increased by 10.6 and 15.5%.
If wages, salaries, and living standards increased with growing industrialization, why did Peru not gradually move toward the production of manufactured goods. First, Peru mistakenly participates in the world economy as an exporter of raw materials and natural resources with diminishing returns. In the second place, a faulty industrial policy favored permanent protection for all types of industries aimed at producing final goods for the domestic market with no linkage to other processes and no learning curve.
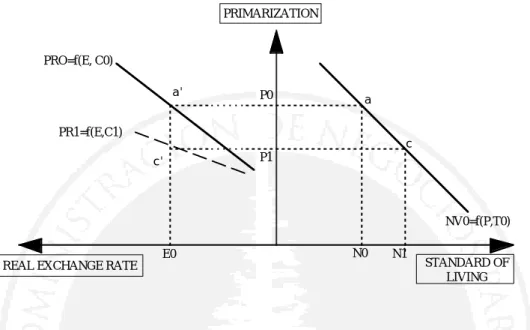
In summary, an industrial policy illustrated by the slope of the PRO curve in Figure 19. Moreover, if these changes in demand are accompanied by supply that continues to favor the production and export of primary goods, then the country will inevitably end up with a "Value or Quality Discrepancy". Therefore, the country specializes in the production and export of goods with diminishing returns, which are exchanged for products with increasing returns.
Our main conclusion is that, contrary to most neoclassical theory, we hold that growth and living standards. A country can master all the exogenous and endogenous factors responsible for economic growth, as highlighted by neoclassical theory, that is, if all these elements are however directed at producing the wrong type of products, the nation can end up working harder and live worse.
A framework to design a strategy for growth and increasing
It involves parameters related to the type of participation in the world economy and the country's industrial development policy, which depends on the varying focus on the domestic or external markets. On the contrary, if industrialization shifts to the promotion of manufacturing exports, the slope decreases (PR1 in Figure 19). A close look at these relationships reveals that living standards would increase, ceteris paribus, by developing an outward industrialization process, which would imply a change in the type of participation in the international economy.
Under these conditions, given a given real exchange rate (E0), primarization would fall from PR0 to PR1, from a' to c', and the standard of living would rise from N0 to N1, sliding along the NV0 curve, from a to c '. C. At the same level of primarization (PO), the population's standard of living would rise from N0 to N112. 12 Technological changes are likely to reverse PRO at point a, slightly increasing the impact of the real exchange rate on the degree of primarization.
In this case, moving the parameter C from CO to C2, starting from point a', an increase in the exchange rate above EO. However, the higher profitability of the primary sector will have to be offset to prevent new entrants or the expansion of incumbent operators in areas of diminishing returns. In this case, the development of a complementary productive sector, with an inward or outward orientation, depending on the size and volume of the market, is essential for any such economy to improve its living standards.
An initial proposal for Peru would see it devote itself to primary activities at low real exchange rates, preventing the country from entering areas of diminishing returns when the real exchange rate appreciates. As the real exchange rate appreciates, it should accelerate the development of a strong export-oriented manufacturing sector much like the inverted "V" curve shown in Figure 21. 14 It is also possible to develop a manufacturing sector on the basis of the internal market if this is sufficiently large to take advantage of economies of scale, as Friederich List proposed in the last century.
Free markets and strategic supply policies in a global world
VALUE AND QUALITY CREATION
Natural Resources, Industrialization and Standards of Living in Perú 1950 to 1997
The average productivity of both activities is 4 units per working day and the labor used in each activity is 200 working days. Based on these assumptions, world wheat production would be 1,600 units and 1,400 hours or a total output of 3,200 units in wheat terms, given the relative price of the two products. Since both activities show constant returns, world watch production should increase by 100 units while wheat remains stable.
The increase in world output (equivalent to the increased balance of trade between the two countries) is equally distributed, thus indicating that specialization through trade, given each nation's comparative advantages, is beneficial to both countries, to the extent that both activities show constant returns. However, if wheat has diminishing returns and sees increasing returns (case 3), international trade, based on comparative advantage, will only benefit country A, i.e. in this example, world production of wheat falls by 100 units, and that of oats increases by 150 units.
Graham's model predicts that the country specializing in the production of goods with diminishing returns will experience both a decline in GDP and a trade gap. Country A Country B World Trade in domestic products Trade in domestic products Trade Demand* balance demand* balance balance. Should wheat have diminishing returns and see constant returns (case 4), then trade specialization reduces country B's GDP, leading to a trade gap.
Namely, trade will have a negative impact on the nation with comparative advantages in the good with diminishing returns. World production would grow very little, as would commercial exchanges, and generally the gain in country A is almost equal to country B's loss. Country A Country B World Domestic Product Trade Domestic Product Trade Trade demand* balance demand* balance balance Product var.
If watch production shows increasing returns and wheat, constant returns (Case 5), the final solution would be quite similar to the previous example, since production in country B would decrease and in country A would increase. Despite this similarity, world product and commercial trade would grow more than in the previous case.