Patterns of annual/seasonal rainfall in India and globally 21. Change in regional monsoon rainfall in India 24 2.3.3. Change in other seasonal rainfall in India 26 2.3.4. Correlations of extreme monsoon rainfall in India and ENSO.
Conclusions and Future Recommendations 289
Figure 3.13 Variation of decadal (10-year) nowcasted moving average of monsoon rainfall
HadCM3LC (solid black), IPSL-CM2C (solid red), IPSL-CM4-LOOP (solid yellow), CSM-1 (solid green), MPI (solid dark blue), LLNL (solid light blue), FRCGC (solid purple ) ), UMD (black line), UVic-2.7 (red line), CLIMBER (green line) and BERN-CC (blue line); (b) atmospheric CO2 difference between coupled and uncoupled simulations (ppm), (c) differences in land carbon fluxes between coupled and uncoupled land carbon fluxes, and (d) same as (c) for ocean carbon fluxes (Friedlingstein and the second, Figure 4.16). Global Total Soil Carbon Changes (in Giga Tonnes C) for Fully Bonded Kerala 248 Figure 5.19 Project Site - Bhoj Wetland Basin, Upper and Lower Bhopal Lakes (circled in . red) in Madhya Pradesh, India 251 .
INTRODUCTION
The Problem: Climate Change & Soil Erosion
Although rainfall has increased in many areas of the globe, areas subject to drought have also increased. The off-site effects of soil erosion arise from the production of sediment which is one of the main pollutants of our environment.

Aims and Objectives
To look at the changes in monsoon rainfall extremes in India for different spatial and temporal scales for the last 135 years of rainfall data. To examine the changes in monthly, seasonal and annual extreme temperatures in different regions of India for the last 103 years of temperature data.
Structure of the Thesis
Finally, potential mitigation options for both climate change and soil erosion through land management and carbon sequestration were discussed through a qualitative assessment. This study also addresses adaptation strategies for rainfall-induced soil erosion with different land cover management options that also help control pollutant transport and soil organic matter depletion.
INDIAN CLIMATIC PATTERN
LITERATURE REVIEW
Introduction to Indian Monsoon Season
Therefore, the summer monsoon is of greater importance and the term 'monsoon', when applied to India, generally refers only to the summer monsoon (Das, 1968). Finally, in December it withdraws from the far south of the Indian peninsula and Sri Lanka.
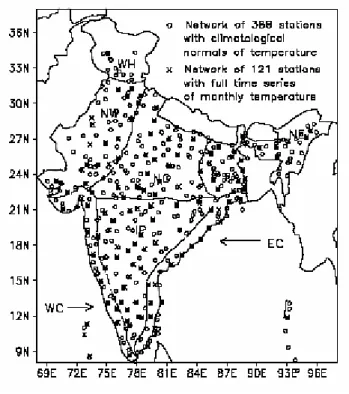
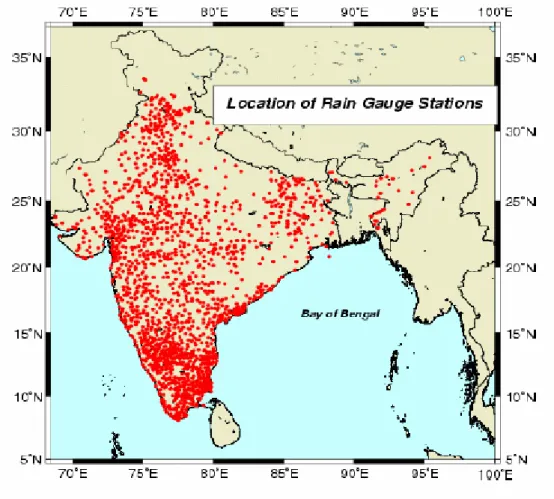
Explanation of Various Climatological Data Used in this Study
- High Resolution (1°×1° lat/long) Gridded Daily Rainfall Data
- Monthly Rainfall Data
- Monthly Maximum and Minimum Temperature Data
Although the interannual variability of summer monsoon seasonal (June–September) rainfall was found to be similar in both datasets, the global dataset underestimates the heavy rainfall along the west coast and northeast India (Rajeevan et al., 2005). On the other hand, Dash et al. 2007) analyzed all-India rainfall for the period 1871–2003 in different seasons and found a decreasing trend in summer monsoon rainfall over the Indian landmass and an increasing trend in pre-monsoon and post-monsoon months.
Patterns of Annual/Seasonal Rainfall in India and World-Wide
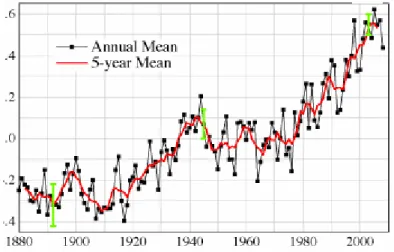
- A World-Wide Perspective
- Change in Regional Monsoon Rainfall in India
- Change in Other Seasonal Rainfalls in India
- Correlations of Extreme Monsoon Rainfall in India and ENSO (El-Niño and Southern Oscillation)
- Change in Seasonal Rainfalls in Kerala, India
2007) studied the variation of winter rainfall and its teleconnection in the same region at the end of the 20th century. The results of snow accumulation experiments show that there has been strong variability in the South Asian monsoon in the Indian subcontinent (Duan et al., 2006).
Trends and Variability of Seasonal and Annual Extreme Rainfall Events – An Indicator of
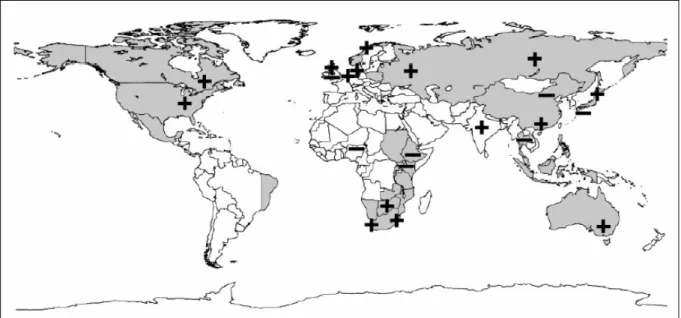
- A World-Wide Perspective
- Introduction
- Global Changes
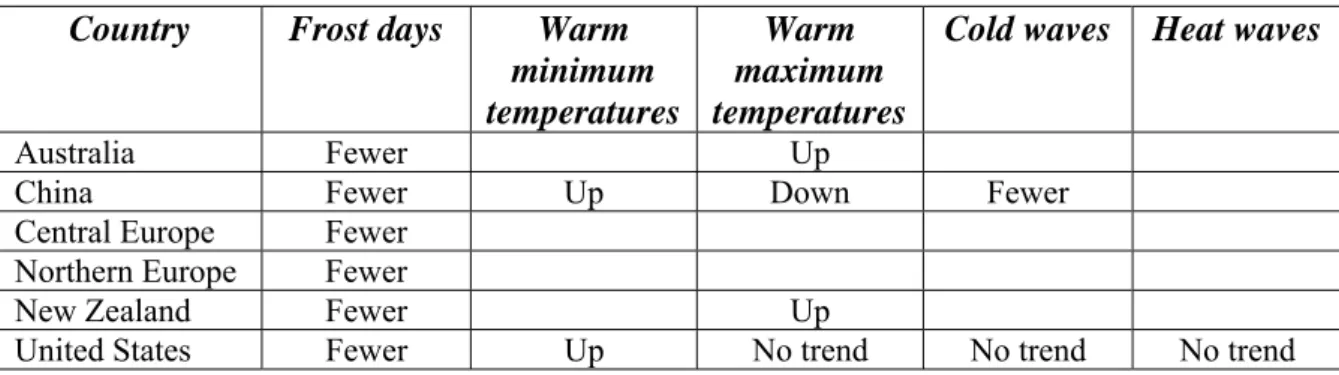
- Changes in Australia
- Changes in New Zealand
- Changes in the US
- Changes in the European Countries and Europe Overall
- Changes in African Countries
- Changes in South America
- Changes in Canada
- Changes in Asian Regions
- Summary of Changes
- Tendencies of Seasonal Rainfall Extremes in India and Particularly in Kerala
Pauling and Paeth (2007) examined the changes in extreme European winter rainfall (December–February) over the past three centuries. In the UK, Osborn et al. 2000) observed an increase in heavy winter rain events and a decrease in heavy summer events. Extreme events have also been reported to increase during the monsoon season over central India (Goswami et al., 2006).
Assessment of other seasonal extreme rainfall changes in Indian regions is scarce in the literature.
Changes/Patterns of Extreme Temperatures in India and Worldwide
Model projection results also observed similar results on a global scale (Sillmann and Roeckner, 2008; Tebaldi et al., 2006). Like France and Germany, minimum and maximum temperatures and extreme temperature events are also found to be increasing in Italy (Bartolini et al., 2008; Toreti and Desiato, 2008). Such studies are also very important for Indian agriculture and food security (Mall et al., 2006).
For example, Bhutiyani et al. 2007) investigated long-term trends in maximum, minimum and mean annual air temperatures over the northwestern Himalayas during.
Methodologies Used for Detecting Trends
- Overview
- Parametric OLS Method
- Non-Parametric Mann-Kendall Method
The non-parametric Mann-Kendall (MK) method, on the other hand, is a distribution-free method, more robust to outliers, can usually be used with gross data errors, and can deal with the missing data values, unlike the parametric method (Wilcox, 1998). However, non-parametric methods are fraught with more uncertainty in the statistical estimates than the parametric method (Alexander et al., 2006). A comparison of parametric and non-parametric methods can also be found in Moberg and Jones (2005), Cohn and Lins (2005) and Huth and Pokorna (2004), for data from Prague and Europe.
Similar methodology was also used in climatological trend estimates in India by Guhathakurta and Rajeevan (2008), Revadekar and Kulkarni, (2008), Singh et al.
RESULTS AND DISCUSSION Assessing Climatic Patterns in India
Regional Changes in Extreme Monsoon Rainfall Deficit and Excess in India
- Changes in Frequency
- Changes in Magnitude
Frequency and magnitudes of extreme monsoon rainfall deficit and surplus in India consisted of single sample values per year. The magnitudes of extreme monsoon rainfall deficit and surplus relative to the lower and upper long-term monsoon rainfall quartiles are estimated. The increased magnitude and frequency (section 3.1.1) of extreme monsoon precipitation deficits in NEIN, WCIN, and CNEIN make these regions vulnerable to water scarcity.
The magnitude of extreme monsoon rainfall excesses over the last 135 years is found to be decreasing over northern India (NEIN, NWIN, WCIN and CNEIN).

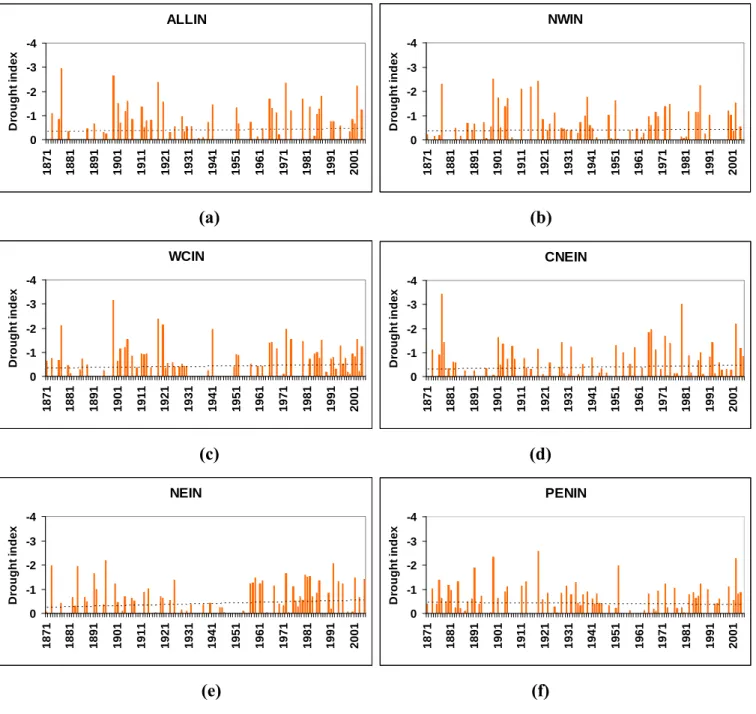
Detection of Regional Trends of the Severities of the Meteorological Droughts and Floods in India
- Methodology
- Results
Detection of regional trends in the severity of meteorological droughts and floods in India. Since Figures 3.8 and 3.9 do not show a clear picture of the trends for different types of meteorological droughts and floods, a separate trend assessment has been made for all types of meteorological droughts and floods. Percentages in parentheses refer to the probability of the drought occurring in El-Niño years.
Percentages in parentheses refer to the probability of the floods occurring in La-Niña years.
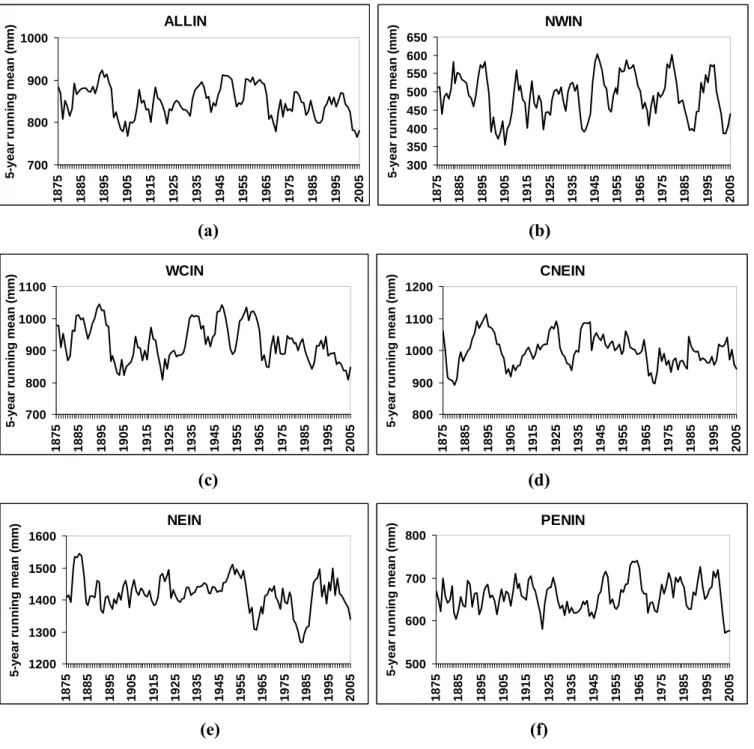
Periodical Cycle of Regional Monsoon Rainfall
- Methodology
- Results
Table 3.5 indicates that all the trends corresponding to 5- and 10-year moving averages had a high significance determining the certainty of change in monsoon rainfall. Most of the regions were found to be subject to decreasing trends in monsoon rainfall which are 95 to 99% significant as shown in Table 3.5. The most common and interesting observation for all cases in the figure is the observation of maximum variability in monsoon rainfall with a prolonged dry period.
However, the results disagree with Goswami et al. 2006) in relation to the presence of a trend of monsoon rains throughout India.
Sub-Regional Analysis of PENIN
- Methodology
- Results
El-Niño Southern Oscillation (ENSO) events and the variability of La-Niña and monsoon rainfall are also presented here. This part of the study examines the associations between El-Niño and La-Niña with monsoon rainfall below and above normal monsoon rainfall (meteorological droughts and floods) in India during the period 1876 to 2005. All strong El-Niño and La-Niña years are listed in Table 3.7; the notable drought/flood years in Tables 3.3 and 3.4 coincide with these years respectively.
However, the chance of 'moderate' meteorological droughts in El-Niño years is very small.

Changes in Seasonal Rainfall in India Using OLS and MK
- Overview
- Trends in Various Seasonal Rainfalls in Gridded Regions of Kerala
- Trends in Various Seasonal Rainfalls in the States of Peninsular India
- Trends in Various Seasonal Rainfalls in Different Climatological Regions in and All Over India
No significant long-term trend was noted, but several decades of variation were observed (thick line) in Figure 3.21(a). Since 1954, however, the changes were more pronounced, as shown in Figure 3.21(b), where a sharp decline in annual rainfall is noted in Kerala. No significant trends were noted in the period 1871-2005 in the annual rainfall, which is shown in Figure 3.22.
However, significant trends were observed for annual rainfall especially in WCIN, NEIN and PNEIN during the period as shown in Figure 3.23.

Analysing Monsoon Daily Rainfall Extremes in Kerala Using Parametric OLS
- Introduction
- Percentile-Based and Absolute Indices
- Threshold-Based Indices
- Definitions
- Extreme Rainfall Indices Based on ‘Fixed’ Thresholds and their Trends
- Extreme Rainfall Indices based on ‘Spatially Variable’
The variation of maximum one-day and five-day monsoon rainfall and their trends in the six study regions of Kerala are shown in Figures 3.30 and 3.31, respectively. The table illustrates that not all networks experienced a comparable number of precipitation events in the fifty years considered. The decrease in the 'low-moderate' precipitation frequency is highest in region 4 in the period 1979-2003.
Figures 3.42 and 3.43 show the variation of extreme rainfall percentages and their trends corresponding to both method 1 and 2 respectively; while Table 3.17 summarizes the trends in the extreme percentage calculated using the above two methods for the six study regions of Kerala.

Correlations between Total Monsoon Rainfall and Various Monsoon Extreme Indices
Analysing Other Seasonal Extremes in Kerala Using Non-Parametric MK Method
- Introduction
- Long-Term Changes of Seasonal Total Precipitation (Index PREP_ST)
- Long-Term Changes of Seasonal Total Number of Dry Days (Index TDD)
- Trends of Extreme Rainfalls
- Indices R95p and R99p
- Indices RX1day and RX5day
- Indices RXF and RXP
The figures discussed in the sections below show three-panel map of trends in various grid regions in Kerala for the three seasons analyzed. Also, the other northern region (grid 1) shows a decreasing trend in the number of dry days. Exactly opposite results were noted for the total number of wet days in the different.
Therefore, it is noted that, along with statistically significant increases in the number of dry days and decreases in extremes.

Long-Term Trends and Variability of Monthly and Seasonal Extreme Temperatures in India
- Introduction
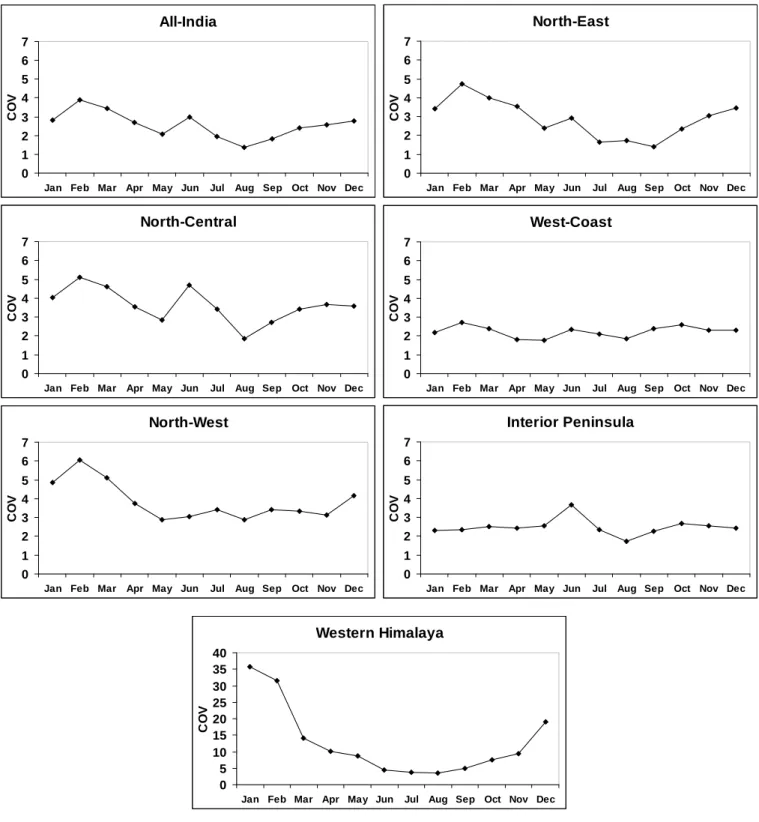
- Interannual Variabilities of ‘Monthly’ Extreme Temperatures
- Coefficient of Variation
- Trend Analysis of ‘Monthly’ Extreme Temperatures
- Interannual Variabilities of ‘Seasonal’ Extreme Temperatures
- Coefficient of Variation
- Trend Analysis of Maximum ‘Seasonal’ Temperature
- Trend Analysis of Minimum ‘Seasonal’ Temperature
Within the spring season, April had increasing trends in the maximum temperature in all regions with two regions showing insignificant trends, as shown in Figure 3.55 and Table 3.21. As illustrated in Figure 3.56 and Table 3.21, January had almost no significant trends except for a statistically significant decrease in the Northwest (NW) region. This had no effect on significant changes, but a positive trend in the monsoon season, as shown in Figure 3.62(A).
In the monsoon season, the minimum temperature trends were found to be more spatially and monthly variable, as shown in Figure 3.62 (B).
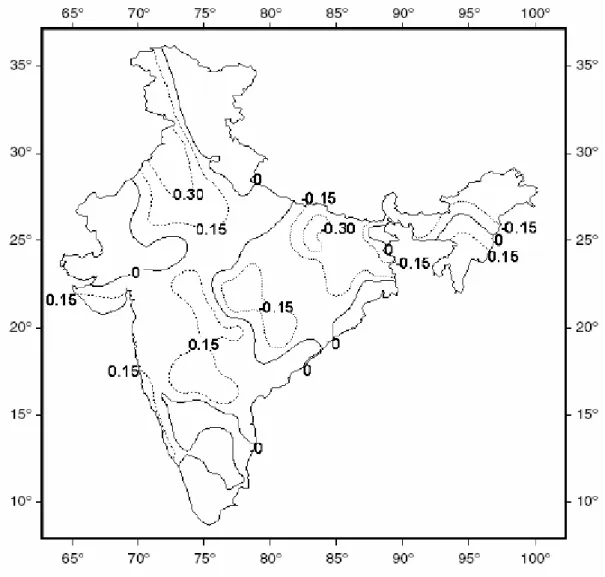
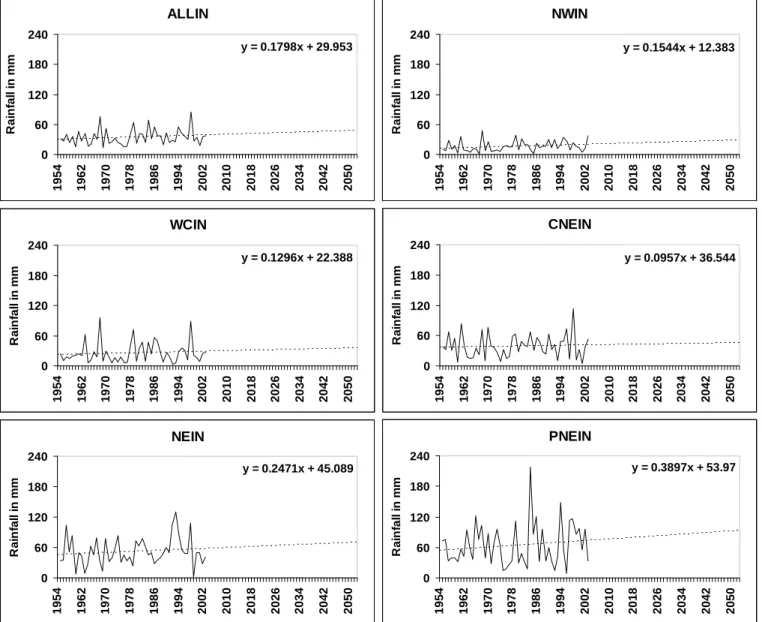
Projection of Long-Term Seasonal Rainfalls Based on 50-Year Trends for Indian Regions
Therefore, the significant decrease in annual rainfall in the West Central India region, as discussed earlier (Table 3.10), may be associated with maximum and minimum temperature changes. While an increase in average winter rainfall could be good for the desert region of the NWIN, an increase by the same amount elsewhere could lead to more off-monsoon flooding. The most interesting point to note in Table 3.24 is that a large decrease (70%) in mean autumn precipitation is expected in 2004-2053 in the NWIN, but an increase (44%) in the same is expected in the region of close neighbor of CNEIN.
The patterns of changes in mean annual precipitation are consistent with the changes in monsoon rainfall in Figure 3.65.
IMPACTS OF AND ADAPTATION STRATEGIES FOR OBSERVED
IN INDIA
Climate Change and Soil Erosion