Chatham County
2010 Health Disparities Report
Final Report
Supplement to the 2010 Community Health Assessment February 22, 2011
Prepared by
Chatham County Community Health Assessment Team
2
Table Of Contents
Executive Summary……….4
Introduction………..6
Data Limitations………...6
Health Disparities……….6
Chatham County Population Statistics………...7
Race/Ethnicity………..7
Socio-Economic Status Indicators: Income, Poverty, Wealth…………..8
A Look at Health Disparities in Chatham County………...12
Birth Rates and Infant Mortality………...12
Low Birth Weight……….13
Life Expectancy………14
Chronic Diseases………...15
Acute Illness, Injury and Morbidity………..17
Obesity………..18
Access to Physical Activity and Food and Nutrition in Chatham County.18 Root Causes of Health Outcomes……….20
Social Determinants of Health……….21
Quality of Life: Taking a Closer Look at the Social Determinants of Health….21 Social Determinants of Health Moving Toward Health Equity…………24
Understanding Health Equity………...25
Health Inequities………..25
Understanding the Causes of Health Inequities………...25
Racism……….26
Wealth, Power and Class……….27
Other Factors that Influence Health Inequities………28
Conclusion and Recommendations……….29
4
Chatham County Health Disparities Report Executive Summary
In Chatham County, people of color are sicker and die disproportionately from most of the leading causes of death. Heart disease, cerebrovascular disease, diabetes and Alzheimer’s are experienced more frequently by people of color than their white counterparts.
The majority of data presented in this report comes from the North Carolina State Center for Health Statistics. These data are often reported as minority and white. The minority population represented in these data is approximately 87% African American. Limited data are available on the Hispanic/Latin population. In some cases data may be available at the state level for these groups but is not available at the county level. “Persons of Hispanic ethnicity may be of any race, though in North Carolina most Hispanics are classified as white”, therefore the indicators for Hispanic health are limited”. 1
While the term “people of color” is preferred when describing people who are not white, data are not available using this classification. The term “people of color” is meant to be inclusive
among non-white groups, emphasizing common experiences of racism. People of color was introduced as a preferable replacement to both non-white and minority, which are also inclusive, because it frames the subject positively; non-white defines people in terms of what they are not (white), and minority frequently carries a subordinate connotation.”2 Secondary data are reported from the data source most often using the terms white and minority.
This report is the first health disparities report specifically for Chatham County. This report is a supplement to the 2010 Community Health Assessment. Data from the Community Health Assessment was used in this report. The health disparities report will examine disparities within Chatham County and compare to state and national sources as available. This report will help Chatham County Public Health Department and Board of Health address Healthy People 2020 goals including: 1) Achieve health equity, eliminate disparities, and improve the health of all groups and 2) Create social and physical environments that promote good health for all.3
The research from various public health agencies including but not limited to
Center for Disease Control and Prevention, Institute of Medicine, National Association of City and County Health Officials, World Health Organization, and public health professionals have determined that population health disparities are a result of social, economic and political forces including racism, inequitable distribution of wealth, economic insecurity, and lack of control/power not lifestyles or behaviors.4,5,6,7,8,9
The Urban Institute estimates that health disparities cost the United States $229 billion between 2003 and 2006.10 While the cost and loss of quality of life affects certain groups most, it damages all of us.
The key findings:
• While minorities in Chatham County are having fewer babies, babies born to minority women are two and half times more likely to die as compared to white women. 11
• Life expectancy for African Americans is lower than for Whites in Chatham County.12
• Minorities are dying at higher rates from heart disease, cerebrovascular disease, diabetes and Alzheimer’s than whites.13
• Minorities fair better than their white counterparts in chronic respiratory disease.14
• Minorities die at one and half time the rates of whites from unintentional injury.15
• While specific obesity rates are not available for Chatham County, in NC the incidence of obesity among African Americans is higher than whites and Hispanic/Latinos. The White rate (22.6) of obesity is slightly higher than the rate for Hispanic/Latinos (22.1). 16 A commitment to reducing these disparities in health requires the pursuit of the most effective strategies to improve health. Recommendations from the National Association of County and City Health Officials will be presented as a strategy for beginning to address health disparities and achieving health equity. These strategies include:
• Focus on root causes of health inequities.
• Inspire alternative ways of thinking more comprehensively about public health practice.
• Shift the philosophy and culture regarding how public health work is done.
• Develop strong relationships within the community.
• Broaden the focus of public health by reforming public health policy and removing constraints to allow action.
This report will be updated every four years during the community health assessment process.
6
Introduction
“Should you find yourself in a chronically leaking boat, energy devoted to changing vessels is likely to be more productive than energy devoted to patching leaks.- Warren Buffet
In a 2010 press release from the North Carolina Department of Health and Human Services State Health Director Jeff Engel said “addressing the disparities between the health status of racial and ethnic minorities and that of whites in North Carolina must continue to be a top priority.”17 Addressing health disparities with evidence based strategies is a Chatham County Public Health Department and Board of Health goal when setting public health priorities and developing policies. This report will 1) describe the population of Chatham County, 2) examine health disparities within the county, 3) analyze the causes of health disparities, 4) introduce health equity, and 5) provide recommendations for eliminating health disparities and creating healthy equity.
Data Limitations
Most of the data used in this report was collected from the State Center for Health Statistics (SCHS). The SCHS reports race and ethnicity as two separate categories. According to the SCHS, the racial categories include: white, African American, American Indian, and Asian.
Ethnicity refers to Hispanic or non-Hispanic. Persons of Hispanic ethnicity can be of any race however in North Carolina, most Hispanics are classified as white. African Americans represent 87% of minorities in North Carolina in the SCHS data. These data on the SCHS and thus in this report “minority” refers to majority African American.18 It would be more helpful if the data were more specific showing race and ethnicity.
Health Disparities
Health disparities are defined in multiple ways by various agencies and organizations. The common thread of all health disparity definitions is that there are significant differences between one population and another. Listed below are some of the different definitions of health
disparities.
The National Institute of Health defines health disparities as “differences in the incidence, prevalence, mortality and burden of diseases and other adverse health conditions that exist among specific population groups in the United States.”19
The Virginia Department of Health defines health disparities as “Differences in health status among distinct segments of the population including difference that occur by gender, race or ethnicity, education or income, disability, or living in various geographic localities.”20
7 Chatham County Population Statistics
Race and Ethnicity
The U.S. Census Bureau estimates that between April 2000 and July 2009, the population of Chatham County increased by 31.3% from 49,329 to 64,772 residents. The 2006-2008 U.S.
Census Bureau American Community Survey indicates that a majority (75.6%) of the population is white. Blacks make up 14.2%. Other races make up 7.0% of the total Chatham County
population and people of two or more races account for approximately 1.3% of residents.
Chatham County has a larger White population than the state (70.3%) but a smaller Black or African American population by 7%.
The Hispanic population consists of 12.4% of all Chatham County residents. Race and Hispanic ethnicity are separate, although Hispanic origin is often reported as race. One can be Hispanic and also of another race. The U.S. Census Bureau states that,
“The federal government considers race and Hispanic origin to be two separate and distinct concepts. For Census 2000, the questions on race and Hispanic origin were asked of every individual living in the United States. The question on Hispanic origin asked respondents if they were Spanish, Hispanic, or Latino. The question on race asked respondents to report the race or races they considered themselves to be.”21
Between 1990 and 2000, the Pew Hispanic Center reported a 741% increase in the Chatham County Hispanic/Latino population. This population continues to grow, but at a slower rate. For the 2000-2008 time period, the Pew Hispanic Center estimates that the Chatham County
Hispanic/Latino population grew by 66%. 22
It is widely believed that the Hispanic population is severely underreported because of immigration status and is actually much higher. One Siler City resident interviewed believed that, “There’s been a huge influx of Latino population in the last few years…Definitely the Latino population has more than quadrupled in the past few years.”
Chatham County Population by Race, 2006-2008
(Source: 2006-2008 U.S. Census Bureau American Community Survey)
14.2%
1.8%
0.1%
7.0% 1.3%
White Black
American Indian Asian
Other Race
Two or More Races
8
$0
$10,000
$20,000
$30,000
$40,000
$50,000
$60,000
2006‐2008 Median Household
Income
1999 Median Household
Income
Chatham North Carolina
The make-up of Chatham County has changed since the 2000 census. In 2000, 17.5% of Chatham County residents were Blacks or African Americans. That number has decreased throughout the decade due to the rise in the Hispanic/Latino population. Chatham’s current Hispanic/Latino population (12.4%) continues to be higher than North Carolina’s overall (7.0%).
Socio-Economic Status Indicators: Income, Poverty, Wealth
Chatham County
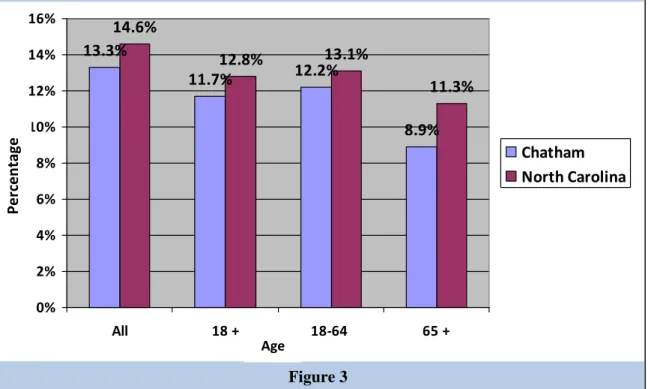
The estimated median household income for Chatham County in 2008 was $54,874. Per capita income for 2008 was $43,894, which ranks third out of the 100 counties. The percentage of Chatham residents living in poverty in 2008 was estimated at 13.3%, lower than the state average of 14.6%, but still significant. A Chatham County community member states, “They’re {residents in Chatham County} losing a lot of jobs so there’s a lot of economic disparity.”
Chatham County and North Carolina Median Household Income in 2000 and 2006- 2008
(Source: 2000 Census & 2006-2008 American Community Survey)
Year
Figure 2
Dollar Amount
North Carolina
In North Carolina in 2008, overall poverty rate was 14.6% as compared to 13.2% nationally.
That year in North Carolina, 34.4% of blacks and 38.5% of Latinos lived in the poverty as compared to 12.1% of whites (see Figure 4). 23 Research from the National Poverty Center found that “racial disparities in poverty result from cumulative disadvantage over the life course, as the effects of hardship in one domain spill over into other domains.” 24
Figure 3 Age
Percentage of People in North Carolina and Chatham County Living Below the Poverty Level 2006-2008 by Age (Source: 2006-2008 U.S. Census Bureau)
13.3%
11.7% 12.2%
8.9%
14.6%
12.8% 13.1%
11.3%
0%
2%
4%
6%
8%
10%
12%
14%
16%
All 18 + 18‐64 65 +
Chatham North Carolina
Percentage
10
United States
A new report from the US Census Bureau reveals that the number of blacks in poverty increased from 24.7% to 25.8% in 2009; and the number of Latinos in poverty increased from 23.2% to 25.3% as compared to 9.4% of non-Latino whites in poverty and 12.5% of Asians in poverty (see Figure 5). Generally, blacks and Latinos were more than three times as likely as whites to live in poverty.25
12.5%
9.4%
25.3%
25.8%
12.1%
Percentage of People Living in Poverty in 2008 by Race and Ethnicity
(Source: The Henry J. Kaiser Family Foundation, State Facts, 2009)
Race and Ethnicity
Percentage
34.4%
38.5 %
0 5 10 15 20 25 30 35 40 45
White Black Latino
North Carolina
North Carolina
Figure 4 12.1%
34.4%
38.5%
Percentage
Figure 5
0 5 10 15 20 25 30
White Black Latino Asian
United States
United States
Race and Ethnicity
Percentage
Percentage of People Living in Poverty in 2008 by Race and Ethnicity
(Source: US Census Bureau 2009)
Property net worth is an indicator of wealth. In figure 3, average residential property value is reported by census block. The property values range from $63,733.16 to $458,329.39. This is an indicator of the wide gap in wealth in Chatham County. The Northeast section of the county with the higher property values is home to Fearrington Village and Galloway Ridge, upscale retirement communities. Many of the retirees in this part of the county are college educated and have moved from other cities from across the country. There are also several high end
developments such as Hills of Rosemont, Governor’s Club, and the Preserve at Jordan Lake with homes starting in the mid-$300,000 range. The western and southern portions of the county, with the lower property values, are further away from the triangle area counties including Wake, Durham, and Orange. These areas of the county are rural and agriculturally based with the exception of Siler City. Siler City is home to a diverse population including long term residents and a large Latino population.
Source: 2010 Chatham County Tax Office
Figure 3
12
A Look at Health Disparities in Chatham County Birth Rates and Infant Mortality
One of the basic indicators of quality of health is the infant mortality rate. The infant mortality rate is used across counties, states, and countries to compare health and well-being of
populations. The rate is strongly correlated and a best indicator of failed state, which means that the government is failing to meet basic conditions for its people. 26 The United States has one of the worst infant survival rates in the industrialized world—ranked 28th. Babies born in Slovenia, Cyprus, Malta and Croatia stand a better chance of living to the age of one than a baby born in the United States. This ranking is in large part due to the racial disparities that exist in the United States. 27 In the following graphs, statistics on birth rates and infant mortality rates show an alarming disparity. In Chatham County, minorities are having fewer births than white women but their babies are dying almost two and half more times than babies born to white women.
12.8 14.2
13.5 13.8
9.5 15.6
0 2 4 6 8 10 12 14 16
Total Whites Minorities
Chatham
North Carolina
2004-2008 Birth Rates Per 1,000 Live Births in Chatham County and North Carolina for Racial Groups (Source: North Carolina Center for Health Statistics, November 2009)
Birth Rates
Race
Figure 4
Low Birth Weight
Low birth weight is considered to be less than five pounds, eight ounces. Low birth weight babies are at an increased risk for health problems throughout life. Health problems for
newborns include respiratory distress syndrome, bleeding of the brain, patent ductus arteriosus as well as others. As adults there is an increased risk for chronic conditions including high blood pressure, type 2 diabetes, and heart disease.28 Johnson and Schoeni found that low birth weight babies as adults are more likely to drop out of high school, lowers labor force participation, and decreases market earnings. The study also found that racial differences in adult health can be explained by a few early life factors: birth weight, parental income, and parental health insurance coverage. 29 In Chatham County, babies born to minority women are also almost two and half times more likely to have lower birth weight than babies born to white women (Figure 6).
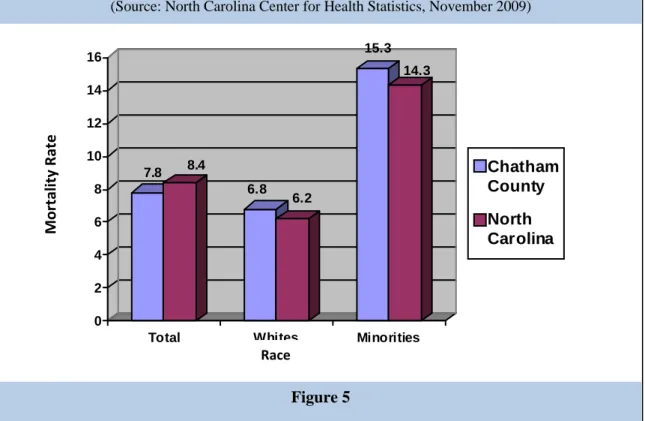
2004-2008 Infant Mortality Rate Per 1,000 Live Births in Chatham County and North Carolina for Racial Groups (Source: North Carolina Center for Health Statistics, November 2009)
7.8 8.4
6.8 6.2
15.3 14.3
0 2 4 6 8 10 12 14 16
Total Whites Minorities
Chatham County North Carolina
Mortality Rate
Figure 5 Race
14
8.6 9.1
7.4 7.4
16.8 13.6
0 2 4 6 8 10 12 14 16
Total Whites Minorities
Chatham County North Carolina
Life Expectancy
Life expectancy is the number of years any given population is expected to live at a particular age. Life expectancy is often used as an indicator of overall health. The United States is ranked 38th in the world in life expectancy.30 Life expectancy can fall due to problems like famine, war, disease and poor health. Improvements in health, economics, and social environment can
increase life expectancy. Higher life expectancy is an indicator that the country is in better shape.
Table 1 shows the Life Expectancy of residents of Chatham. Looking specifically at birth, < 1 age group females in Chatham County are living six years longer than men. The white
population in Chatham County is living five years longer than African Americans in Chatham County.
2004-2008 Percentage of Low Birthweight Births in Chatham County and North Carolina for Racial Groups (Source: North Carolina Center for Health Statistics, November 2009)
Percentage
Figure 6 Race
Sex Race
Age Group Total Male Female White
African American
<1 78.5 75.2 81.8 79.1 74.3
1‐4 77.9 74.7 81.2 78.5 74.2
5‐9 74.0 70.9 77.2 74.6 70.2
10‐14 69.1 66.0 72.2 69.7 65.6
15‐19 64.2 61.1 67.2 64.7 60.8
20‐24 59.7 56.8 62.5 60.1 56.4
25‐29 55.0 52.2 57.7 55.5 51.8
30‐34 50.2 47.5 52.9 50.7 47.1
35‐39 45.5 42.8 48.2 45.9 42.7
40‐44 40.8 38.1 43.4 41.2 38.2
45‐49 36.2 33.7 38.5 36.6 33.6
50‐54 31.7 29.4 33.9 32.1 29.4
55‐59 27.3 25.1 29.3 27.6 25.4
60‐64 23.2 21.2 25.0 23.4 21.8
65‐69 19.5 18.0 20.8 19.7 18.3
70‐74 16.1 14.9 17.1 16.2 15.4
75‐79 12.5 11.5 13.1 12.6 11.6
80‐84 9.5 8.7 10.0 9.6 8.7
85+ 7.3 6.5 7.8 7.4 6.5
Life expectancy is the average number of additional years that someone at a given age would be expected to live if current mortality conditions remained constant throughout their lifetime
N/A means that the live expectancy estimate is suppressed due to (1) a total population (over all age intervals) of less than 1,000 or (2) any age interval population estimate less than 10.
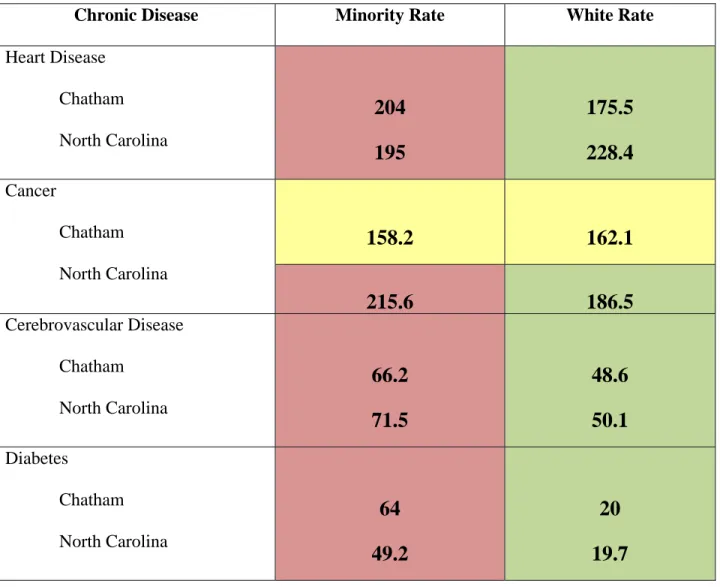
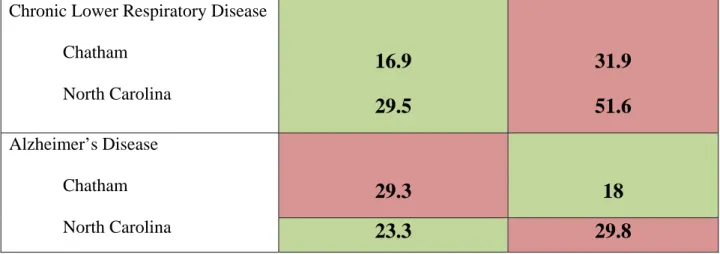
Chronic Diseases
Minorities disproportionately bear the burden of chronic disease in Chatham County. Out of six chronic diseases, minorities are more poorly in four. The four diseases that minorities are doing worse in are heart disease, cerebrovascular disease, diabetes, and Alzheimer’s disease. Of these four diseases, the biggest difference is in diabetes. Minorities are three times more likely to die from diabetes than whites. Following diabetes, cerebrovascular diseases and Alzheimer’s disease are almost two times higher in the minority population as compared to whites. In
Chatham County and in North Carolina, minorities are doing almost two times better than whites in death rates of chronic lower respiratory disease. Chatham County minorities have lower death rates of cancer than people of color across North Carolina. However, across North Carolina,
Figure 7
2006-2008 Life Expectancies by Age, Race, and Sex in Chatham County (Source: North Carolina Center for Health Statistics, April 2010)
16
people of color have higher death rates of cancer than whites. Overall in Chatham County and in North Carolina, minorities are impacted greatest by health problems.
Legend for Tables 1-3
Better: Population doing “better” meaning fewer deaths
Same: No difference between groups ( 0-4 points positively or negatively) Worse: Population doing “worse” meaning more deaths
Table 1: 2004-2008 Death Rates Per 100,000 Population in Chatham and North Carolina for Specific Race Groups
(Source: North Carolina Center for State Statistics, November 2009)
Chronic Disease Minority Rate White Rate
Heart Disease Chatham North Carolina
204 195
175.5 228.4 Cancer
Chatham North Carolina
158.2 162.1
215.6 186.5
Cerebrovascular Disease Chatham
North Carolina
66.2 71.5
48.6 50.1 Diabetes
Chatham North Carolina
64 49.2
20 19.7
Chronic Lower Respiratory Disease Chatham
North Carolina
16.9 29.5
31.9 51.6 Alzheimer’s Disease
Chatham North Carolina
29.3 18
23.3 29.8
Acute Illness, Injury and Morbidity
Minorities in Chatham County and North Carolina have similar rates with whites in pneumonia and influenza and unintentional motor vehicle injury. Interestingly, Chatham County residents are one and half times more likely than their respective group across the state to die from unintentional motor vehicle injury. In Chatham County, unintentional injury is one and half more likely to occur to minorities.
Table 2: 2004-2008 Death Rates Per 100,000 Population in Chatham and North Carolina for Specific Race Groups
(Source: North Carolina Center for State Statistics, November 2009).
Acute Illness or Injury Minority Rate White Rate Pneumonia and Influenza
Chatham North Carolina
17.6 13.2
18.5 20.6
Unintentional Injury Chatham North Carolina
35.2 22.7
21.3 30.5
Unintentional Motor Vehicle Injury
Chatham North Carolina
30.5 27.9
18.1 18.7
18
Obesity
Obesity is a growing epidemic nationally, across the state, and in Chatham County. In 2007, 64.6 percent of North Carolina adults were overweight or obese.31 In Chatham County obesity is a top community priority with 49.6 percent of residents stating it as “a big problem” ranking it #2 behind jobs. Obesity was tied for 3rd on the community opinion survey when residents were selecting their top three priorities. Obesity is associated with several chronic diseases including heart disease, cerebrovascular disease, diabetes, and several forms of cancer. In the table below, North Carolina data show that African Americans are over one and half times more likely to be obese than whites or Latino/Hispanics. Latinos are two times more likely than whites to have no leisure time for physical activity and African Americans are almost one and half times more likely to have no leisure time physical activity than whites.
Table 3: North Carolina Risk Factor Percentages by Race/Ethnicity; Behavioral Risk Factors 2003-2005
(Source: NC Behavioral Risk Factor Surveillance System, State Center for Health Statistics)
% White % African
American
% Latino/Hispanic
Adults who are obese 22.6 36.7 22.1
Adults with no leisure
time for physical activity 21.7 31.4 44.3
Access to Physical Activity and Food and Nutrition in Chatham County
According to the Leadership For Healthy Communities “Action Strategies Toolkit: A Guide for Local and State Leaders Working to Create Healthy Communities and Prevent Childhood Obesity,” racial and ethnic minorities and lower income families are at greatest risk for obesity.
A major factor is that low income, minority, and rural communities lack adequate opportunities for safe physical activity and access to nutritious foods.32 In figure 8, the map shows physical activity access. Areas within a 0.75 mile radius of a physical activity feature are shaded in green, and areas within a 5 mile radius are shaded in pink. Residents in the northeast portion of the county generally have greater access to physical activity resources. Even though Pittsboro has a population of less than half of that of Siler City, it has more than double the number of physical activity facilities. In addition, facilities are more loosely clustered than in the Siler City area, allowing greater access to people over a wider geographic area. Though Chatham County has opened two public parks and a 4.5 mile section of the American Tobacco Trail in the past year, there are still underserved areas. These include central, northwest, and southeast Chatham County.33
Figure 9 shows access to healthy food retailers. The healthy food retailers are mostly concentrated in the population centers of Pittsboro and Siler city, with a few retailers being located in outlying areas. Areas within a 0.75 mile radius (reasonable walking distance) of a food retailer are shaded in orange. Areas within a 5 mile radius (reasonable driving distance) are
Figure 9 shows access to healthy food retailers. The healthy food retailers are mostly concentrated in the population centers of Pittsboro and Siler city, with a few retailers being located in outlying areas. Areas within a 0.75 mile radius (reasonable walking distance) of a food retailer are shaded in orange. Areas within a 5 mile radius (reasonable driving distance) are shaded in green. Some areas must drive up to 45 minutes to reach a nutritious food retailer.
Even though agriculture is one of Chatham County’s largest industries, there is still a significant portion of the population that must drive great distances to access healthy food.34
Figure 8
20
Root Causes of Health Outcomes
Minorities in Chatham County are disproportionately doing worse in health outcomes than their white counterpart. Death rates are higher in four out of six chronic diseases, and in unintentional injuries. This is similar to the health outcomes across North Carolina. North Carolina data show that African Americans are more likely to be obese and lack time for physical activity in
comparison to whites. The Latino/Hispanic population is similar to whites in obesity, however, lack time for physical activity. There is a distinct pattern that shows health outcomes for
minorities are worse than whites.
Understanding this pattern requires addressing the root causes of the problem. According to the Centers for Disease Control and Prevention, figure 10 shows that the largest impact in addressing factors that affect health is socioeconomic factors including poverty, education, and inequality.
And, in fact, health care plays a minimal role in the health status of an individual.35 Research shows that social and economic factors such as income, education, racism, housing, employment, transportation, food accessibility, and the built environment are the key components in
determining an individual’s health status.36 Therefore, it is necessary to address these underlying Figure 9
social determinants of health in order to improve the health status of individuals and eliminate health disparities.
Social Determinants of Health
According to the World Health Organization the social determinants of health are the conditions in which people are born, grow, live, work and age. These circumstances are shaped by the distribution of money, power and resources, which are themselves influenced by policy choices.37
“Social determinants of health are life-enhancing resources, such as food supply, housing, economic and social relationships, transportation, education, and health care, whose distribution across populations effectively determines length and quality of life.” 38 Quality of Life: Taking a Closer Look at the Social Determinants of Health
Social determinants of health are the life enhancing resources that promote and protect the quality of life across populations. People in groups who are marginalized by their race/ethnicity, socioeconomic status or some combination of these not only experience worse health outcomes but also tend to have less access to the social determinants that promote and protect health. (See Social Determinants of Health Figure 11). Social determinants of health can affect individual and community health directly or indirectly through influencing health promoting behaviors.
Figure 10
22
Development of initiatives and policies that address the equitable distribution of social determinants contribute to eliminating health disparities.
Figure 11: Social Determinants of Health (Excerpted from Chatham County Human Relations Department Report “Issues
Impacting People of Color in Chatham County”39) Social Determinant of
Health
Disparities
Poverty • In North Carolina in 2008, the 2008 overall poverty rate was 14.6% as compared to 13.2% nationally. That year in North Carolina, 34.4% of blacks and 38.5% of Latinos lived below the poverty line as compared to 12.1% of whites.
Hunger • Nationally, in 2008 25.7% of black families and 26.9% of Hispanic families were more likely to experience food insecurity as opposed to 10.7% of white families.
Income • Nationally, the real median income for families in 2009 was
$49,777: $65,469 for Asians, $54,461 for whites – non-Latino,
$32, 584 for blacks (a statistically significant decrease from
$34,218), and $38,039 for Latinos – any race.
Unemployment • In July of 2010, the overall unemployment rate in Chatham County was 6.5%. In North Carolina, it was 9.8% overall. The 2010 North Carolina unemployment rate for whites overall has been 8.56%. For blacks overall, it has been 15.02%. For Latinos overall, it has been 9.04%.
• The 2010 unemployment rate for white males age 20+ has been 9.49%. The unemployment rate for black males age 20+
in North Carolina has been 20.35%. For Latinos (males) age 20+, it has been 9.18%. For white women, it has been 7.42%.
For black women, it has been 10.61%. For Latinas at 20+, it has been 9.56%.
• Loosely extrapolated and based on these state averages, it appears that when a baseline is established to unemployment rates for whites, the rate for blacks is roughly twice as much – especially males. That would suggest that if the unemployment rate in Chatham County is 6.5% overall, the unemployment rate for blacks is probably around 12 or 13%.
• To make matters worse, a recent national report by the Kirwan
Institute for the Study of Race and Ethnicity said that African- American and Latino workers are overrepresented among the unemployed and long-term unemployed. Further, the same two groups are 25% less likely than unemployed whites to receive unemployment benefits, due in large part to their
disproportionate representation among low-wage, part-time, and seasonal workers, who are ineligible for or poorly covered by unemployment benefits.
Employment Discrimination
• During FY 2009, workplace discrimination nationally reached the second highest level ever, and monetary relief obtained for victims totaled over $376 million.
• Nationally, the FY 2009 data show that private sector job bias charges alleging discrimination based on disability, religion, and/or national origin hit record highs. Continuing a decade- long trend, the most frequently filed charges with the EEOC were charges alleging discrimination based on race (36%), retaliation (36%), and sex-based discrimination (30%).
• Latinos are affected more profoundly by labor law violations and gaps in legal protections.
Fair Housing • For 2010, the National Urban League reports that less than half of black and Latino families own a home – 47.4% and 49.1%
respectively – compared to 75% of white families.
Hate Bias and Hate Crimes
• This past March, the Southern Poverty Law Center (SPLC) reported that the number of extremist groups in the United States exploded in 2009. They documented a 244% increase in the number of active hate groups.
• In Chatham County a bridge was vandalized with racial symbols, slurs, and statements including the letters “KKK”, Nazi swastikas, Ku Klux Klan hoods, the phrase, “World Wide White Power”, and a drawing of a man hanging from a noose.
• A teacher reported to the Chatham County Human Relations Office that a Confederate flag and the word, “Hi,” were drawn on the window of her classroom. The teacher’s students were all minorities.
Education • Achievement Gap: The newest 2009-10 data show that in 3rd through 8th grades in Chatham County, we have a 31
percentage points reading performance gap between white students and black students. There is also a 35.7 percentage
24
points gap between white students and Latino students.
• In math in 3rd through 8th grades, there is a 26.8 percentage points gap between white students and black students. There is also a 18.2 percentage points gap between white students and Latino students.
Justice System • Whites and blacks engage in drug offenses – possession and sales – at roughly comparable rates. While African Americans comprise 13% of the US population and 14% of monthly drug users, they are 37% of the people arrested for drug offenses.
• Blacks are arrested for drug offenses at rates 2 to 11 times higher than the rate for whites.
• Even when released from prison, race continues to dominate.
Seventeen percent of white job applicants with criminal
records receive call-backs from potential employers while only 5% of black job applicants with criminal records receive call- backs. Race is so prominent that whites with criminal records actually receive better treatment than blacks without criminal records.
• The current juvenile justice system across the country treats youth of color more severely than their white counterparts. One expert who testified before Congress said, “We have two justice systems, one for whites and one for kids of color. The one for kids of color is more intrusive, harsher, and longer.”
• Latino youth are overrepresented in the US justice system and receive harsher treatment than white youth.
The full report can be viewed at http://www.chathamnc.org/Index.aspx?page=902
Social Determinants of Health Moving Toward Health Equity
African Americans and Latinos have less access to the social determinants that promote and protect health leading to inequities in each of these categories. There is a lack of the promoting and protecting social determinants for this population resulting in health inequities. The
wealth/social class divide is similar in that those people on top with more wealth and higher social class are able to access more of the social determinants of health that protect and promote health. To eliminate the disparities, addressing the root causes of the problem and focusing initiatives and policies on health equity is critical.
Understanding Health Equity
Health equity occurs when every person has the opportunity to attain their full health capability and no one is disadvantaged from achieving this capability because of their social position or other socially determined circumstance.40
Health Inequities
Health inequities are disparities in health that are systemic, avoidable, and unnecessary and, therefore, considered unfair or unjust. 41
The National Association of County and City Health Officials (NACCHO) continue that “Health inequities affect life chances and are not inevitable or caused by behavior or genes; they are the result of deep social divisions associated with racism, class structure, and sexism. A causal relationship exists between systematic social and economic inequality and health inequity.”42 Understanding the Causes of Health Inequities
The causes of health inequities are complex, intricate, interconnected and deeply rooted in our United States history and society. Racism and the unequal distribution of wealth and power are the root causes of health inequities. These large underlying social conditions lead to the
environmental, cultural, community level issues, such as unsafe neighborhoods, or lack of access, which then cause individual level health issues and thus inequities. Societal level
inequities (racism, classism) create inequities in the social determinants of health (life enhancing resources) which then cause health problems in individuals and ultimately health inequities in populations. In figure 12, the “upstream” portion shows that the big issues are racism and the unequal distribution of power and wealth. It is these larger underlying social conditions which lead to the environmental, cultural, community level issues (those in the light green) such as unsafe neighborhoods, or lack of access, which then cause individual level health issues and thus inequities.43
26
Figure 12: The Stream44
Racism
According to the Institute of Medicine, “even after considering: age, gender, socioeconomic position--education, income, occupation, etc., access to healthcare, insurance coverage, rural versus urban, other types of demographic variables racial and ethnic disparities still remain.
Racial and ethnic healthcare disparities occur in the context of broader historical and contemporary inequalities, and racial and ethnic discrimination”.45 The most significant problem facing people of color is institutional and cultural racism. The term “people of color” is meant to be inclusive among non-white groups, emphasizing common experiences of racism.
People of color was introduced as a preferable replacement to both non-white and minority, which are also inclusive, because it frames the subject positively; non-white defines people in terms of what they are not (white), and minority frequently carries a subordinate connotation.46 Persistent stress of racism creates negative outcomes for people of color. When looking
specifically at health, the persistent chronic stress and the activation of that response create wear and tear on the body’s organs and systems which leads to health problems. 47 Racism produces advantage for one group over another and creates discrimination in access to services, goods and opportunities. Institutional racism does not have to result from human intention. It is embedded in the policies and structures of institutions designed to benefit one group while oppressing others. Thus, racial discrimination can occur in institutions even when the institution does not intend to make distinctions on the basis of race. One community member stated, “Racial relations here have never been as strong as I think it need be sometimes. There’s barriers that’s kind of set up that’s in place that keep people kind of divided and separated.”
The first critical component to understanding racism is to learn about race. There is no such thing as race from a scientific or biological point of view.48 Race is a social and political construct. It is a powerful social, political, and economic force. The realities of race are real.
The “white” race was created to unite European groups living in the United States and
marginalize African slaves and Native Americans.49 In 1690, the first definition of “white” was created in Virginia.50
Every institution was used to prove that race exists and to provide advantages to the white race that was on top. This process continues today.51 For example, audited studies of mortgage lending, housing, and employment practices show persistent discrimination against African Americans and Latin Americans. These studies illustrate that much of American social and economic life remains ordered by race and ethnicity with people of color being disadvantaged relative to whites.52
Racism is social and institutional power plus race prejudice. It is a system of advantage based on race. Racism is a system of oppression based on race. It involves one group having the power to carry out systematic discrimination through the major institutions of society. In our society, white people have the advantage and people of color have the disadvantage.53
Wealth, Power, and Class
Wealth, Income, Power, Class and Health
Groups and individuals who are at the top of the wealth and class continuum have the most access to power, resources and opportunity – and thus the best health. Groups and individuals who are on the bottom of the wealth and class continuum have the least access to power, resources, and opportunity. Those at the bottom have more stressors including multiple jobs, less time with children, unsafe living conditions with the limited resources to cope with the stressors. This difference is not only between the very top and the very bottom, it can be seen as a gradient between all wealth/class levels.54
In the United States, the wealth health gradient looks like this: Over 70% of affluent Americans report very good to excellent health – almost twice as many as poor Americans. In the middle levels, good health decreases significantly. This translates into a reverse slope for chronic disease. Diabetes: Low income Americans have twice the rate of disease as the affluent. And for those in the middle, it’s still almost twice the rate. A similar pattern holds for stroke, heart disease, eventually contributing to excess death, especially for middle and low income Americans.55
Examples
• Unemployment and underemployment have been associated with serious health risks including suicide, depression, violence, and alcohol consumption56.
28
• The less control employees have over their work conditions the worse health outcomes they have and the greater opportunity for injuries and illness.57
• Poor communities suffer the burden of structural inequalities such as layoffs and location of toxic waste.58
Wealth and the Distribution of Wealth in the United States
In the United States, wealth is highly concentrated in relatively few hands. As of 2007, the top 1% of households (the upper class) owned 34.6% of all privately held wealth, and the next 19%
(the managerial, professional, and small business stratum) had 50.5%, which means that just 20% of the people owned a remarkable 85%, leaving only 15% of the wealth for the bottom 80%
(wage and salary workers). In terms of financial wealth (total net worth minus the value of one's home), the top 1% of households had an even greater share: 42.7%59.
Income
Income is what people earn from work, but also from dividends, interest, and any rents that are paid to them on properties they own. Those who own a great deal of wealth may or may not have high incomes, depending on the returns they receive from their wealth, but in reality those at the very top of the wealth distribution usually have the most income. 60
Power
Power is about being able to realize wishes, to produce the effects that you want to produce. It is the ability to influence the events that impinge on your life, even if it means not doing anything, but one way or the other, managing those pressures.61
Wealth and income are visible signs that an individual, group, or class has power. Although wealth and power are different, the two are interconnected.
Social Class
Class is the ongoing, historical social divisions over production and distribution and the organization of society. Classes represent the organized collective power of a well-resourced group to shape the social process, institutions, economic development and built environment, direct society’s investments, manipulate policy, and governing rules of the society.62
Other Factors that Influence Health Inequities
Other factors that influence health inequities include diversity of the health workforce, effectiveness of care, language accessibility and cultural competency of health providers and appropriateness of health promotion information.
According to the Office of Minority Health, cultural competency is one component in closing the disparities gap. Health care services that are respectful of and responsive to the health beliefs,
practices, and cultural and linguistic needs of diverse patients can bring about positive outcomes.63
Conclusion and Recommendations
Two of the overarching goals for Healthy People 2020: An Opportunity to Address Societal Determinants of Health in the United States are to 1) Achieve health equity, eliminate disparities, and improve the health of all groups and 2) Create social and physical environments that
promote good health for all. 64 According to NACCHO, in order to achieve health equity, public health must return to a more comprehensive approach that addresses the larger social context.
Public health must:65
• Focus on root causes of health inequities
o Use The National Association of County and City Health Officials’ Guidelines for Achieving Health Equity in your organization.
o Form a community wide health equity coalition
o Budget funding for the development of initiatives for addressing health inequities.
• Inspire alternative ways of thinking more comprehensively about public health practice
o Dialogues on race and racism to develop new strategies to minimize the impact of racism on health.
o A Chatham County community member suggests, “ …you want people who are trying to look ahead and trying to identify problems and not just identify them but solve them. … The health department needs to be a little bit more forward looking.”
• Shift the philosophy and culture regarding how public health work is done o Identify and build strategic partnerships with community organizations and
organizations in various sectors—link health outcomes to housing, education, employment, political power and other arenas.
o A Chatham County community member suggests, “… collaboration of different agencies coming together to try to solve some of these social issues that has, again, become so prevalent in our society.”
• Develop strong relationships within the community
o Build community empowerment. Promote and increase community-level involvement by supporting leadership development and increasing the capacity within the community to more effectively address health disparities on the local levels.
o Work to develop a culturally competent and diverse workforce that reflects the population in your community.
o Use best practices dedicated to improving the health of minority populations.
30
• Broaden the focus of public health by reforming public health policy and removing constraints to enable action
o Choose a policy arena and advocate for initiatives that will improve the public’s health.
o Increase awareness of health inequities and health equity among the general public and key stakeholders.
Implementing strategies from a health equity model to eliminate health disparities and inequities is essential for creating a healthy and equitable community.
Knowing is not enough; we must apply. Willing is not enough; we must do. --Goethe
1 State Center for Health Statistics.SCHS Racial and Ethnic MinorityHealth Data and
Publications. http://www.schs.state.nc.us/SCHS/data/minority.cfm. Accessed November 19, 2010.
2 Wikipedia. http://en.wikipedia.org/wiki/Minority_group. Accessed November 1,2010.
3 US Department of Health and Human Services. Healthy People 2020: An Opportunity to Address Social Determinants of Health in the United States.
http://www.healthypeople.gov/hp2020/advisory/SocietalDeterminantsHealth.htm Accessed November 2, 2010.
4 Brennan Ramirez LK, Baker EA, Metzler. Promoting Health Equity: A Resource to Help Communities Address Social Determinants of Health. US Department of Health and Human Services. Centers for Disease Control and Prevention; 2008.
5 Institute of Medicine. Unequal Treatment: Confronting Racial and Ethnic Disparities in Healthcare. 2003.
6 National Association of County and City Health Officials. NACCHO Positions: Health Equity http://www.naccho.org/advocacy/positions/upload/05-02.pdf. Accessed November 1, 2010.
7 World Health Organization. Equity, Social Determinants, and Public Health Programmes.
WHO Press: 2010.
8 Hofrichter, R. and Bhatia, R. Tackling Health Inequities through Public Health Practice.
Oxford University Press. 2010.
9 Levy, B. and Sidel, V. Social Injustice and Public Health. Oxford University Press: 2006.
10 Waidmann, T. Urban Institute. Estimating the Cost of Racial and Ethnic Health Disparities.
2009. http://www.urban.org/uploadedpdf/411962_health_disparities.pdf Accessed November 1, 2010
11 North Carolina State Center for Health Statistics, November 2009.
12 North Carolina State Center for Health Statistics, 2006-2008.
13 North Carolina State Center for Health Statistics, November 2009.
14 North Carolina State Center for Health Statistics, November 2009.
15 North Carolina State Center for Health Statistics, November 2009
16 NC Behavioral Risk Factor Surveillance System, State Center For Health Statistics 2003-2005.
32
17 North Carolina Department of Health and Human Services. Minority Health Gap Widens in North Carolina.
http://www.kbr.org/pilotFiles/fckPages/file/2010%20Minority%20Health%20Report%20Card.p df. Accessed November 1, 2010
18 State Center for Health Statistics.SCHS Racial and Ethnic MinorityHealth Data and
Publications. http://www.schs.state.nc.us/SCHS/data/minority.cfm. Accessed November 19, 2010.
19 National Institute of Health. http://crchd.cancer.gov/disparities/defined.html. Accessed August 6, 2010.
20 Virginia Department of Health. Health Equity Definitions.
http://www.vdh.state.va.us/healthpolicy/healthequity/definitions.htm Accessed August 6, 2010.
21 U.S Census. Overview of Race and Hispanic Origin.
http://www.census.gov/prod/2001pubs/cenbr01-1.pdf Accessed August 6, 2010
22 Pew Hispanic Center. http://pewhispanic.org/states/?countyid=37037 Accessed August 6, 2010
23 Coleman, Esther. Issues Impacting People of Color in Chatham County. November 2010.
24 National Poverty Center. The Colors of Poverty: Why Racial and Ethnic Disparities Persist.
2009. http://npc.umich.edu/publications/policy_briefs/brief16/PolicyBrief16.pdf Accessed November 22, 2010.
25 Coleman, Esther. Issues Impacting People of Color in Chatham County. November 2010.
26 Wikipedia. State Failure. http://en.wikipedia.org/wiki/State_failure Accessed August 6, 2010.
27 Unnatural Causes: Is Inequality Making Us Sick. When the Bough Breaks.
http://www.unnaturalcauses.org/assets/uploads/file/UC_Transcript_2.pdf Accessed August 6 2010.
28 March of Dimes. Low Birth Weight.
http://www.marchofdimes.com/medicalresources_lowbirthweight.html Accessed November 20, 2010.
29 Johnson R. and Schoeni R. The Influence of Early Life Events on Human Capital, Health Status, and Labor Market Outcomes Over the Life Course. 2007.
http://npc.umich.edu/publications/u/working_paper05-07.pdf Accessed November 21, 2010.
30 Wikipedia. Life Expectancy.
http://en.wikipedia.org/wiki/List_of_countries_by_life_expectancy Accessed August 6, 2010.
31 Eat Smart Move More. The Burden of Obesity. May 2009.
http://www.eatsmartmovemorenc.com/ObesityInNC/Texts/OBESITY_BURDEN_2009_WEB.p df Accessed November 1, 2010
32 Robert Wood Johnson Foundation. Leadership for Healthy Communities. “Action Strategies Toolkit: A Guide for Local and State Leaders Working to Create Healthy Communities and Prevent Childhood Obesity. May 2009.
33 Scruggs, M., Mendoza, A., Liggin, A., Tate, J., Rajagopalan N. Neighborhood Factors
Contributing to Health Disparities: A Spatial Analysis of Health Resources in Chatham County, NC. 2010
34 Scruggs, M., Mendoza, A., Liggin, A., Tate, J., Rajagopalan N. Neighborhood Factors
Contributing to Health Disparities: A Spatial Analysis of Health Resources in Chatham County, NC. 2010
35 Centers for Disease Control.
http://www.cdc.gov/ostlts/tribal_public_health/documents/January27_2010TCAC_OrientationSu mmary.pdf Accessed November 20, 2010
36 Brennan Ramirez LK, Baker EA, Metzler. Promoting Health Equity: A Resource to Help Communities Address Social Determinants of Health. US Department of Health and Human Services. Centers for Disease Control and Prevention; 2008.
37 World Health Organization. Social Determinants of Health.
http://www.who.int/social_determinants/en/ Accessed October 30, 2010.
38 Brennan Ramirez LK, Baker EA, Metzler. Promoting Health Equity: A Resource to Help Communities Address Social Determinants of Health. US Department of Health and Human Services. Centers for Disease Control and Prevention; 2008.
39 Coleman, Esther. Issues Impacting People of Color in Chatham County. November 2010 http://www.chathamnc.org/Index.aspx?page=902 Accessed November 23, 2010.
40 Brennan Ramirez LK, Baker EA, Metzler. Promoting Health Equity: A Resource to Help Communities Address Social Determinants of Health. US Department of Health and Human Services. Centers for Disease Control and Prevention; 2008.
41 Virginia Department of Health. Health Equity Definitions.
http://www.vdh.state.va.us/healthpolicy/healthequity/definitions.htm. Accessed August 6, 2010.
34
42 Hofrichter, R. Health Equity: Exploring the Social and Economic Dimensions. National Association of County & City Health Officials.
http://www.americashealthrankings.org/2009/commentary/NACCHO.aspx Accessed October 30, 2010.
43 King County. Equity and Social Justice Initiative.
http://www.kingcounty.gov/exec/equity/resources.aspx Accessed November 20, 2010.
44 King County Government: www.kingcounty.gov/equity. Accessed November 20, 2010.
45 Institute of Medicine. Unequal Treatment: Confronting Racial and Ethnic Disparities in Healthcare. 2003.
46 Wikipedia. http://en.wikipedia.org/wiki/Minority_group. Accessed November 1,2010
47 Unnatural Causes: Is Inequality Making Us Sick. When the Bough Breaks.
http://www.unnaturalcauses.org/assets/uploads/file/UC_Transcript_2.pdf Accessed October 30, 2010.
48 Jones, C. Levels of Racism: A Theoretic Framework and Gardener’s Tale. American Journal of Public Health. 2000.
49 DR Works. Dismantling Racism: A Workbook for Social Change Groups.
http://www.dismantlingracism.org/
50 US Supreme Court Case 388. Loving vs. Virginia.
http://caselaw.lp.findlaw.com/scripts/getcase.pl?court=us&vol=388&invol=1 Accessed November 21, 2010
51 DR Works. Dismantling Racism: A Workbook for Social Change Groups.
http://www.dismantlingracism.org/
52 Institute of Medicine. Unequal Treatment: Confronting Racial and Ethnic Disparities in Healthcare. 2003.
53 DR Works. Dismantling Racism: A Workbook for Social Change Groups.
http://www.dismantlingracism.org/
54 Unnatural Causes: In Sickness and In Wealth.
http://www.unnaturalcauses.org/assets/uploads/file/UC_Transcript_1.pdf Accessed October 31, 2010
55 Unnatural Causes: In Sickness and In Wealth.
http://www.unnaturalcauses.org/assets/uploads/file/UC_Transcript_1.pdf Accessed October 31, 2010
56 Hofrichter, R. and Bhatia, R. Tackling Health Inequities through Public Health Practice.
Oxford University Press. 2010
57 Hofrichter, R. and Bhatia, R. Tackling Health Inequities through Public Health Practice.
Oxford University Press. 2010.
58 Hofrichter, R. and Bhatia, R. Tackling Health Inequities through Public Health Practice.
Oxford University Press. 2010.
59 Domhoff W. Wealth Income and Power.
http://sociology.ucsc.edu/whorulesamerica/power/wealth.html Accessed October 30, 2010.
60 Domhoff W. Wealth Income and Power.
http://sociology.ucsc.edu/whorulesamerica/power/wealth.html Accessed October 30, 2010.
61 Unnatural Causes: In Sickness and In Wealth.
http://www.unnaturalcauses.org/assets/uploads/file/UC_Transcript_1.pdf Accessed October 31, 2010
62 Hofrichter, R. and Bhatia, R. Tackling Health Inequities through Public Health Practice.
Oxford University Press. 2010
63 US Department of Health and Human Services. Office of Minority Health What is Cultural Competency? http://www.omhrc.gov/templates/browse.aspx?lvl=2&lvlid=11 Accessed August 6, 2010.
64US Department of Health and Human Services. Healthy People 2020: An Opportunity to Address Social Determinants of Health in the United States.
http://www.healthypeople.gov/hp2020/advisory/SocietalDeterminantsHealth.htm Accessed November 2, 2010.
65 National Association of County and City Health Officials. Guidelines for Achieving Health Equity in Public Health Practice. April 2009.