5-5 5-3 City of Cary Summary of Annual Average Daily Irrigation Gallons per Day by Location by.
Analysis Objective
Analysis Approach
Water Usage and Utility Account Data
In addition to Aquastar meter data, the City provided WTP Cary/Apex production data, water treatment plant distribution data, and daily wastewater system flow monitoring. Spatial linkage between meter data and lot and building data was completed for all meter records, but most of this information was intended for use with SFR service locations.
Database and Analytical Tools
Database Query Development
Limitations were identified in the daily usage data as discovered during the quality control (QC) review process and were specifically related to calculated consumption field data resulting from missed readings or miscalculated points of data. Calculated monthly usage data was used moving forward in the analysis, including the development of annual average daily consumption values for each meter.
Overall Water System Demand
Cary's water system is defined by all jurisdictions and service areas provided water service by the town, including Cary, Morrisville, RTP South and RDU Airport.
Population and Service Locations
Population estimates and number of service locations include the City of Cary, City of Morrisville, RTP South and RDU Airport. Annual percentage growth in population and service locations include the City of Cary, City of Morrisville, RTP South and RDU Airport.
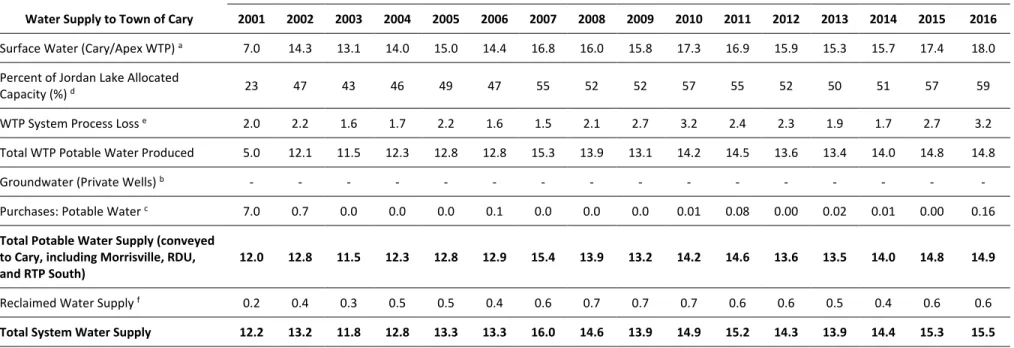
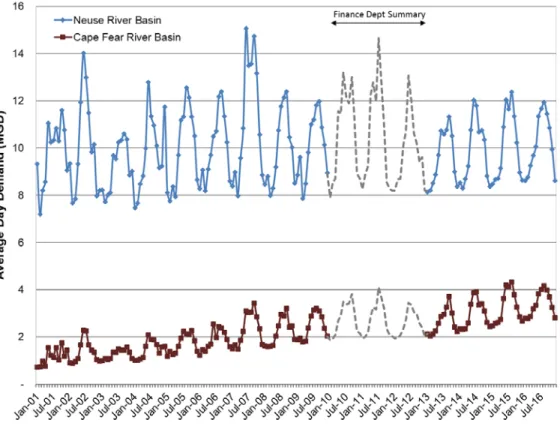
Cary/Apex Water Treatment Plant Production Trends
Maximum day-completed water demand and peak factors include the Town of Cary, the City of Morrisville, RTP South and RDU Airport.
Water Production Trend Comparison to Population Growth
The comparison of annual population growth and water demand includes the City of Cary, City of Morrisville, RTP South and RDU Airport.
Annual Average Daily Potable Water Usage
Summary of annual average daily drinking water use by watershed, in million gallons per day Includes City of Cary, City of Morrisville, RTP South and RDU Airport. Summary of Annual Average Daily Drinking Water Use by Jurisdiction and Customer Type, in Millions of Gallons per Day Includes City of Cary, City of Morrisville, RTP South and RDU Airport.
Annual Average Daily Reclaimed Water Usage
Nonrevenue Water
With Aquastar daily usage data, the city can review patterns and relationships between daily customer usage data to operational data and weather data, which was not previously possible with monthly billing data. This section provides a review of daily water demand patterns, maximum daily demand analysis, and the relationship between water demand and weather variables.

Daily Demand Patterns
Comparison of Daily Final Water Production and Aquastar Usage Data Includes City of Cary, City of Morrisville, RTP South and RDU Airport, but excludes wholesale water sales. Figure 4-3 shows a comparison of daily consumption by customer type with Aquastar's daily consumption data on total consumption and daily production. Aquastar's comparison of daily final water production and usage data by customer type includes the City of Cary, City of Morrisville, RTP South and RDU Airport, but excludes wholesale water sales.

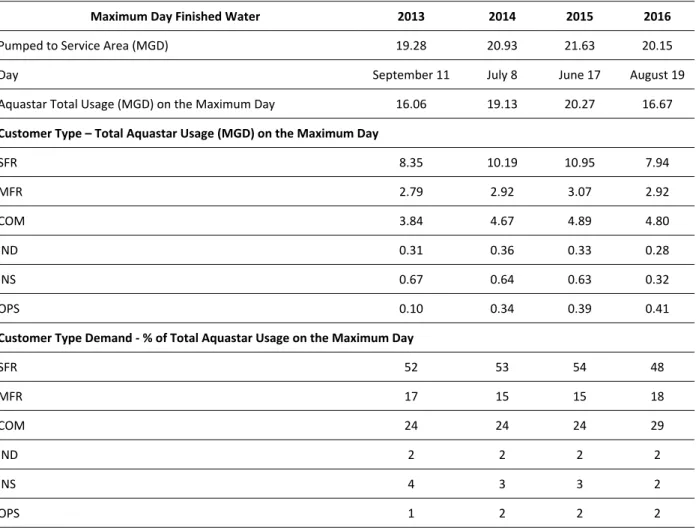
Maximum Day Demand Analysis
In 2016, 40 percent of SFR demand was used outdoors on the maximum day, a volume of approximately 3 MGD. Less than 20 percent of SFR service locations are classified as 'low peakers', with a maximum daily peak factor of less than 4.
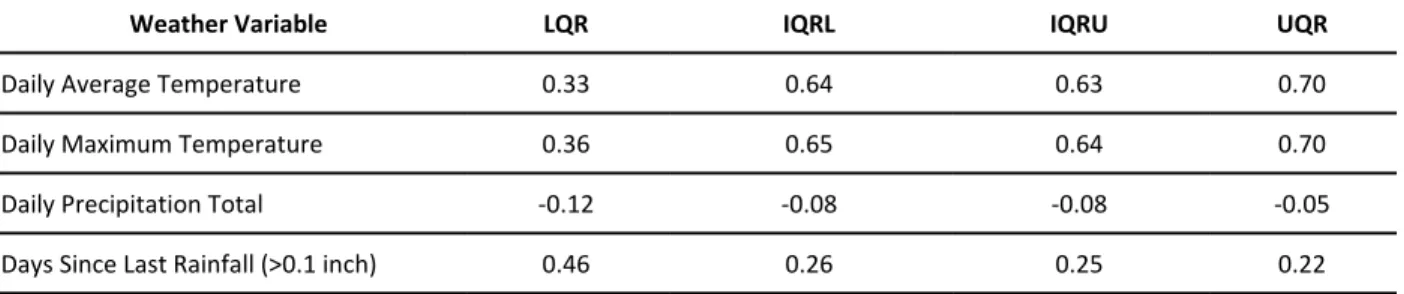
Weather Variable Correlation
However, it was determined that most of the variables were significant (p-values less than 0.01, and t-statistics greater than 2.0) in explaining some of the variation in the data from the SFR quartile range of daily use totals. Correlation Coefficients for Comparing the 2013-2016 Daily Use Totals by Single-Family Residential Quartile Series with Daily Weather Variables.
Monthly Demand Patterns
The monthly water use analysis described in this section followed a methodology similar to that of the 2010 Water Use Analysis, and thus helps understand seasonal demand patterns over a year, as well as long-term seasonal demand patterns. Monthly average drinking water consumption per day, by watershed, January 2001 - December 2016 Includes the City of Cary, City of Morrisville, RTP South and RDU Airport. Monthly average drinking water consumption per day, by customer type, January 2001 - December 2016 Includes the City of Cary, City of Morrisville, RTP South and RDU Airport.
Seasonal Variation in Water Use
Separately Metered Irrigation and Reclaimed Water Accounts
Separately Metered Irrigation Accounts
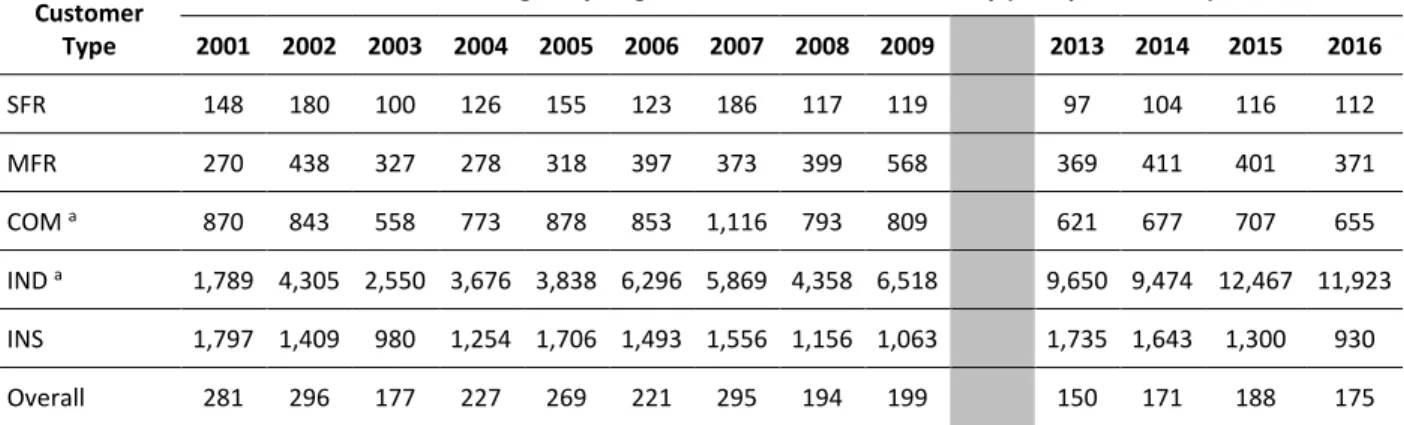
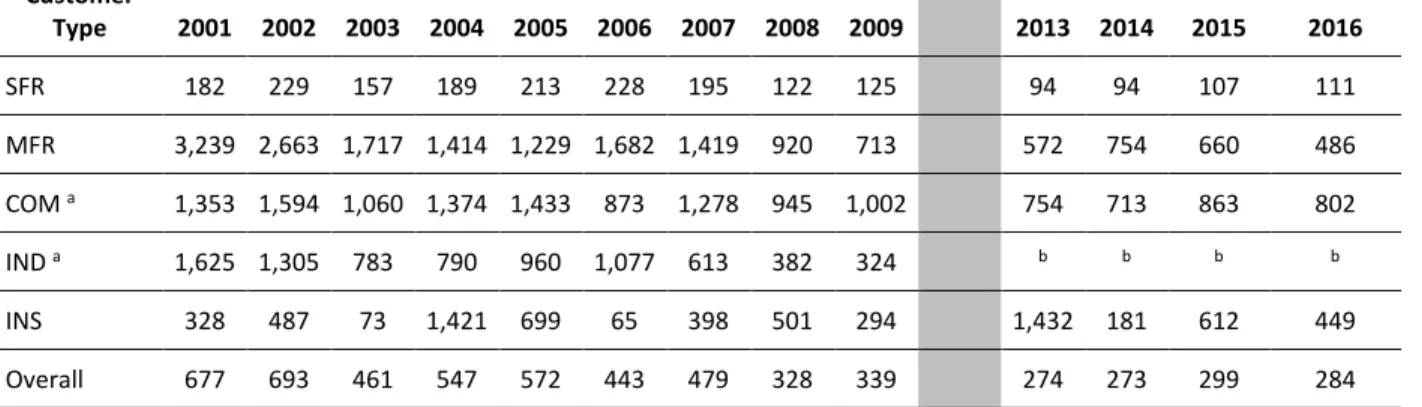
Tables 5-5 through 5-7 show the same information as Tables 5-2 through 5-4 for separately metered irrigation accounts within the jurisdiction of the Town of Morrisville. City of Cary Percent of Total Irrigation Use by Customer Type and 2013-2016 Includes City of Cary separately metered irrigation accounts only. City of Morrisville Summary of Annual Average Daily Irrigation Gallons per day per location by customer type and 2013-2016.
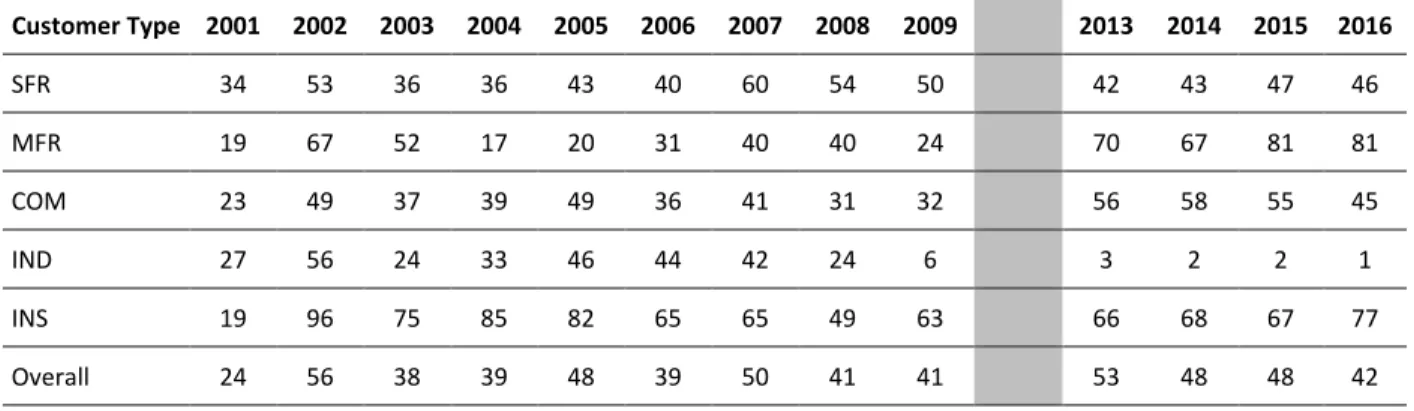
City of Morrisville Percentage of total irrigation use by customer type and 2013-2016 includes only City of Morrisville's separately maturing irrigation accounts.

Reclaimed Water Accounts
Seasonal Variation in Domestic Water and Reclaimed Water Use for Reclaimed Water Accounts and 2013-2016 Includes City of Cary Reclaimed Water Accounts Only Table 5-8. Summary of Annual Average Reclaimed Water Demand by Customer Type and 2013-2016 Includes Town of Cary reclaimed water accounts. Percent of total usage from reclaimed water by customer type and 2013-2016 includes only by-Carys reclaimed water accounts.

Annual Average Daily Unit Consumption Statistics
- Single-family Residential Statistics
- Multifamily Residential Statistics
- Commercial Statistics
- Industrial Statistics
- Institutional Statistics
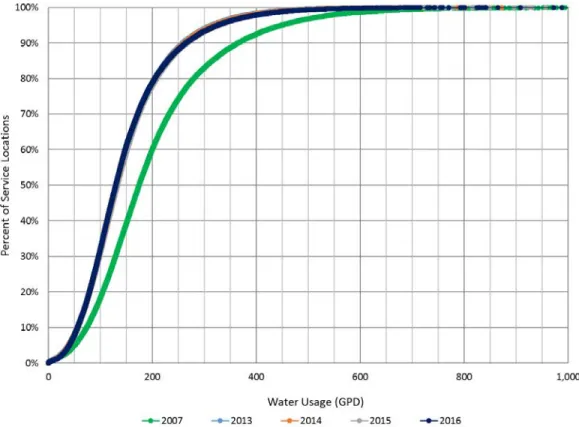
Town of Cary Cumulative distribution of commercial annual average gallons per day per square foot values, 2007 and 2013-2016. Town of Cary Cumulative Distribution of Industrial Annual Average Gallons per day per square foot values, 2007 and 2013-2016. Institutional Annual Average Gallons per day per square feet and 2013-2016 Includes all institutional housing accounts from the cities of Cary and Morrisville.
Town of Cary Cumulative Distribution of Institutional Annual Average Gallons per day per square foot values, 2007 and 2013-2016.
Seasonal Indoor and Outdoor Usage Profile
2013–2016 Average Monthly Residential Gallons per Family Day per Residence, Total and External Demand and Irrigation includes all accounts from the cities of Cary and Morrisville. 2013–2016 Average Monthly Residential Gallons per household per day for residence, indoor and outdoor, and irrigation requirements. 2013–2016 Average Daily Monthly Gallons per day per location for Commercial, Total, and Irrigation and Outdoor Demand accounts includes all accounts from the cities of Cary and Morrisville.
2013–2016 Monthly Average Day in Gallons per day per commercial account location, indoor and outdoor and irrigation demand includes all accounts from the cities of Cary and Morrisville.

Maximum Monthly and Daily Peaking Profiles
Single-family Residential Peaking Profiles
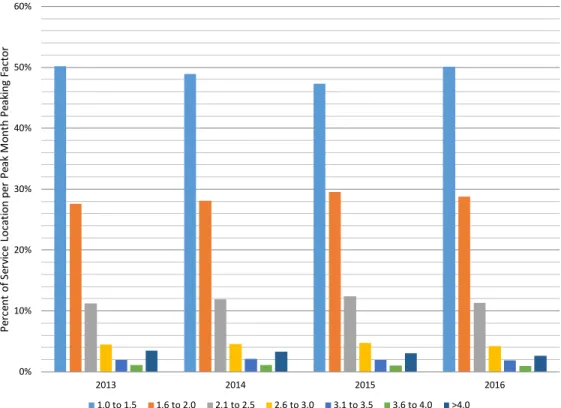
The maximum monthly peak factor distribution for single-family residential homes includes all bills from the cities of Cary and Morrisville. The highest monthly single-family residential apportionment factor includes only separately metered irrigation bills from the cities of Cary and Morrisville. The highest monthly peak distribution factor for single-family residences includes only single-meter bills from the cities of Cary and Morrisville.
Single Family Homes Maximum Daily Peak Factor Breakdown for 2016 Comparing Separately Metered Bills and Separately Metered Bills Includes all bills from the cities of Cary and Morrisville.
Commercial Peaking Profiles
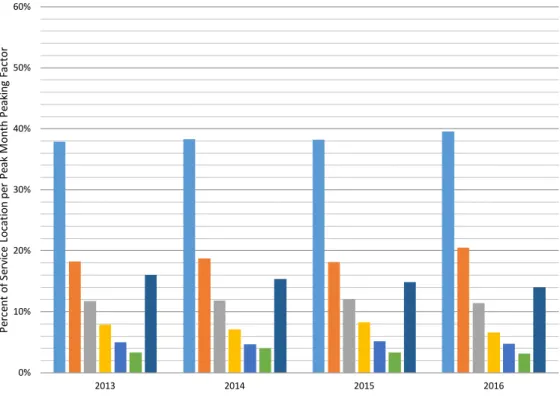
Commercial maximum monthly peak factor distribution includes all accounts from the cities of Cary and Morrisville. Commercial maximum monthly peak factor distribution includes only separately metered irrigation accounts from the cities of Cary and Morrisville. Commercial maximum monthly peak factor distribution includes only single meter accounts from the cities of Cary and Morrisville.
Commercial Maximum 2016 Peak Factor Daily Distribution Single and Separately Matured Accounts Comparison includes all Accounts from the Cities of Cary and Morrisville.
Single-family Residential Water Use Trends
- Single-family Residence Age Water Use Profile
- Single-family Residential Indoor and Outdoor Use Profile
- Single-family Residence Parcel and Building Characteristic Use Profile
- Future Considerations of Single-family Residential Trends
Monthly average single-family homes in gallons per day per home, by residential age block Includes all accounts from the cities of Cary and Morrisville. Includes only separately metered irrigation accounts for the cities of Cary and Morrisville Age Block. Period Average single-family homes Gallons per capita per day, by residential age block Includes all accounts for the cities of Cary and Morrisville.
Single-Family Residential Parcel and Building Characteristics by Residence Age Block, 2016 Includes all accounts from the Towns of Cary and Morrisville.

Water System Profile
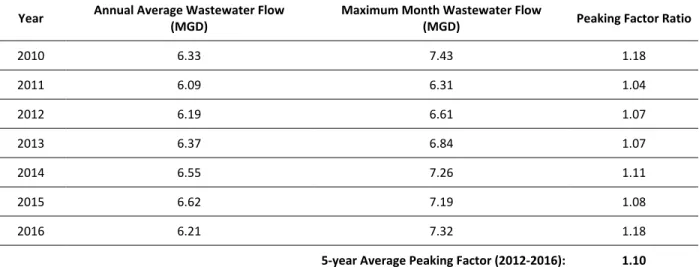
Wastewater System Profiles
The water usage statistics presented here are benchmarks for the current behavior of the city's water usage and can be used for ongoing monitoring of the city's customer base. These benchmarks can also be used to compare the city's water usage trends with other utilities. Ongoing monitoring recommendations are derived from A Guide to Customer Water-Use Indicators for Conservation and Financial Planning (AWWA, 2013).
These sections are arranged and titled to reflect the organization of TM's water use analysis.
Water Use Analysis Objective and Approach
Water Usage and Utility Account Data
In preparing the water use analysis to update the city's long-range water resource plan, CH2M used data from the city, including meter records and geographic information system (GIS) data for analytical use. The purpose of this Technical Note (TM) is to document the methodology used to identify water use trends and summarize water use statistics for the City. The mapping from the specific categories used by the city to the generalized categories was.
Shown are four detailed categories used by the city (class, cycle route, jurisdiction and detailed customer type) and how they were sorted into the generalized customer type created for this analysis.
Database Query Development
Some sections of this analysis required additional information regarding the building and parcel for a given account. This data was entered into GIS and used to link meters to their respective building and parcel. Parcel PIN numbers were mapped to the meter database and then used to link meters to building and parcel data.
This process was also used to update watershed information for records without an assigned watershed.
Water System Overview
Daily Water Use Trends
Monthly Water Use Analysis
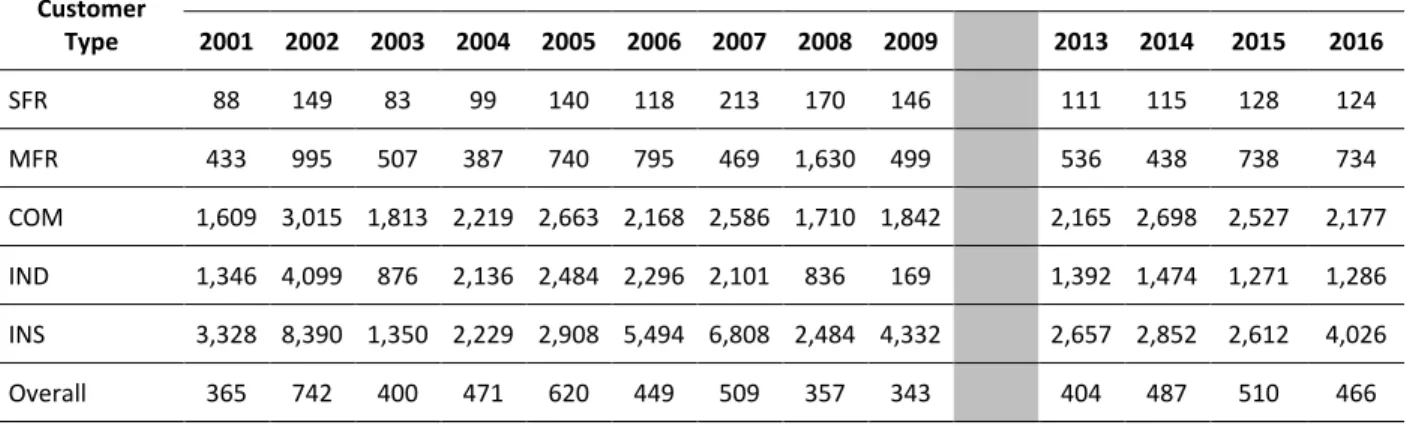
Town of Morrisville Summary of Annual Average Daily Irrigation Gallons per day per account by customer type and 2013-2016.
Unit Consumption Analysis
Single‐family Residential Indoor and Outdoor Use Profile
The same data is used to produce figures 6-12 to 6-14 in section 6.2 of the water consumption analysis TM. In addition, this data is used to produce figures 6-16 to 6-18 in section 6.3.1 of the water consumption analysis TM.
Single‐family Residence Parcel and Building Characteristics Use Profile
System Profiles for Forecast
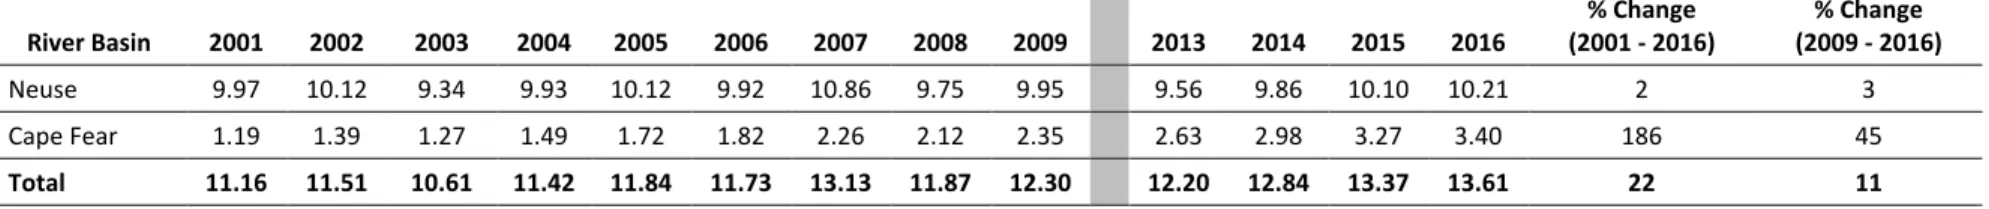
From this point, the outdoor water demand of single-meter residences is calculated using the procedure outlined in the main TM (standing average of winter months to establish baseline indoor use). Of the treated water that is distributed throughout the town's service area, a portion remains in the Cape Fear River Basin, and a portion is used in the Neuse River Basin. A portion of finished water is collected after use and treated at the town's water recycling facilities.
The city's other two treatment facilities are the North Cary WRF (NCWRF) and the South Cary WRF (SCWRF).
95. based on a review of the percentiles for separately metered irrigation for SFR homes built after 2010 for the time period 2013-2016. 50. based on the annual average outdoor demand for SFR homes w/ a single meter built after 2010 for the time period 2013-2016. 95. based on the annual average outdoor demand for SFR homes w/ a single meter built after 2005 for the time period from Source: 2010 Water Consumption Analysis).
50th based on the annual average demand for all MFR accounts for the period from 2013-2016.