AUTOMATION OF THE LABOR FORCE AND INFORMALITY WITH FOCUS ON THE
COLOMBIAN CASE
@Fedesarrollo Fedesarrollo
Calle 78 # 9 - 91, Bogotá, Colombia.
Teléfono: (601) 3259777
Investigadoras | Cristina Fernández y Cecilia Suescún Salazar
BOGOTÁ, JULIO 11 DE 2023
Automation of the labor force and informality with focus on the Colombian case
Cristina Fern´andez
*and Cecilia Suesc´un Salazar
†July 11, 2023
Abstract
This study explores the potential impact of automation on jobs in Colombia, with a specific focus on the informal economy. To do this, we applyFrey and Osborne (2017) andIADB (2019) automation probabilities and Mihaylov and Tijdens(2019) routine task intensities to the Colombian context. We estimate that machines could replace around 57% of Colombian jobs within the next 10 to 20 years. We find that the percentage of high-risk occupations for informal workers is slightly higher than for formal workers, but the risk is slightly lower for workers in informal firms compared to those in formal firms. The results also highlight divergent findings depending on the methodology used, with some indicating that informal workers hold more automatable jobs, while others suggest the opposite. Younger workers and women are identified as groups facing a higher risk of automation, emphasizing the need for targeted attention to these demographics in the future.
Keywords:Automation, technological change, occupational choice, routine and non-routine tasks, job loss.
JEL codes: E24, J23, J24, O33.
*Fedesarrollo researcher. E-mail:[email protected]
†Research assistant at Fedesarrollo. E-mail:[email protected]
1 Introduction
The disruptive effect of technological change on the labor market has been extensively docu- mented (Acemoglu & Autor, 2011;Acemoglu & Restrepo, 2018). Additionally, robotization and other technological innovations displace workers who carry out routine activities with medium skill levels (Autor, Levy, & Murnane, 2003;Goos & Manning,2007). However, automation can also complement and increase the demand for workers with high levels of qualification in carrying out non-routine activities and increase the general productivity of the economy, with a consequent increase in the demand for other workers, such as non-routine workers. This reduction in occu- pations that perform routine activities with medium skill levels, and the consequent increase in cognitive activities that require high and low skill levels, is known as polarization.
According to the Future of Jobs Report 2023 (World Economic Forum,2023), the level of task automation remains relatively unchanged compared to three years ago when the previous report was published. Currently, around one-third (34%) of tasks are automated, representing a mere 1%
increase from the 2020 figure. Furthermore, surveyed companies have revised their expectations for future automation downwards, with an anticipated automation rate of 42% of tasks by 2027, as opposed to the previous estimate of 47% by 2025 (World Economic Forum,2023).
However, while the displacement of physical and manual work by machines is expected to decrease, tasks involving reasoning, communication, and coordination – which are areas where humans have a comparative advantage – are predicted to become more automatable in the future (World Economic Forum,2023). The adoption of artificial intelligence, a significant driver of algo- rithmic displacement, is projected to reach nearly 75% among surveyed companies. Moreover, its implementation is expected to result in significant workforce turnover, with 50% of organizations anticipating job growth and 25% expecting job losses as a consequence (World Economic Forum, 2023).
Nonetheless, according to a recent survey on the labor market in Bogot´a (PROBOGOT ´A, 2022), Colombia, there has been an increase in the adoption of new technologies by companies in 2022. As reported byPROBOGOT ´A(2022), 33% of the surveyed firms adopted new technolo- gies frequently, representing a 13 percentage point increase from the previous year. The survey also found that 80% of the companies reported having automated some process, a 12 percentage point increase from the previous year’s figure of 68%. Finally, the survey showed that the percent- age of employees who believe their jobs can be replaced by technology has increased from 39% in 2021 to 54% in 2022. The sectors with the highest percentage of employees who believe their jobs can be replaced by technology are commerce (59%), manufacturing (57%), and accommodation and restaurants sectors (57%) (PROBOGOT ´A,2022).
Although the evidence on polarization in developed countries, and especially in Latin Amer- ica, is mixed (Autor, 2019; Egana-delSol, Bustelo, Ripani, Soler, & Viollaz, 2022), research for Colombia shows that there is at least some degree of polarization in the country (Fern´andez &
Mej´ıa, 2021; Medina & Posso, 2010). Despite these findings and the prevalence of informality in developing countries, the relationship between informality and automation has seldom been analyzed.
In Colombia, according toFern´andez and Mej´ıa(2021), the polarization caused by automation is present in the formal market but not in the informal market. This is consistent with the fact that there are fewer incentives to replace workers with technology in the informal sector, which faces relatively low relative prices of labor and relatively high relative prices of capital (Kim, Loayza, & Meza Cuadra Balcazar, 2016). This price distortion can be accentuated in a scenario of automation in the formal sector, which displaces workers from the formal sector to the informal sector and reduces remuneration in this sector. However, these results should be further analyzed sinceBrambilla, C´esar, Falcone, Gasparini, and Lombardo(2022) find a higher risk of automation in the informal economy.
In this article, we examine aggregate employment in Colombia for 2022 to answer the fol- lowing research question: What percentage of the Colombian labor force is currently exposed to automation? We distinguish the impact among formal and informal workers and formal and infor- mal firms. We also conduct differential analysis by socio-economic characteristics such as gender and age and across the different employment sectors. Finally, our findings are compared with similar exercises performed in other developing countries.
We divide our analysis into three different analyses to answer our research question. For our first analysis of the paper, we estimate automation risk in the Colombian labor market by com- bining automation probability data by Frey and Osborne (2017) with microdata from the Great Household Integrated Survey (GEIH) at the industry level in Colombia. In our second analysis of this paper, we analyze the automation risk in the Colombian labor market again, but this time we use the automation probabilities estimated by theIADB(2019). Finally, in our third and final anal- ysis, we estimate the task composition and routine task intensity by combining our labor market data with the measures developed byMihaylov and Tijdens(2019).
This paper is divided into six sections. In the second section, we conduct an extensive literature review on automation and informality in Latin America (LAC) and Colombia. The third section introduces the information sources used in our analysis. The fourth section explains the empirical methodology for the three analyses mentioned above. Finally, the fifth section presents our main results, and the last section concludes.
2 Literature review
2.1 Automation and its effects on the labor market in LAC and Colombia
The effect of technological change on the labor market – both on wages and employment – has been the topic of extensive research and policy discussion in recent decades. For developed economies, the literature has documented patterns that would be consistent with polarization (see, for example,Autor, Katz, and Kearney(2006) andAutor and Dorn(2013) for the US;Goos, Man- ning, and Salomons(2014) for Europe). This phenomenon consists of technological innovations:
i) displace workers and reduce occupations that perform routine activities with medium-skill levels and ii) increase in cognitive activities that require high and low skill levels (Autor et al.,2003;Goos
& Manning, 2007). According toAutor(2019), a certain degree of market polarization began to
be observed in developed countries between 1980 and 1990, and this process has accelerated since 2000.
However, the literature has provided little evidence of similar results in developing economies.
Maloney and Molina(2016) andMaloney and Molina(2019) use census data to search for evidence of labor displacement by automation and find little or no evidence of polarization in developing countries. Das and Hilgenstock(2022) use data since 1990 for 85 developed and developing coun- tries and find similar results. Finally,Soto(2020), in his literature review, also finds little evidence of widespread technology-related job or wage polarization in emerging countries. The author the- orizes that the employment polarization observed in some emerging economies could be explained by structural change and, more precisely, by the decline of the agricultural sector.
Nevertheless, the above evidence does not mean that technological change will not result in polarization in emerging economies. Martins-Neto, Mathew, Mohnen, and Treibich(2021) review the literature on employment polarization in developing countries and suggest that it is slower than in developed economies. However, the authors find that developing countries show a decrease in routine intensity, a precondition for employment polarization, and an indicator of changes in skill demand. Similarly,Das and Hilgenstock(2022) warn that the rising exposure to routinization in emerging economies increases the risk of polarization. Soto (2020) also argues that the labor market disruption generated by automation is likely to affect developing countries later in time than advanced ones.
2.1.1 Automation in Latin America and the Caribbean
In Latin America and the Caribbean (LAC), the literature suggests that labor polarization is only partially occurring. Amaral et al. (2019), using data from the Labor Markets and Social Security Information System for LAC (SIMS-BID), find that lower and higher wage occupations have increased, but these wage changes do not follow the behavior observed in other regions.
Likewise, although the employment rate of medium-wage occupations in LAC has declined and high and low-wage jobs have grown, these changes have been of lesser magnitude than those observed in other regions.
This partial or absent polarization has been corroborated by Brambilla, C´esar, Falcone, Gas- parini, and Lombardo (2021), who reached similar conclusions for the six largest economies in Latin America (Argentina, Brazil, Chile, Colombia, Mexico, and Peru). The authors show that automation has primarily affected workers in routine intensive occupations, but that there is no ev- idence of polarization in the labor market. Similar results are found by: Messina, Pica, and Oviedo (2016) and Messina and Silva(2017) using the Skills for Employment and Productivity Surveys (STEP); Beylis, Jaef, Sinha, and Morris(2020) using the methodology proposed byAutor et al.
(2003) andAcemoglu and Autor(2011) for 11 LAC countries; andJaniak, Jeldres, Lafortune, and Tessada(2022), followingAutor(2015), for Argentina, Brazil, Chile, Colombia, Mexico, and Peru.
Janiak et al.(2022) theorize that the reason behind this is that the occupations that technological change displaces were never “middle-class” jobs, but were more spread across the distribution.
Brambilla, C´esar, et al. (2022) assess the asymmetric risks of automation for the six Latin
American economies based on the two alternative indicators of automation risk from Frey and Osborne(2017),Arntz, Gregory, and Zierahn(2016) andMelanie, Terry, and Ulrich (2020). The authors find that the threat of automation is highest for the sectors of Commerce, Restaurants and Hotels, Transportation, Communications, and Household Services and lowest in Teaching, Health, and Social Services. Likewise, the risk of automation is higher for the unskilled and semi-skilled (although this is somewhat lower) and for younger workers (Brambilla, C´esar, et al., 2022;Gasparini, Brambilla, Falcone, & Lombardo,2021). Additionally,Egana-delSol et al.(2022) studied the risk of automation in Bolivia, Chile, Colombia, and El Salvador. The authors show that women are at higher risk of automation than men in Bolivia, Chile, and Colombia. This is because men in these countries are more likely than women to perform tasks related to what they call the
”skills of the future”, such as STEM, ICT, and creative problem-solving tasks, among others.
Finally, the crisis triggered by COVID-19 may have significantly affected automation and the labor market in the region. For example,Egana-delSol, Cruz, and Micco(2021) show that COVID- 19 is a catalyst for the automation process in emerging markets, especially in Chile. Bonavida, Brambilla, and Gasparini (2022) find that, due to the pandemic, there is a new polarization of occupations in the six largest economies of the region. On the one hand, there are those occupations with more routine tasks, which are more susceptible to automation and have less compatibility with telework, and, on the other hand, those that can work remotely and require more analytical, abstract, or cognitive tasks. Therefore, job loss and displacement in pandemic situations may be more accelerated in occupations where remote work is less feasible, and the risk of automation is higher. Valenzuela and Reinecke (2020) also found that the sectors most affected by COVID-19 were those with the greatest automation risk.
2.1.2 Automation in Colombia
The literature focusing specifically on Colombia is scarce. According toBrambilla, C´esar, et al.(2022), Colombia has the second-highest proportion of jobs with high automation risk in Latin America (17%), only after Mexico. Differences between regions within the country are minimal.
According to Medina and Posso(2010), there has been growth in both income and employment at the extremes of the skill or wage distribution. According to their findings, there is evidence of occupational and wage polarization in Colombia, which was most prominent between 1995 and 2008, a period during which the availability of digital technology grew rapidly. According toAcosta, Muller, and Sarzosa (2015), cognitive skills in Colombia are strongly linked to higher incomes, formal employment, and highly qualified occupations.
In a more recent study,Martin(2018) calculated how Internet use affected wages in Colombia and discovered a positive and statistically significant correlation between Internet use and income.
Also, in line with polarization patterns, medium-skilled workers receive the lowest wage premium for using the Internet, but workers at the bottom of the skill distribution enjoy the highest wage premium for internet use. Although incipient, according to Fern´andez and Mej´ıa (2021) and as shown in1, there is some degree of polarization in the country, except for the director’s behavior, which requires further analysis.
Figure 1. Change in occupations in Colombia (2002-2019)
Source:Author’s calculations based on the Great Household Integrated Survey (GEIH) and Continuous Household Survey (ECH).
Note:Estimates only include men in the 13 major metropolitan areas.
Additionally, Kugler, Kugler, Ripani, and Rodrigo (2020) examined how automation in the United States affected Colombian workers. The study found that the introduction of robots in the U.S. had detrimental effects on employment and wages in Colombia between 2011 and 2016, with women, older workers, small and medium-sized enterprise employees, and manufacturing workers being particularly affected. Furthermore, formal workers in Colombia faced an increased risk of job loss due to automation in the United States. This study estimated a cumulative job loss of 63,000 to 100,000 in Colombia due to U.S. automation during this period. These findings highlight the visible impact of automation on employment, even without a significant or direct presence of robots. Consequently, it is crucial to acknowledge that advocating against automation may result in incurring the costs associated with it without reaping its benefits.
Finally,Bonilla-Mej´ıa et al.(2022) find that vacancies and salaried jobs in Colombia showed a more prominent decrease during the pandemic and a slower recovery. The acceleration of automa- tion due to the pandemic is disproportionately hurting the labor market for women, people over the age of 40, and occupations with wages close to the minimum wage.
2.2 Informality in Latin America with an emphasis on Colombia
Informality accounts for 70% of total employment in developing economies and emerging mar- kets, compared to around 18% in developed ones (OECD,2019). Additionally, informal economic activity accounts for around one-third of output in the average emerging market or developing nation (Ohnsorge & Yu, 2022). Worldwide, the level of informality is higher among young and
older people, while young people in emerging and developing countries are more likely to work informally (Bonnet, Vanek, & Chen, 2019). Globally, informal employment is a larger source of employment for men. However, in some nations, such as Sub-Saharan Africa and LAC, women outnumber men in the informal sector (OECD,2019).
According toMartins-Neto et al.(2021), the large informal sector in developing and emerging economies, notably LAC, might help explain the level of job polarization in the region. The in- formal sector differs from the formal one in terms of the rate of technological adoption as well as skill demand and wages (Martins-Neto et al., 2021). In general, the informal sector lags behind the formal sector in adopting new technologies (Cirera, Comin, Cruz, & Lee,2021), is labor-intensive and less productive (La Porta & Shleifer, 2014). Furthermore, most workers are involved in low- skilled services and artisanal production (Falco, Maloney, Rijkers, & Sarrias, 2015). As a result, in countries with a large informal sector, the potential for technology-driven job displacement is projected to be less severe.
However, technological change also affects the informal sector – employment, and income – via job displacement (Chacaltana, Leung, & Lee,2018). Gomez(2021), for example, shows that an increase in technology adoption in the formal sector leads to a bigger informal sector using a general equilibrium model. Furthermore,Brambilla, C´esar, et al.(2022) also find a higher risk of automation in the informal economy.
2.2.1 Informality in Latin America and the Caribbean
Labor and business informality are key characteristics of labor markets in LAC (Maurizio, 2022). Informality thrives in LAC due to a combination of factors, including labor market inef- ficiencies, burdensome regulations and taxation, corruption, and significant economic and social inequalities (Maurizio, 2022;Ohnsorge & Yu, 2022;Vorisek et al., 2022). The prevalence of in- formality in the region has been linked to lower output growth, reduced labor productivity, and increased poverty and inequality (Maurizio,2022).
Although output informality has steadily decreased during the last two decades, labor informal- ity has increased in LAC (Ohnsorge & Yu,2022). Currently, nearly 63% of all employed people in the region work in informal occupations (Toledo et al.,2021). The informality rate ranges from about 30% in Chile and Uruguay to 80% in Bolivia, Guatemala, Honduras, and Nicaragua (Toledo et al., 2021). The predicted average for informality rates is almost 20 percentage points higher in Argentina, Colombia, the Dominican Republic, Ecuador, and Peru (Toledo et al., 2021). Ac- cording to Fern´andez, Villar, and G´omez (2017), workers see informality as a default option to unemployment and inactivity in countries such as Peru and Colombia. However, in M´exico and Chile, informality primarily results from choice.
Additionally, according to C´ardenas, Fern´andez, Rasteletti, and Zamora (2021), LAC is the region with the highest rate of informal employment in formal companies, exceeding the Arab countries by more than 50%, the region with the second-highest rate. LAC also has a significant share of unpaid workers in households, comparable to those in Africa (C´ardenas et al.,2021).
Business informality in LAC, although less studied than labor informality, is characterized by certain patterns (Ulyssea,2020). Informal firms are typically smaller and exhibit lower productivity compared to formal firms (Loayza, 2016). Factors such as high tax rates and burdensome tax regulations can incentivize firms to remain in the informal sector (David, Pienknagura, & Roldos, 2020).
For instance, in Mexico, the majority of firms, approximately 90 percent, operate in the infor- mal sector. These firms are predominantly small and exhibit relatively lower levels of productivity, yet they employ more than half of the labor force (David et al.,2020). In Brazil,Ulyssea(2018) show that approximately 50% of the informal firms in Brazil can be classified as ”survival” estab- lishments, which lack the productivity necessary to transition into the formal sector, irrespective of the costs involved in formalization. Additionally, close to 40% of informal firms are classified as opportunistic, as they exploit limited enforcement of regulations to avoid the costs associated with formalization, even if they possess the capacity to do so (Ulyssea,2018).
Interestingly, the evidence shows that formal and informal firms coexist within the same indus- tries (Ulyssea,2018,2020) and they exhibit a significant overlap in terms of productivity distribu- tions, even within these industries (Meghir, Narita, & Robin,2015;Ulyssea,2018).
2.2.2 Informality in Colombia
Since 2010, Colombia has seen a decrease in labor informality (defined as the percentage of persons without access to social security). Nevertheless, the informality rate –around 62.7% of the working population– remains higher than the regional average and much higher when we focus on the rural population (Consejo Privado de Competitividad,2021). According toFern´andez et al.
(2017), the informal sector accounts for 59% of firms, 37% of workers, and 33% of output in the main 24 cities.
The country’s high informality has negative consequences. Informality has been linked with low productivity, affects employment quality, limits access to the social protection system, and contributes to income inequality (Consejo Privado de Competitividad,2020; OECD, 2019). Fur- thermore, according toFern´andez (2020), it is harmful in terms of workers’ job satisfaction and perceived income; reduced likelihood of compliance with tax, health, environmental, and quality requirements; and unfair competition and corruption. Additionally, Fern´andez (2022) demon- strates the difficulty of reducing informality in Colombia’s complicated regulatory structure.
Finally, Acevedo, Castellani, Lotti, and Sz´ekely(2021) estimate that, as of 2021, labor infor- mality could increase to levels higher than in the pre-pandemic era. The reasons for this are: i) the reincorporation of the inactive population into the labor market in search of income and ii) the growth patterns observed in sectoral informality in recent months, indicative of an increase in preferences for more flexible labor relations.
3 Data
In this article, we are interested in calculating the percentage of the workforce in Colombia exposed to automation by 2022. For this, we use and combine the following data sources.
Probability of automation data. We use detailed occupational data from two sources.Frey and Osborne(2017) is our first source. Frey and Osborne(2017) made significant contributions to the literature mentioned above. They not only considered the impact of new technologies but also recognized that advancements in robotics, machine learning, and big data would further displace labor in the future. Their analysis extended the framework of Autor et al.(2003) by providing a broader understanding of what computers are capable of. The authors emphasized that recent tech- nological breakthroughs aimed to transform non-routine tasks into well-defined problems, leading to an increased ability for computers to perform a wider range of tasks.
More specifically, Frey and Osborne(2017) created a methodology to estimate the likelihood of being replaced by machines for most US occupations within the next ten to twenty years. To accomplish this, the authors use the 2010 version of O*NET, a comprehensive database that pro- vides information on the task content of 903 US occupations. The O*NET data was matched to the 702 occupations of the Labor Department’s Standard Occupational Classification (SOC).
Next, they assigned a probability of automation to each occupation by asking machine learn- ing researchers to classify occupations based on whether their tasks –specifically, the routine and non-routine occupational characteristics– could be done by state-of-the-art computer-controlled equipment. Particularly, they chose 70 occupations for which the experts were highly confident in their classification and used a Gaussian process to impute the automatability of the remaining occupations by considering attributes such as manual dexterity, originality, and social perceptive- ness.
Frey and Osborne(2017) find that 47% of jobs in the United States were at high risk of automa- tion. Occupations such as service, sales, and office jobs were particularly vulnerable. The study also revealed that low-skilled and low-wage workers faced a higher risk of automation, potentially leading to disproportionate impacts on these groups (Frey & Osborne, 2017). Additionally,Frey and Osborne(2017) findings (Table1) indicate thatOffice and Administrative Support,Production andFarming, Fishing and Forestryoccupations are the most at risk among the major occupational groups in the SOC-10. However,Healthcare Practitioners and Technical,Management andCom- munity and Social Servicesare among the least automatable occupations.
Table 1. Major Occupational Groups (SOC-10) by automation probability
Rank Occupational Group Probability
1 Office and Administrative Support 0.838
2 Production 0.824
3 Farming, Fishing, and Forestry 0.794
4 Food Preparation and Serving Related 0.784 5 Building and Grounds Cleaning and Maintenance 0.776
6 Construction and Extraction 0.733
7 Transportation and Material Moving 0.684
8 Installation, Maintenance, and Repair 0.675
9 Sales and Related 0.648
10 Business and Financial Operations 0.552
11 Healthcare Support 0.501
12 Legal 0.497
13 Personal Care and Service 0.481
14 Protective Service 0.373
15 Architecture and Engineering 0.279
16 Life, Physical and Social Science 0.250
17 Arts, Design, Entertainment, Sports, and Media 0.238
18 Education, Training and Library 0.225
19 Computer and Mathematical 0.221
20 Healthcare Practitioners and Technical 0.184
21 Management 0.158
22 Community and Social Service 0.043
Source:Author’s calculations based on SOC-10 major occupational groups and Frey and Osborne’s results.
Our second source is a study conducted by Forero, Saavedra, and Fern´andez (2021), which replicated for Colombia the methodology used by the Inter-American Development Bank (IADB, 2019) for Latin America. The IADB (2019) categorizes occupations into four different groups based on their task content: i) non-routine cognitive, ii) routine cognitive, iii) routine manual, and iv) non-routine manual. In terms of automation, manual occupations with a substantial amount of repetitive and routine task, like those performed by factory workers, have a higher risk of being automated. Conversely, knowledge-based occuptions that entail non-repetitive activities, such as architects or photographers, face lower risks since they involve tasks that demand creativity, leader- ship, and other interpersonal skills that robots are still lacking. For this reason,Forero et al.(2021) classify routine cognitive and routine manual occupations as automatable. In their study,Forero et al.(2021) go beyond considering automatable activities by cross-referencing them with educa- tion databases to determine the degree of automatability in different professions. They develop an index that incorporates a variety of methodologies.
It is important to note that while the classification by Autor (2001) and, consequently, the classification by Posso and Medina Durango (2018) for Colombia identified some occupations as non-automatable manual activities, the IADB(2019) classification allows for more flexibility.
Consequently, according toForero et al.(2021), the methodology ofAutor(2001) andPosso and Medina Durango(2018) may be more accurate for analyzing automation in the past, whileIADB (2019) methodology may be more appropriate for analyzing automation in the future.
Using the IADB (2019) methodology, Forero et al. (2021) find that 22% of the employed population in Colombia is engaged in non-routine cognitive occupations, 23% in routine cognitive occupations, 42% in routine manual occupations, and 14% in non-routine manual occupations.
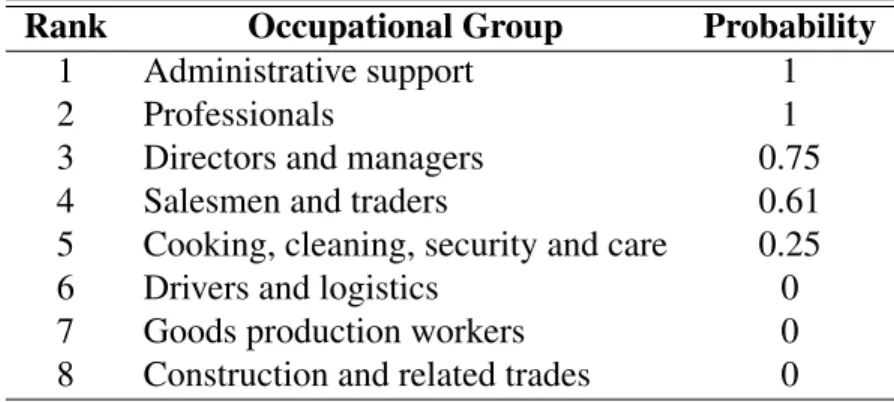
Additionally, according to Table2, occupational groups with a higher probability of automation are Administrative Support andProfessionals, while occupations such as Goods production workers andConstruction and related tradesare among the least automatable.
Table 2. Major Occupational Group (CNO-70) by automation probability Rank Occupational Group Probability
1 Administrative support 1
2 Professionals 1
3 Directors and managers 0.75
4 Salesmen and traders 0.61
5 Cooking, cleaning, security and care 0.25
6 Drivers and logistics 0
7 Goods production workers 0
8 Construction and related trades 0
Source:Author’s calculations based on Forero, Saavedra and Fern´andez and IABD’s results.
Routine task intensity data. We use detailed measures developed by Mihaylov and Tijdens (2019). for 427 occupations using the four-digit International Standard Classification of Occupa- tions 2008 (ISCO-08).
Contrary to the occupation-based approach used byFrey and Osborne(2017) andIADB(2019), Mihaylov and Tijdens(2019) employed a task-based approach to estimate the routine task intensity data for each occupation. As a first step in their methodology, they analyzed 3,264 occupation- specific tasks from the International Standard Occupation Classification and categorized them into five clusters: i) non-routine analytic, ii) non-routine interactive, iii) routine cognitive, iv) rou- tine manual, and v) non-routine manual. The classification of tasks into these clusters was based on their potential for automation (routine versus non-routine) and the cognitive or manual skills required to perform them. They identified specific task elements and characteristics, such as repet- itive actions and rule-based decision-making, to determine routine or non-routine nature.
After categorizing tasks, the authors constructed five measures representing the shares of non- routine analytic, non-routine interactive, routine cognitive, routine manual, and non-routine manual tasks for each of the 427 four-digit occupations. This step involved estimating the task category shares based on a methodology introduced byAntonczyk, Fitzenberger, and Leuschner(2009).
Finally, Mihaylov and Tijdens(2019) estimate the routine task intensity for each occupation using a weighted index. The routine task intensity index reflected the proportion of routine cog-
nitive and manual tasks used in the occupation compared to non-routine analytic, interactive, and manual tasks. As such, the routine task intensity of an occupation increases with the use of routine tasks –either cognitive or manual– and decreases with the use of non-routine tasks –either cogni- tive, analytic or manual. The index ranges between 1 and -1, with a value of 1 indicating that the occupation comprised only routine tasks and a value of -1 indicating that the occupation contained only non-routine tasks.
In terms of major occupational groups (Table3),Mihaylov and Tijdens(2019) findings indicate that occupations Clerical Support Workers, Plant and Machine Operators and Assemblers and Craft and Related Trades Workers show a high routine task intensity and, consequently, are at a higher risk of automation. On the other hand, occupations such asManagers, Professionalsand Elementary Occupationspresent the lowest routine task intensity and as such are at a lower risk of occupations.
Table 3. Major Occupational Group (ISCO-08) by routine task intensity
Rank Occupational Group Routine Task Intensity
1 Clerical Support Workers 0.533
2 Plant and Machine Operators and Assemblers 0.360
3 Craft and Related Trades Workers -0.250
4 Technicians and Associate Professionals -0.388
5 Service and Sales Workers -0.612
6 Skilled Agricultural, Forestry and Fishery Workers -0.614
7 Elementary Occupations -0.717
8 Professionals -0.898
9 Managers -0,908
Source:Author’s calculations based on ISCO-08 major occupational groups and Mihaylov and Tidjens’ results.
It is crucial to acknowledge that the nature of automation classifications –that include both au- tomation probabilities and routine task intensities– is inherently dynamic, continuously evolving as new technological developments emerge. Furthermore, it is worth noting that these classifica- tions do not incorporate the relative prices of labor. This aspect should be taken into account when analyzing the effects of automation, as these relative prices play a significant role in understanding its impact on the workforce and the economy.
Labor market data. We use the Great Household Integrated Survey (GEIH), a cross-sectional survey conducted each month in Colombia that identifies the key outcomes of the labor market.
The GEIH includes data for 23 major cities and their metropolitan areas in Colombia and addresses topics such as earnings, education level, occupation, sector of employment, and age. We use data from the 2022 GEIH and restrict our sample to only the people who were occupied at the time of the survey. To classify occupations, the GEIH uses the Unique Classification of Occupations for Colombia (CUOC in Spanish) which is at a four-digit level and follows the ISCO-08. Using this data, we identify 455 occupations and 89 two-digit employment sectors during this year.
4 Compatibility Methods
To analyze automation risk by occupation in Colombia, we must combine the different data sources mentioned above with the labor market data we have for Colombia. Next, we will describe the different steps for each data source that we performed to achieve each match.
4.1 Combining Frey & Osborne’s automation probability and GEIH
1. From U.S. to International classification Frey and Osborne (2017) estimate a probability for 702 occupations found in the O*NET database, classified by the 2010 American Standard Occupation Classification (SOC-10) at a six-digit level in the United States. In order to transition from the SOC-10 to the International Standard Classification of Occupations (ISCO-08), we use a crosswalk provided by the Bureau of Labor Statistics of the United States. Multiple international papers have employed this crosswalk from SOC to ISCO1.
It is important to note that there is a significantly larger number of occupations in the SOC- 10, which has approximately 802 different codes, compared to ISCO-08, which has 438 different codes. Therefore, numerous automation probabilities are assigned to each occupation: i) the min- imum, ii) the average and iii) the maximum. The challenge to select only one probability per occupation will be dealt with in the fourth and final stage of our compatibility methodology.
2. From International to Colombian classification The standard occupation classification in Colombia is the Unique Classification of Occupations for Colombia (CUOC in Spanish) which is at a four-digit level and follows the ISCO-08. To match the CUOC to the ISCO-08, we used a self-developed crosswalk that only involves re-grouping the disaggregation made for certain spe- cific occupations in the CUOC. In order to develop this crosswalk, we used information provided by the body responsible for producing national employment data, the National Administrative De- partment of Statistics –DANE, in Spanish.
Next, we applied the automation probabilities predicted by Frey and Osborne(2017) that had already been translated to the ISCO-08 to the Colombian CUOC. This step had basically no chal- lenges and, more specifically, our compatibility method was successful in the majority of situations (421 out of 455 occupations).
3. Applying automation probabilities to Colombian data This step consisted only of applying theFrey and Osborne(2017) probabilities that had already been translated to the Colombian CUOC to the 2022 GEIH data. We encountered no complications in this step, as the 2022 GEIH data also uses the CUOC.
Before continuing, it is worth mentioning that we were able to assign at least one automa- tion probability to 412 of the 446 occupations present in the GEIH data. The other 34 were also
1World Bank(2016) follows a process similar to the one described in this article. However, these authors apply Frey and Osborne(2017) automation probability to numerous developing countries in order to estimate the fraction of occupations in these countries that can be replaced by machines.
successfully matched, but to occupations with no automation probability in the originalFrey and Osborne (2017) study. Therefore, these 19 occupations were assigned no automation probabil- ity. This represents a loss of approximately 5.98% of the observations in the GEIH sample. The complete list of lost occupations can be found in Table5.
4. Selecting one automation probability for each occupation In this stage of the analysis, we needed to select a single automation probability for each occupation. FollowingOttoni, Estrela, Santos, and Barreira (2022) for the Brazilian context, we used the GEIH 2022 data, considering specific characteristics of the Colombian labor market, to make this choice. The first step involved calculating the difference between the estimates of the number of jobs that can be automated using the maximum and minimum automation probabilities for all 412 occupations.
Next, the differences are ordered from lowest to highest, allowing us to separate occupations into two distinct groups. The first group consists of occupations where the choice of selection cri- teria seems to have minimal impact on the calculation of the number of jobs that can be automated.
The second group comprises occupations where the selection criteria are highly relevant, resulting in substantial variations in the estimated number of jobs that can be automated. The second group consists of the top 40 occupations with the largest differences.
For the first group of occupations, we used the average probability for simplicity. In contrast, for the second group of occupations, a different approach was taken. Non-managerial occupations2 in the Colombian classification are assigned the maximum automation probability, following the original Frey and Osborne (2017) data, where high automation probabilities are typically asso- ciated with non-managerial roles. Managerial occupations3 in the Colombian classification are assigned the minimum automation probability, again aligning with the original data, where man- agerial roles tend to have lower automation probabilities (Frey & Osborne,2017)4.
4.2 Combining IADB’s automation probability and GEIH
1. From International to Colombian classification As previously explained, to match the CUOC to the ISCO-08, we used a self-developed crosswalk that only involves re-grouping the disaggregation made for certain specific occupations in the CUOC.
2. From the CNO-70 to International classification TheIADB(2019) automation probability is estimated for the 2-digit National Classification of Occupations (CNO-70 in Spanish), formerly used in Colombia. To match the CNO-70 to the ISCO-08, we perform multiple steps. First, the International Labour Organization (ILO) created a four-digit equivalent of ISCO-08 and ISCO- 88. Based on this crosswalk, we match each occupation of the CUOC classification and ISCO-88 classification. Then, we use a transcription of a DANE database, made byMoreno Narvaez(2022),
2Non-managerial occupations according to the CUOC are all occupations with codes that begin with any number different from 1.
3Non-managerial occupations according to the CUOC are all occupations with codes that begin with 1.
4It is crucial to acknowledge that the definition of managerial roles in a developed country may significantly differ from the understanding and tasks performed by managers in Colombia. For instance, in Colombia, if being a manager equates to being a shopkeeper, then it is likely that this occupation is highly susceptible to automation.
that correlates the four-digit ISCO-88 to the two-digit CNO-70.
This step allows us to match the CUOC –previously translated to ISCO-08– and the IADB (2019) automation probabilities. However, similar to the challenge faced with (Frey & Osborne, 2017) probabilities, multiple automation probabilities are assigned to each occupation: i) the mini- mum, ii) the average and iii) the maximum. This problem is dealt with in the fourth and final stage of our compatibility methodology.
3. Applying automation probabilities to Colombian data Similar to our compatibility method with (Frey & Osborne, 2017), this step consisted only of applying theIADB(2019) probabilities that had already been translated to the Colombian CUOC to the 2022 GEIH data. We encountered no complications in this step, as the 2022 GEIH data also uses the CUOC.
Furthermore, it is worth mentioning that, because we had to use multiple crosswalk, we were not able to assign at least one automation probability to 150 of the 446 occupations present in the GEIH data. This loss corresponds to approximately 18.16% of the observations in the GEIH sample. The complete list of lost occupations can be found in Table5.
4. Selecting one automation probability for each occupation We employ a similar methodol- ogy as the one used with the (Frey & Osborne,2017) automation probabilities. The only difference is that our second group contains the top 33 occupations with the largest differences, instead of the top 40. We made this decision based on the fact that, after applying the IADB (2019) data to the Colombian context, there is no difference between the estimates of the number of jobs that can be automated using the maximum and minimum automation probabilities for the other 264 occupations.
4.3 Combining Mihaylov & Tidjens’ routine task intensity and GEIH
1. From International to Colombian classification Finally,Mihaylov and Tijdens(2019) esti- mate the routine task intensity for 427 occupations classified by ISCO-08. Therefore, in this case, we only make the match between CUOC and ISCO-08. As we previously explained, this step only involves re-grouping the disaggregations made for the Colombian case. This step allows us toMihaylov and Tijdens(2019) routine task intensity to the CUOC translated to the ISCO-08.
2. Applying the routine task intensity index to Colombian data This stage only involved applying theMihaylov and Tijdens (2019) estimates to the 2022 GEIH data. We encountered no complications in this step, as the 2022 GEIH data also uses the CUOC.
In this case, the loss of occupation is minimal. After matching the labor data with Mihaylov
& Tidjens’ routine task intensity, we lose approximately 0.79% of the observations in the GEIH sample. This loss corresponds to 10 occupations out of the 434 in the GEIH. The complete list of lost occupations can be found in Table5.
5 Results
Following the method of applying Frey and Osborne (2017) automation probabilities to the Colombian context, we estimate that 57% of the country’s jobs, respectively, are at high risk of being replaced by machines in the next 10 to 20 years.
To our understanding, this estimate seems to align with what would be expected for the coun- try. This result is similar to the estimate made byGasparini et al.(2021), who estimate the risk of automation for the largest economies in Latin America (Argentina, Brazil, Chile, Colombia, Mex- ico, and Peru). Gasparini et al. (2021) find that Colombia is among the top 3 countries with the highest risk of automation (63%) using the probabilities calculated byFrey and Osborne (2017).
This result also holds when the authors use the probabilities estimated byArntz et al.(2016).
Additionally,World Bank(2016) has estimated the proportion of jobs susceptible to automation across a selection of developing nations (for a concise overview, refer toOttoni et al.(2022)). Our estimation for Colombia falls within the range of estimates observed in other developing countries, which spans from 55.2% to 84.9%, and is similar to those projected for countries in the Latin American and Caribbean (LAC) region.
Our result also aligns reasonably well with the seminal study by Frey and Osborne (2017), where they estimate that 47.0% of jobs in the United States could be automated. We believe this because the proportion of jobs susceptible to automation tends to be higher in developing countries compared to developed countries (World Bank,2016). This discrepancy arises from the specialization of developing countries in occupations that require minimal qualifications and are thus more readily replaceable by machines (AfDB, ADB, EBRD, & IADB,2018).
Additionally, we estimate that 52% of the country’s formal jobs5may be automated. However, we calculated a higher risk of automation for the informal sector. We found that as much as 64%
of the country’s informal jobs are at high risk of automation in the next two decades. This finding is in line with the estimations made byOttoni et al.(2022) for Brazil.
However, we also find that the percentage of occupations at high risk for workers in informal firms6 (45%) is lower than that for workers in formal firms (60%). These findings underline a greater vulnerability of informal workers to automation, but also highlight a significant difference between being an informal worker and working at an informal firm.
5In this article, we define an informal worker as a worker who does not make contributions to health or pension funds.
6In this article, we define an informal firm as a firm without commercial registration and that does not keep accounting records (such as annual balance sheets and profit and loss statements) or a daily operations’ log. It is important to mention that this indicator is based on the worker’s perception of the firm they work for.
Figure 2. Proportion of jobs by automation probability
Source:Author’s calculations based on the Great Household Integrated Survey (GEIH), Frey & Osborne’s results.
Note:The figure displays the share of workers by automation risk category for 2022. Risk categories consider the results of Frey & Osborne (2017) to compute the probability of automation by occupations. The occupations are classified as follows: low-risk (probability lower than 30%), medium-risk (probability higher than 30 and equal or lower than 70%), and high-risk (probability higher than 70%).
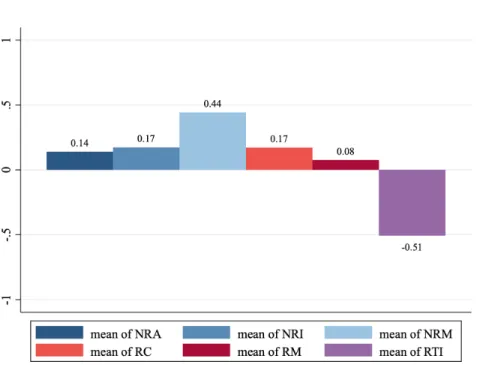
Looking at the task composition, according to Figure 3, we find that Colombian occupations mainly comprise non-routine tasks (non-routine analytic, non-routine interactive, and non-routine manual) that represent approximately 75% of the tasks. More specifically, non-routine manual tasks account for approximately 44% of the tasks in Colombians’ occupations.
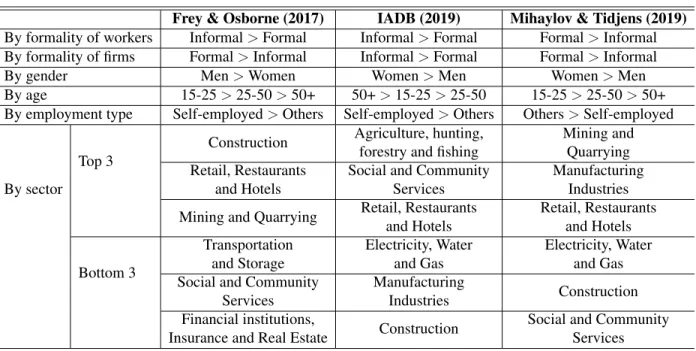
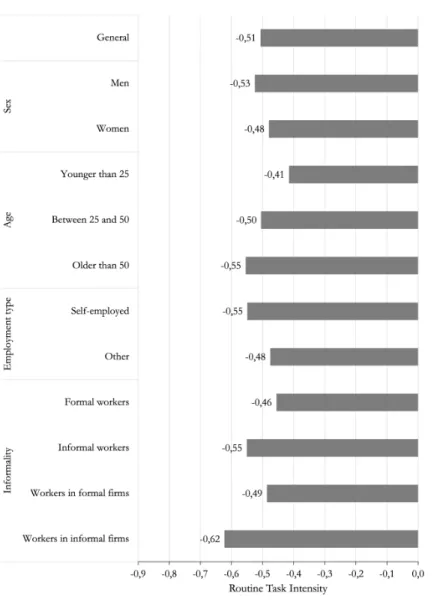
Our main results are summarized in Table4. Additionally, our results are presented in Figures 4,5,6,7in AnnexB. Figure4disaggregates the probability of automation by worker’s and firm’s characteristics and by methodology. Figure3 presents the routine task intensity by worker’s and firm’s characteristics. Finally, Figures6and7show the automation probabilities and routine task intensity, respectively, by employment sector. In the following subsections, we talk in detail about our results.
Figure 3. Task composition of occupations in Colombia
Source:Author’s calculations based on the Great Household Integrated Survey (GEIH) and Mihaylov & Tidjens’s results.
Note:The figure displays the routine task composition of occupations in Colombia. In this case, “NRA” represents the percentage of non-routine analytic tasks; “NRI” represents the percentage of non-routine interactive tasks; “NRM” represents the percentage of non-routine manual tasks;
“RC” represents the percentage of routine cognitive tasks; “RM” represents the percentage of routine manual tasks; finally, “RTI” represents the routine task intensity estimated using the five measures previously mentioned.
Table 4. Summary of main results
Frey & Osborne (2017) IADB (2019) Mihaylov & Tidjens (2019) By formality of workers Informal>Formal Informal>Formal Formal>Informal By formality of firms Formal>Informal Informal>Formal Formal>Informal
By gender Men>Women Women>Men Women>Men
By age 15-25>25-50>50+ 50+>15-25>25-50 15-25>25-50>50+
By employment type Self-employed>Others Self-employed>Others Others>Self-employed
By sector
Top 3 Construction Agriculture, hunting,
forestry and fishing Mining and Quarrying Retail, Restaurants
and Hotels Social and Community
Services Manufacturing
Industries Mining and Quarrying Retail, Restaurants
and Hotels Retail, Restaurants and Hotels Bottom 3
Transportation
and Storage Electricity, Water
and Gas Electricity, Water and Gas Social and Community
Services Manufacturing
Industries Construction
Financial institutions,
Insurance and Real Estate Construction Social and Community Services
5.1 Results by formality of workers
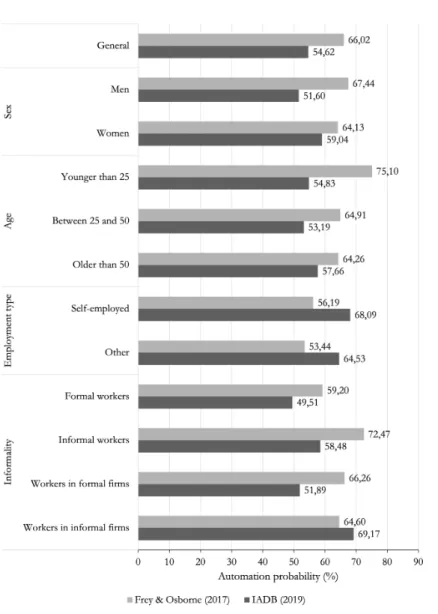
When we concentrate on the differences between formal and informal workers, we find that informal workers in Colombia face a higher probability of automation in their occupations (72%) compared to formal workers (59%) using Frey and Osborne (2017) probabilities. These results hold when considering theIADB(2019) probabilities. According to these probabilities, informal workers (58%) also have a higher likelihood of automation compared to informal workers (50%).
Similarly, usingMihaylov and Tijdens(2019) routine task intensity, we find that informal work- ers have occupations with a lower intensity of routine tasks compared to formal workers, which means that the risk of automation is lower for informal workers.
Examining the task composition in relation to informality in Figure 10, we observe that for- mal workers have a higher percentage of routine tasks (cognitive and manual) in their occupations (27%) compared to informal workers (23%). Specifically, the disparity arises from formal workers having a higher percentage of routine cognitive tasks (21%) than informal workers (14%). Addi- tionally, formal workers exhibit higher percentages of non-routine analytical and interactive tasks (22% and 21% respectively) compared to informal workers (7% and 14% respectively). However, it is noteworthy that informal workers have a significantly higher percentage of non-routine manual tasks (57%) compared to formal workers (30%). This implies that informal workers primarily en- gage in non-routine manual tasks, while the task distribution for formal workers is more diversified across various task categories (excluding manual routine tasks).
5.2 Results by formality of firms
The information presented indicates that there are differences between formal and informal workers in terms of their exposure to automation risks. When considering the probabilities es- timated by Frey and Osborne (2017), we find that workers in formal firms in Colombia have a slightly higher probability of automation in their occupations (66%) compared to workers in infor- mal firms (65%). However, the difference between the two groups is minimal, indicating that the risk of automation is relatively similar for both formal and informal workers.
Contrasting these findings, the results using IADB (2019) indicate that workers in informal firms (69%) actually face a higher likelihood of automation compared to workers in formal firms (52%). Moreover, considering the routine task intensity, we observe that workers in informal firms tend to have occupations with a lower intensity of routine tasks compared to workers in formal firms. This implies that informal workers and workers in informal firms have a lower risk of automation, as their job tasks are less routine in nature.
Analyzing the task composition differences between workers in formal and informal firms (Figure11), we find that workers in formal firms have a higher percentage of routine tasks (26%) compared to those in informal firms (19%). Specifically, workers in formal firms exhibit a higher percentage of routine cognitive tasks (18%) than those in informal firms (12%). Additionally, workers in formal firms have a slightly higher percentage of routine manual tasks (8%) compared to those in informal firms (7%). On the other hand, workers in formal firms have higher percentages
of non-routine analytical and interactive tasks (15% and 18% respectively) compared to workers in informal firms (10% and 16% respectively). Notably, informal workers have a significantly higher percentage of non-routine manual tasks (56%) compared to formal workers (42%). This suggests that the task distribution in formal firms spans across multiple categories, excluding manual routine tasks, while workers in informal firms primarily focus on non-routine manual tasks.
5.3 Results by gender
According to our results, in terms of gender, we observe that men in Colombia face a higher risk of automation in their occupations compared to women, according toFrey and Osborne(2017) probabilities andMihaylov and Tijdens(2019) routine task intensity. However, when we consider the probabilities from theIADB(2019) the situation reverses. In this case, women (59%) have a higher likelihood of automation in their occupations than men (52%). These contrasting findings suggest that the impact of automation on gendered employment patterns may vary depending on the specific probabilities utilized.
The evidence on the gendered effects of automation in Latin America is also mixed7. Gasparini et al.(2021) andBrambilla, C´esar, et al.(2022) find that the risk of automation is higher for men than for women for the six largest Latin American economies (including Colombia). Interestingly, while young men face a higher risk of automation compared to young women, this trend reverses for older workers (Brambilla, C´esar, et al.,2022; Gasparini et al., 2021). However, according to Bustelo et al.(2019), using a task-based approach, they find that in Colombia, 30% of women will be displaced because of automation while only 26% of men will be displaced. Egana-delSol et al.
(2022) also find a similar result.
Examining the task composition of occupations by gender, we find that women generally have occupations with a higher proportion of routine tasks, both cognitive and manual (26%), com- pared to men (24%). This finding is in line withHauret, Martin, Lewandowski, Palczy´nska, and ˇSalamon(2023) who find that, in Europe, women tend to engage in tasks that are more routine- intensive compared to men. Additionally, women experience greater pay penalties when working in occupations that require a higher degree of routine tasks (Hauret et al.,2023).
However, men’s occupations exhibit a significantly higher percentage of non-routine manual tasks (49%) compared to women’s occupations (37%). Interestingly, these results contradict the findings reported byEgana-delSol et al.(2022), who suggest that men in LAC countries are more likely than women to engage in tasks associated with ”skills of the future,” encompassing STEM, ICT, and creative problem-solving tasks. Consequently, our findings imply that women may be more involved in non-routine analytical and interactive tasks in the Colombian context.
Although our results are relatively ambiguous, they also highlight the importance of studying and understanding the gendered impacts of automation and paying great attention to women, who appear to be more likely to face different occupational challenges than men when it comes to automation.
7SeeBustelo, Suaya, and Viollaz(2019) for a detailed summary of the evidence on the gendered effects of au- tomation in the world
5.4 Results by age group
In terms of age, using the probabilities from Frey and Osborne(2017), we find that workers under 25 years old in Colombia have the highest probability of automation in their occupations, with a rate of 75%. The likelihood of automation decreases with age, as workers between 25 and 50 years old exhibit the second-highest probability (64.91%), while workers over 50 years old have the lowest probability (64%). However, the difference in automation probability between workers over 50 and those between 25 and 50 is not substantial.
These findings suggest that younger workers face a greater risk of automation and are in line with studies which highlight the higher vulnerability of young workers to automation. Brambilla, C´esar, et al. (2022) and Gasparini et al. (2021) find that, for the six largest economies in Latin America, the percentage of jobs at high-risk of automation decreases with age until around 30, and then it rises very slowly with age. Additionally, Brambilla, C´esar, Falcone, and Gasparini (2022) reveal that young workers, despite having similar characteristics to older workers, are more susceptible to displacement due to automation in Chile. However, they note that younger cohorts with higher skill levels and mobility, suggesting that they have promising opportunities to work alongside automation technology in the near future. Conversely, the most vulnerable group of workers comprises unskilled young individualsBrambilla, C´esar, et al.(2022).
In contrast, when employing theIADB (2019) probabilities, a different pattern emerges. Ac- cording to these probabilities, workers over 50 present the highest automation risk (57%) while those under 25 have the second-highest automation probability (55%). These results indicate that, according to theIADB(2019) probabilities, older workers are also vulnerable to automation. This may be explained by the fact that gender also plays a role in the risk of automation by age. Albi- nowski and Lewandowski(2022) find that the implementation of information and communication technology (ICT) and robots had a positive impact on the proportions of young and prime-aged women in the workforce, while decreasing the proportions of older women and prime-aged men.
The adverse effects were particularly noticeable for older women in cognitive occupations, as they had lower skills related to ICAlbinowski and Lewandowski(2022)T. Similarly, young men in rou- tine manual occupations experienced displacement due to the substitution by robots, resulting in negative effects on their employment prospects (Albinowski & Lewandowski,2022).
Analyzing the routine task intensity based on Mihaylov and Tijdens (2019) results, we find that workers under 25 years old tend to have occupations with a higher intensity of routine tasks, followed by those between 25 and 50, and then those over 50. This aligns with the findings obtained using Frey and Osborne (2017) probabilities and complements the understanding that younger workers, who have higher routine task intensity, are more susceptible to automation. Brambilla et al. (2021) also find that the prevalence of routinization appears to be more prominent among very young workers for the six largest economies in Latin America. The routine task content index shows a decline in value as age increases until around the age of 28, after which it gradually starts to rise. However, it is important to note that there is some variation in this pattern. Specifically, in Argentina, the RTC index primarily decreases as workers age (Brambilla et al.,2021) .
Regarding the task composition by age, as shown by Figure9, we find that workers under 25
have a higher percentage of routine tasks (cognitive and manual) compared to those between 25 and 50 and those over 50. Specifically, workers under 25 have a higher percentage of routine cognitive tasks (20%) compared to the other age groups. Additionally, they also exhibit a higher percentage of routine manual tasks (10%). Conversely, workers between 25 and 50 have the highest percentages of non-routine analytical tasks (15%) and non-routine interactive tasks (18%).
5.5 Results by employment type
According to the results found usingFrey and Osborne(2017) probabilities, we found that self- employed workers have occupations with a higher probability of automation (68.09%) compared to workers in other types of employment (65%). Similarly, using theIADB(2019) probabilities, our results also indicate that self-employed workers have a higher likelihood of their occupations being automated (56%) than other types of workers (50%). These findings suggest that self-employed workers seem to face unique challenges in adapting to technological advancements.
However, contrasting results emerge when considering the routine task intensities estimated by Mihaylov and Tijdens(2019). Our findings reveal that self-employed workers have lower routine task intensity compared to other types of workers. This suggests that self-employed individuals have occupations that are less automatable than other workers.
Examining the task composition by employment category, presented in12, further reveals in- teresting insights. Our findings show that self-employed individuals have a lower proportion of non-routine analytic (11%) and non-routine interactive (16%) tasks compared to workers in other employment categories. On the other hand, self-employed workers have a higher percentage of non-routine manual (51%) tasks and routine manual (7%) tasks than other types of workers. This suggests that self-employment in Colombia often involves occupations that rely heavily on manual work, especially non-routine manual work, potentially explaining the lower routine task intensity observed.
5.6 Results by sector
Using the probabilities fromFrey and Osborne(2017), we identify the top three employment sectors with the highest probability of automation. These sectors include Construction, Retail, Restaurants and Hotels, andMining and Quarrying. On the other hand, the sectors with the lowest probability of automation are Transportation and Storage, Social and Community Services, and Financial Institutions, Insurance, and Real Estate.
Comparing these results with the probabilities derived from the IADB(2019), we find some differences. According to the IADB (2019) probabilities, the top three sectors with the highest probability of automation areAgriculture, Hunting, Forestry and Fishing, Social and Community Services, andRetail Restaurants and Hotels. In contrast, the sectors with the lowest probability of automation areElectricity, Gas, and Water,Manufacturing Industries, andConstruction.
Analyzing the routine task intensity from Mihaylov and Tijdens (2019), we observe another perspective on the sectors with the highest probability of automation. According to this analy-
sis, the top three sectors with the highest probability of automation are Mining and Quarrying, Manufacturing Industries, and Retail, Restaurants and Hotels. Conversely, the sectors with the lowest probability of automation are Electricity, Gas, and Water, Construction, and Social and Community Services.
Our findings with the findings using Frey and Osborne (2017) probabilities, where Mining and Quarryingand Retail Restaurants and Hotelssectors appeared as highly automatable, while Social and Community Serviceswere among the least automatable sectors. They also align with the findings fromGasparini et al.(2021) andBrambilla, C´esar, et al. (2022). In these studies, the authors find that the sectors with the highest risk of automation are: Commerce, Restaurants and Hotels,Transportation,CommunicationsandDomestic Services(Brambilla et al.,2021;Gasparini et al., 2021). They also find that the probability of automation is the lowest in sectors such as Teaching,HealthandSocial Services(Brambilla et al.,2021;Gasparini et al.,2021).
Examining the task composition by employment sector (Figure 13), we find interesting pat- terns. Sectors such asElectricity, Gas, and Waterhave the highest percentage of non-routine tasks (95%) –especially non-routine manual tasks (80%)– followed byConstruction (86%) andSocial and Community Services (84%). Furthermore, Transportation and Financial Institutions, Insur- ance and Real Estate exhibit the highest percentage of non-routine analytic tasks (32%), while Transportation also leads in non-routine interactive tasks (34%). These findings demonstrate the variations in task composition across different sectors, highlighting the diversity and importance of non-routine tasks in certain industries.
Additionally, it is worth noting that certain sectors are highly concentrated in specific types of tasks. For example, Agriculture, Hunting, Forestry and Fishing, and Construction are pre- dominantly focused on non-routine manual tasks. This concentration is also observed in Retail, Restaurants, and Hotels. However, other sectors exhibit a greater diversity of tasks. Financial In- stitutions, Insurance, and Real Estateare characterized by a range of tasks, as areSocial and Com- munity ServicesandManufacturing Industries, albeit to a lesser degree. These findings underscore the heterogeneity in task distribution and specialization among various employment sectors.
6 General Equilibrium Model
To analyze the effect of automation on the Colombian labor market in a more rigorous manner, we use the general equilibrium model developed byFern´andez(2023). This model is an adaptation ofUlyssea(2018) model, specifically tailored to the Colombian context.
6.1 The Model
This model has a production function with diminishing returns for formal and informal firms, but with differentiated costs. Informal firms do not pay taxes but face non-linear costs of being penalized by authorities, which depend on the size of their informal workforce. It is assumed that informal firms hire all their skilled and unskilled workers informally. The cost of capital is decreasing in capital according to a logistic function, with finite upper and lower limits.
Formal firms pay value-added tax –VAT or IVA, in Colombia– and income taxes if they exceed the threshold. They have variable costs and incur in costs associated with the probability and non- linear cost of being penalized by authorities if they hire workers informally, or in the payment of social security and the minimum wage if they hire workers formally. The number of informal workers in each firm depends on the equalization of the marginal labor costs of hiring formally and informally, and is independent of firm size but dependent on the skill level of the worker and whether the firm is above or below the tax threshold. Additionally, the capital costs are similar to those of informal firms but without the additional cost of informality. Furthermore, these firms benefit from deductions on income tax for fixed costs and labor costs. These deductions for labor costs are similar in amount to the cost of social security.
There is a considerable number of firms that enter the market and decide to operate formally or informally based on an idea of productivity, which is related to actual productivity. If the produc- tivity shock is negative, firms may exit the market without producing anything. These firms decide whether to operate formally or informally based on their idea of productivity, which undergoes a cost-benefit analysis. Formal firms generally face higher entry costs than informal firms, and there is a higher probability of exit for informal firms compared to formal firms
6.2 Results
This section reports some results of the simulation conducted on the previously described gen- eral equilibrium model byFern´andez(2023). In this simulation, an increase of 10% in the intensity of skilled labor is assumed for formal firms, both with and without a 5% increase in capital partic- ipation.
Automation, understood as an increase in the use of skilled workers by formal firms, has a positive impact on formal firms, but it is even more beneficial for informal firms because it reduces the price of unskilled labor. The findings also show some transition of formal firms to informality.
However, if automation not only involves substituting unskilled labor with skilled labor but also implies increases in capital, the positive effect on formal firms is larger than the effect on informal firms, and transitions from informality to formality are observed.
Regarding the macroeconomic impacts of automation, in general, automation increases busi- ness informality, informal GDP, and informal employment while reducing overall output. How- ever, if automation is accompanied by capital investments, it produces opposite effects.
7 Conclusions
In this paper, we investigated to what extent Colombian jobs might be exposed to automation in the near future. We add to previous studies by including the informal economy in the investigation.
Using the automationFrey and Osborne(2017) probabilities, we estimate that machines may replace approximately 57% of Colombian jobs within 10 to 20 years. For the informal workers, we estimated a slightly larger percentage of occupations at high risk (64%) than that for the formal