In this study, a three-factor, three-level Box-Behnken design with response surface methodology and quadratic programming was used to maximize the total organic carbon (TOC) removal and the H2O2 residue in the effluent of the combined UV-C/ H2O2/VUV system for treating actual slaughterhouse wastewater. Mehrab Mehrvar, from the Department of Chemical Engineering at Ryerson University, and my co-supervisor Dr.
INTRODUCTION
On the other hand, an increase in equipment size will result in higher costs and lower process efficiency (Mohajerani et al., 2012). Advanced oxidation processes (AOPs) have been proven to be efficient treatment methods for degrading resistant materials or mineralizing stable, inhibitory or toxic contaminants (Tabrizi and Mehrvar, 2004). These instabilities include the low settling rate and the treatment of the ammonium ions (NH4+) and hydrogen sulfide (HS−) in anaerobic treatment effluent (Heijnen et al., 1991; Cao and Mehrvar, 2011).
LITERATURE REVIEW
Introduction
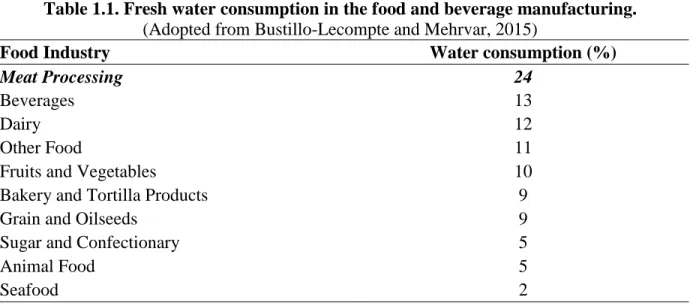
Slaughterhouse wastewater characteristics
- Slaughterhouse wastewater guidelines and regulations
- Environmental impacts
- Health effects
Mineralization of these algae can lead to the death of aquatic life due to oxygen depletion (Belsky et al., 1999). Finally, pollutants such as chromium and unionized ammonia are directly toxic to aquatic life (Verheijen et al., 1996; Bustillo-Lecompte and Mehrvar, 2015).

Slaughterhouse wastewater treatment methods
Finally, the use of combined processes is a cost-effective approach that can lead to a reduction in operating and maintenance costs when compared to individual processes (Tritt and Schuchardt, 1992; Chan et al., 2009; Luiz et al. , 2011; Bustillo-Lecompte et al Bustillo-Lecompte and Mehrvar, 2015).
Advanced oxidation processes for slaughterhouse wastewater treatment
- UV/H 2 O 2 process
- Photolysis of slaughterhouse wastewater by VUV
According to Bolton et al. 2001), a steady-state analysis of this general mechanism gives the overall kinetic rate for the UV/H2O2 process as shown in equation (2.29). Low-pressure mercury lamps are typically limited to less than 300 W of electrical input (Barrera et al., 2012).
Need for combined UV-C/H 2 O 2 /VUV processes for slaughterhouse wastewater treatment
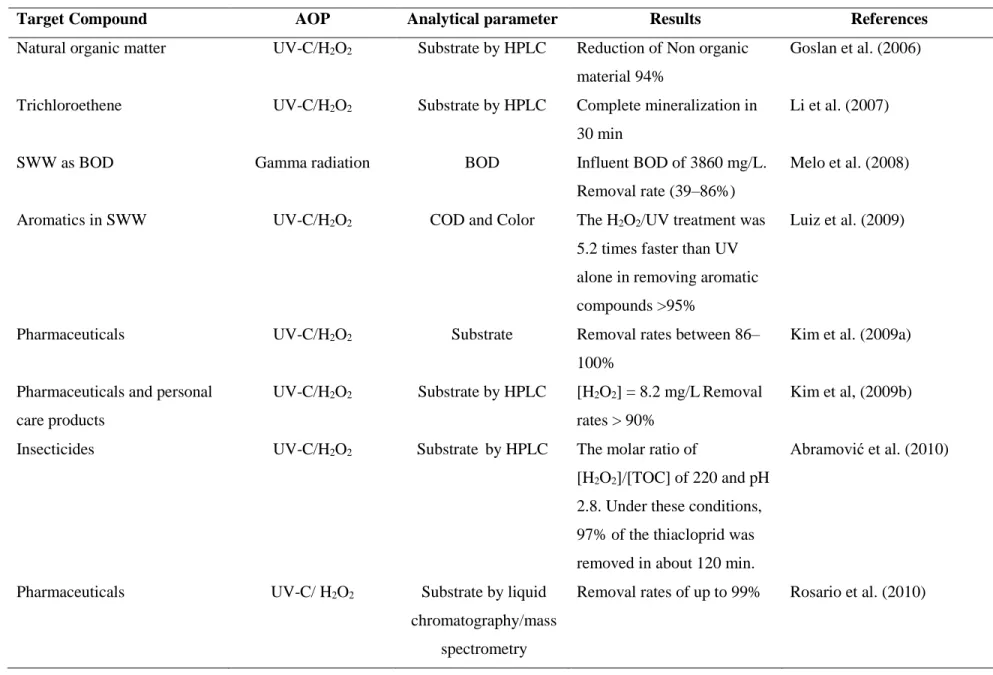
Similarly, compounds such as chloroform, trichloromethane, tetrachloromethane and methylene chloride as halogenated solvents used in the production of dyes, pharmaceuticals and plastics are highly toxic to bacteria used in wastewater treatment (Barrera et al., 2012). Aromatics in DHW UV-C/H2O2 COD and color The H2O2/UV treatment was 5.2 times faster than UV alone at removing aromatic compounds >95%.
Concluding remarks
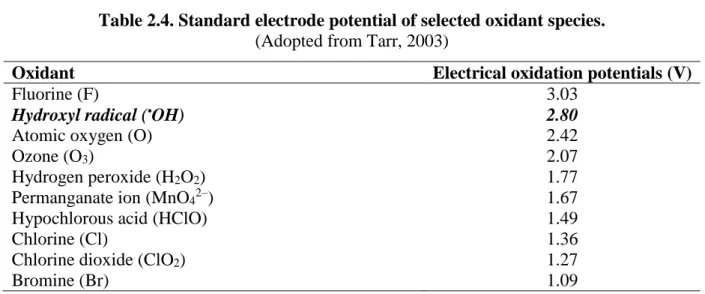
Although the production of VUV radiation is more expensive than UV-C radiation, the lighting industry is rapidly developing and producing new lamps that convert electrical energy to VUV with higher efficiency levels, thereby reducing costs (Bustillo-Lecompte et al., 2014). Bustillo-Lecompte and Mehrvar, 2015; Bustillo-Lecompte et al., 2016). As a result, VUV becomes one of the outstanding members of the group of AOPs that could produce the desired •OH in a facile manner and become a viable alternative to UV-C/H2O2. AOPs are used to oxidize and degrade organic and inorganic materials present in SWW through reactions with hydroxyl radicals (•OH).
Therefore, the VUV process can be used as a complementary step to UV-C/H2O2 to reduce H2O2. Thus, this study aims to fill the gap in the literature on the application of combined UV-C/H2O2/VUV systems as an alternative to the UV-C/H2O2 photolytic process for treating actual SWW in order to minimize H2O2 waste and maximize efficiency overall treatment (Barrera et al., 2012; Bustillo-Lecompte and Mehrvar, 2015; Bustillo-Lecompte et al., 2016).
MATERIALS AND METHODS
- Materials
- Actual slaughterhouse wastewater
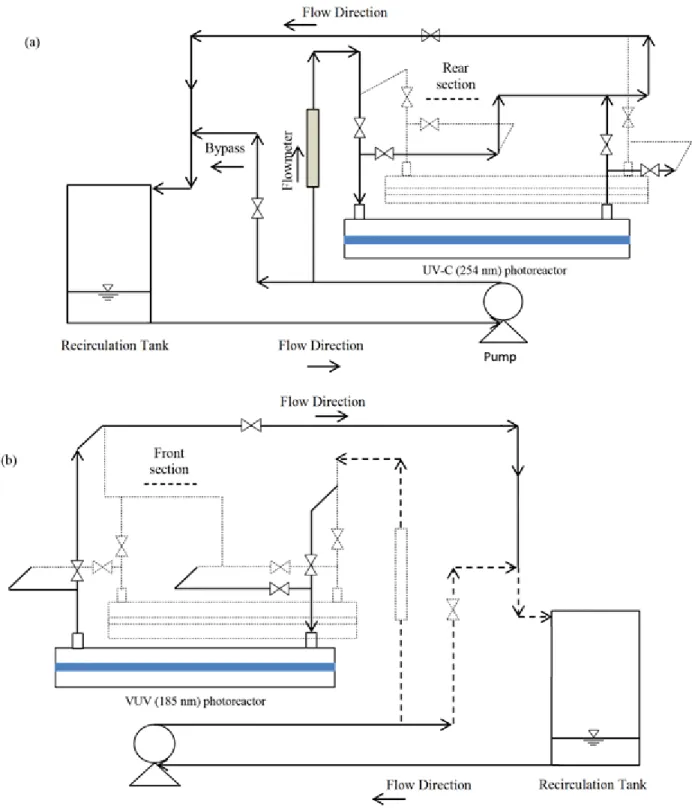
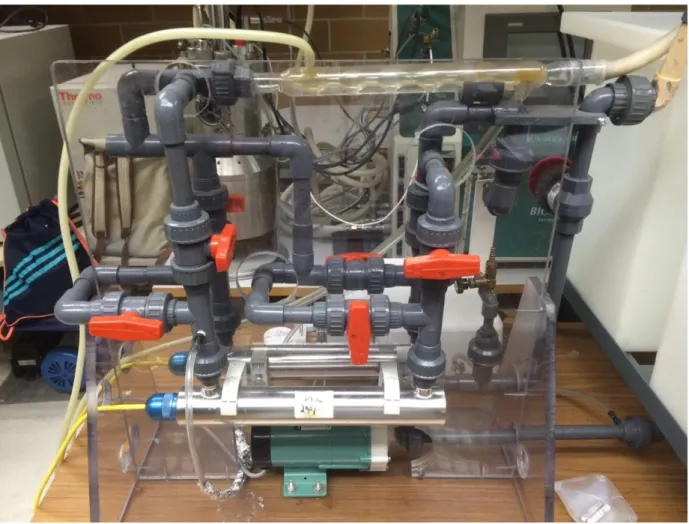
- Experimental setup
- Experimental procedure
- Analytical techniques
- Total organic carbon (TOC)
- Biochemical oxygen demand (BOD)
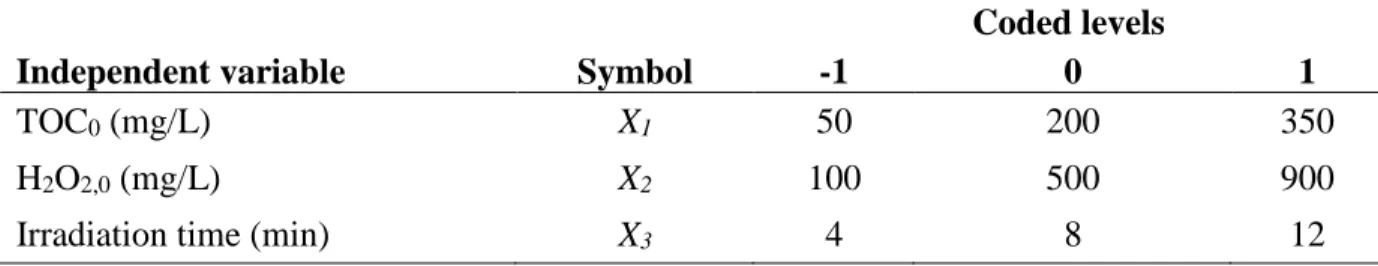
- Experimental design and optimization studies
- Box-Behnken design
- Multiple linear regression
- Combined UV-C/H 2 O 2 /VUV treatment of SWW
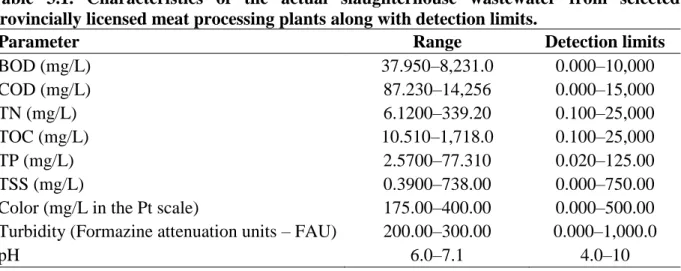
Characteristics of actual slaughterhouse wastewater from selected provincially licensed meat processing plants along with detection limits. Schematic diagram of the experimental setup for the combined UV-C and VUV photochemical processes (a) front view and (b) back view. A respirometer was used to measure the oxygen uptake of microorganisms in the SWW media.
Design-Expert 9.0.6.2 statistical software was used for DOE and coefficient estimation for each response function. Therefore, high values of R2 and R2adj that are very close to each other imply the significance of the regression.
RESULTS AND DISCUSSION
Introduction
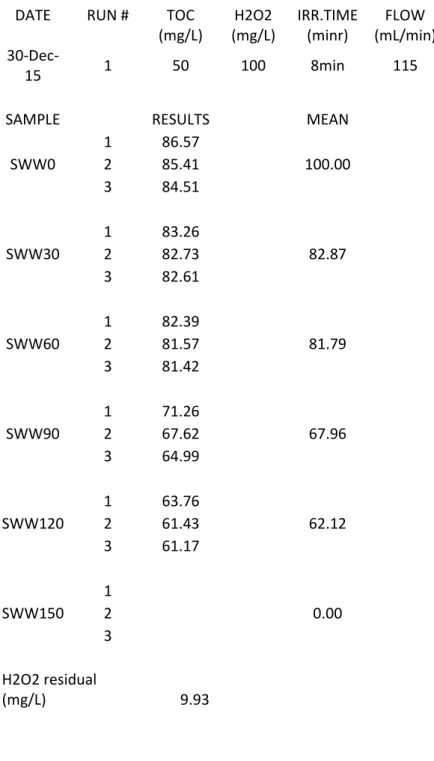
Preliminary experiments
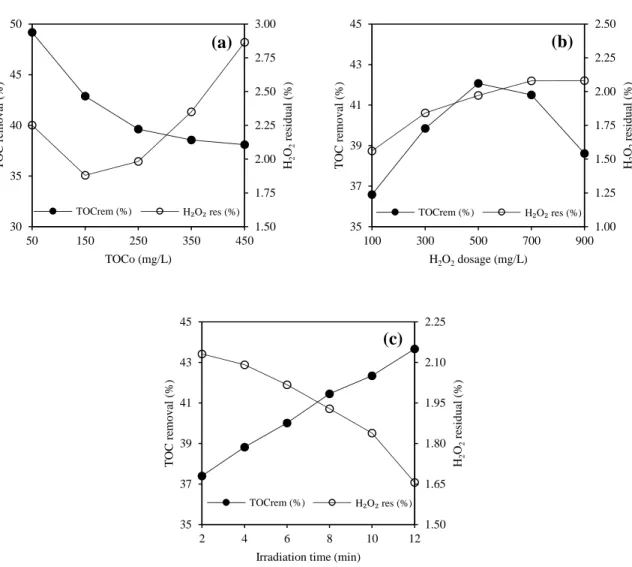
It can be observed that as the initial TOC concentration increases, the percentage of TOC removal decreases. The results show that by increasing the H2O2 concentration, the H2O2 residue also increases, while there is an optimal H2O2 concentration at which the percentage of TOC removal is maximum. Profiles of TOC removal and H2O2 residue in a laboratory scale batch recirculating UV-C/H2O2/VUV photoreactor for actual DHW treatment under different conditions of (a) initial TOC concentration, (b) initial H2O2 concentration , (c) and irradiation time.
Similarly, Figure 4.1c illustrates the effects of the irradiation time on both the percent TOC removal and the H2O2 residue. Results show that the TOC removal is directly proportional to the irradiation time while the H2O2 residue is inversely proportional to the irradiation time as established by the profile trends.
Experimental design and statistical analysis
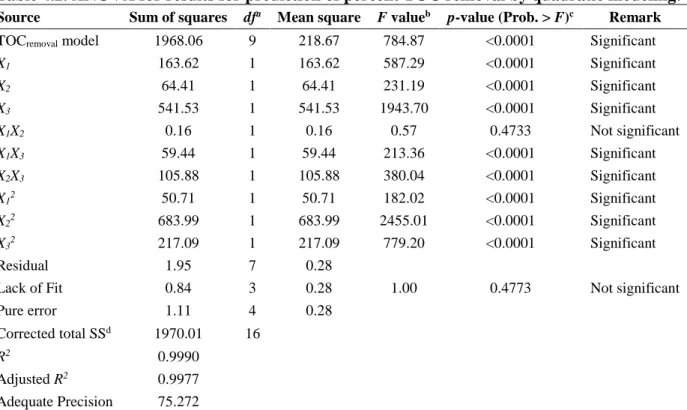
Thus, the following second-order polynomial equations (Equations (4.1) and (4.2) respectively) were developed in terms of coded factors to predict the response functions for TOC removal percentage (Y1) and residual H2O2 (Y2). Although this estimate provides a quick analysis in terms of parametric effect on the response variables, ANOVA with 95% CI was also used to assess the statistical significance of the developed quadratic models for percent TOC and H2O2 removal. Additionally, the conventional residual probability plot shown in Figures 4.2b and 4.3b for TOC removal and residual H2O2, respectively, showed a straight line pattern followed by points on the plot, not an S-shaped curve.
The correlation between observed and predicted values is presented in Figures 4.2c and 4.3c for TOC removal and residual H2O2, respectively. Therefore, the quadratic model predictions for both percent TOC removal and residual H2O2 responses are satisfactory.
Individual effect of model parameters
Model validation of percent TOC removal using different plots: (a) internally studied residuals versus predicted values, (b) normal probability, and (c) observed experimental data versus predicted values. Validation of the percent H2O2 residual model using different plots: (a) internally studentized residuals versus predicted values, (b) normal probability, and (c) observed experimental data versus predicted values. Figures 4.4a and 4.5a depict the effect of initial TOC concentration (X1) on TOC removal (Y1) and residual H2O2 (Y2), respectively.
Similarly, Figures 4.4c and 4.5c show the effect of the irradiation time (X3) on the percentage TOC removal (Y1) and the H2O2 residue (Y2), respectively. The results of the predicted model are consistent with the values of the preliminary results, confirming the accuracy of the predicted model for each parameter.

Interaction of model parameters, 2D contour plots, and 3D response surface
These figures are the graphical representations of the regression analysis, where the response functions of two factors are presented while all others are at the fixed levels (Bustillo-Lecompte et al., 2016). The effect of the initial TOC concentration on the percentage of TOC removal is essentially attributable to the absorption of the UV-C/VUV radiation by organic compounds together with intermediates formed during the photochemical reactions. Therefore, the interaction effect of the TOC concentration and the H2O2 (X1X2) defines an optimum concentration of the oxidant at a lower initial concentration of the TOC for the maximum TOC removal while a minimum H2O2 residue at a lower initial H2O2 is generated.
The surface plot of the interaction effect of initial TOC concentration with irradiation time (X1X3) on TOC removal is similar to that of X1X2 for the same response as confirmed by Figure 4.6b. The 3D plot confirms that the percentage of TOC removal is inversely proportional to the initial TOC concentration while there is an optimal irradiation time for maximum TOC removal at which the effect of further irradiation is negative due to the scavenging effect of hydroxyl radicals ( Bustillo-Lecompte et al., 2016).

Optimization of operating conditions and process parameters
The numerical optimization method explores the design space using the developed models to find the optimal factor ratios. The multiple response approach (Equation 3.3) was used to obtain the desirable 3D response surface (Figure 4.8) by maximizing the percentage removal of TOC (d1) and minimizing the H2O2 residue (d2) at optimal factor settings. Thus, the optimum conditions to achieve the maximum TOC removal of 46.19% and minimum H2O2 residual of 1.05% when treating actual SWW were: initial TOC concentration of 213.01 mg/L, initial H2O2 concentration of 450.71 mg/L and irradiation time of 9.06 min.
These results are promising for the application of the combined UV-C/H2O2/VUV system as a post-treatment method after biological treatment of a high strength real SWW. Comparison between combined UV-C/H2O2/VUV processes and individual processes Three individual processes, VUV alone, VUV/H2O2, and UV-C/H2O2, were evaluated to.
Comparison between combined UV-C/H 2 O 2 /VUV processes and individual processes
Desirability response surface, maximizing percent TOC removal and minimizing residual H2O2 at optimal factor settings: (a) initial TOC concentration and H2O2 interaction (X1X2) with optimal irradiation time (9.06 min), (b) initial. Comparison of TOC and residual H2O2 removal using different processes to treat actual slaughterhouse wastewater, including VUV alone, VUV/H2O2, UV-C/H2O2, and combined UV-C/H2O2/VUV processes. These results confirm that a suitable combination of UV-C/H2O2/VUV processes is essential for optimized removal of TOC and residual H2O2.

Biodegradability of the actual SWW using Respirometry assays
Results of respirometric testing for different samples of actual SWW, SWW treated with combined UV-C/H2O2/VUV processes and a blank sample.

CONCLUSIONS AND RECOMMENDATIONS
Conclusions
The developed mathematical models provided a detailed exploration of the simultaneous inter-factor interactive effects of the independent variables on the responses. Thus, the proposed models explaining the photochemical treatment of actual slaughterhouse wastewater by continuous UV-C/H2O2/VUV photoreactor can be used as a basis for future studies on process optimization, photoreactor design, modeling and scale-up. Actual SWW samples were used in this study to evaluate the precise performance of the combined UV-C/H2O2/VUV system under real conditions, which will allow further studies on kinetics modeling, scaling, and cost-effectiveness analysis .
However, due to the wide range of actual DHW concentrations, biological treatment should be considered before using the UV-C/H2O2/VUV system, especially at TOC concentrations higher than 350 mg/L. Therefore, considering the integration of biological treatment and AOPs could include on-site secondary and tertiary treatment to avoid inadequate DHW discharge to water bodies or groundwater, which is harmful to the environment.
Recommendations
TOC removal profile in a laboratory-scale batch recirculating UV-C/H2O2/VUV photoreactor for actual SWW treatment at different initial concentrations of TOC. Anatoxin-a degradation by advanced oxidation processes: Vacuum UV at 172 nm, photolysis using medium pressure UV and UV/H2O2. Photolytic treatment of organic constituents and bacterial pathogens in secondary wastewater from synthetic slaughterhouse wastewater.
Treatment of meat industry wastewater using dissolved air flotation and advanced oxidation processes, monitored by GC-MS and LC-MS. Evaluation of a field-scale UV/H2O2 oxidation system for the purification of PCE-contaminated groundwater. Performance of UV and UV/H2O2 processes for the removal of pharmaceutical substances detected in secondary effluent from a sewage treatment plant in Japan.
Study of the technical-economic analysis of the electrocoagulation process for the treatment of small cattle slaughterhouse wastewater.