92 Figure 5-19: A test comparing experimental validation data against the empirical model predicted force and torque using a feed rate of 2.0 mm/sec and a spindle speed of. The calibration and validation results of the empirical and neural network models for bovine bone drilling will be presented in Chapter 5.
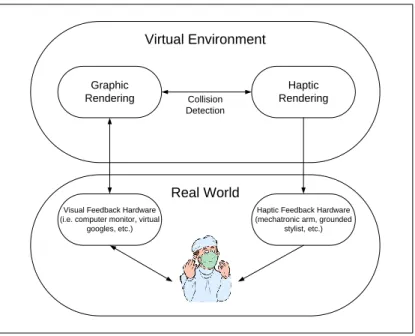
Orthopaedic Haptic Simulation Systems
An overview of current orthopedic haptic simulation systems was presented, including the general requirements and limitations of systems currently available. Finally, the latest force and torque models used in current orthopedic haptic simulation systems were investigated.
Geometric and Material Properties of Human Bone
Cortical Bone
To provide meaningful feedback, it is critical that the force prediction model providing the haptic response is accurate. The mechanical properties of elastic moduli, shear moduli, and Poisson's ratio of typical human cortical femur bone are presented in Tables 2-1, 2-2, and 2-3.
Cancellous Bone
Because cancellous bone is very heterogeneous, only certain mechanical and strength properties have been reported.
Mechanics of Drilling
In this image, a positive rake angle can be seen along the cutting lips towards the outer radius of the drill bit (view AA). As the cutting lips move toward the center of the drill, the rake angle becomes negative (view BB).
![Figure 2-5: Tool-to-workpiece interaction that occurs during an orthogonal cutting process [27]](https://thumb-us.123doks.com/thumbv2/9docorg/12433683.0/31.918.253.728.285.540/figure-tool-workpiece-interaction-occurs-orthogonal-cutting-process.webp)
Drill Thrust Force and Torque Prediction Modeling
This suggests that the cutting forces and torques remain constant throughout the cutting of the hole. On the other hand, cutting brittle materials generates discontinuous chips that tend to clump together in the grooves of the drill.
![Figure 2-7: a) Free body diagram of a drill tip displaying the tangential forces, b) Free body diagram of a drill tip displaying the perpendicular and ploughing forces, and c) Area of material contact when cutting [11]](https://thumb-us.123doks.com/thumbv2/9docorg/12433683.0/34.918.127.804.114.367/figure-diagram-displaying-tangential-displaying-perpendicular-ploughing-material.webp)
The Drilling of Bone
A selection of the results obtained is shown in Figure 2-11. From these figures, both the thrust force and the torque decrease significantly as the drill spindle speed increases. Experimental results showed a linear relationship between spindle speed and feed speed at two different locations of the bone (in the middle of the spindle and at the head of a femur bone) [31].
![Figure 2-9: Experimental results relating feed with a) thrust pressure, b) torque, and c) specific cutting energy using three different types of drill bits [9]](https://thumb-us.123doks.com/thumbv2/9docorg/12433683.0/38.918.138.810.369.808/figure-experimental-results-relating-pressure-specific-cutting-different.webp)
Force and Torque Prediction Modelling for Haptic Rendering
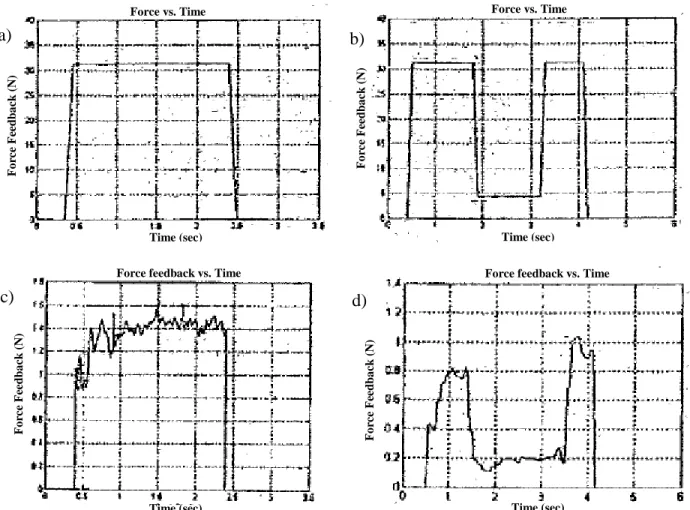
Force and torque increase approximately linearly as the tip of the drill bit is engaging the material. Once the drill tip is fully engaged in the material, both force and torque level off and become constant for the remainder of the drilling operation. Once the drill tip is fully engaged, the cutting force and torque remain constant over the remainder of the drill.
![Figure 2-15: Experimental results used to validate the proposed model at the exit of the cortical bone [12]](https://thumb-us.123doks.com/thumbv2/9docorg/12433683.0/44.918.253.659.375.707/figure-experimental-results-used-validate-proposed-model-cortical.webp)
Cutting Force and Torque Modeling
To provide an illustration of the effectiveness of these models, Figure 3-3 presents a comparative plot of the force formulation versus experimental data collected while drilling bovine bone. The obvious shortcoming of the model is not knowing the chip evacuation force due to the drill flute. To further emphasize this point, Figure 3-4 shows a clearer perspective of the same comparison this time showing a comparison of the force and torque experienced by the unicortical drill (albeit a single cortex).
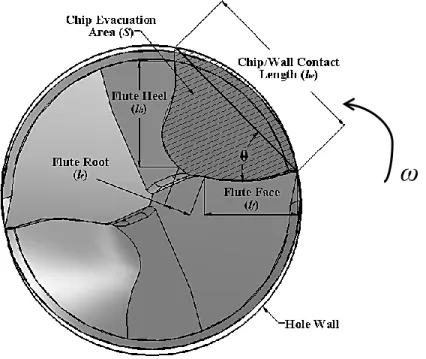
Chip-evacuation Force and Torque Modeling
Empirical Model
The frictional force Ffwi is due to the friction between the bone fragments and the wall of the hole. The frictional forces at the contact surfaces of the drill bit and the borehole wall will act in the opposite direction of the relative velocity. Chip removal torque is simply the product of the frictional force on the bore wall and the bit radius.
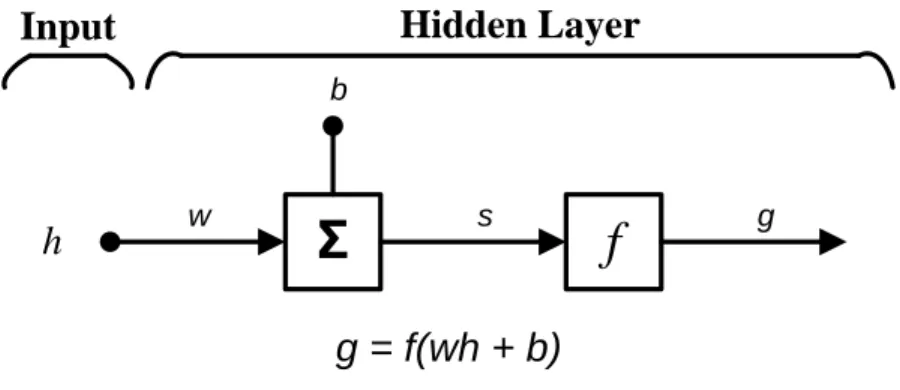
Artificial Neural Network
To properly substantiate the presented models, this section concludes with a list of the following assumptions: (1) the bone chips remain in constant contact with each other; (2) the evacuated material flows through and fills the drill groove; (3) the bone chips continuously exert pressure on the contact surfaces (i.e. the drill groove and the wall of the hole); (4) the helix angle of the drill is negligible; (5) the friction forces between the bone chips and their contact surfaces are proportional to their normal forces; and (6) the bone chips exhibit a non-isotropic stress distribution. The box with the f represents the transfer function chosen based on the application of the ANN. Typically, the amount of samples to be used for each training, validation, and test is determined based on a percentage of the total number of samples.
Finite Element Modeling
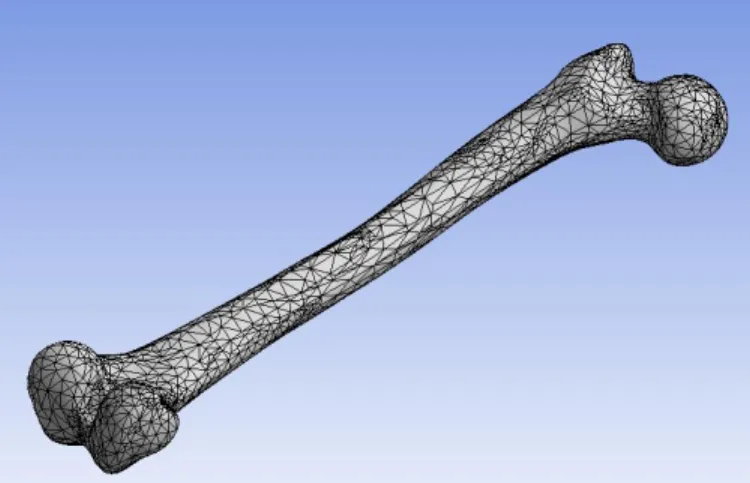
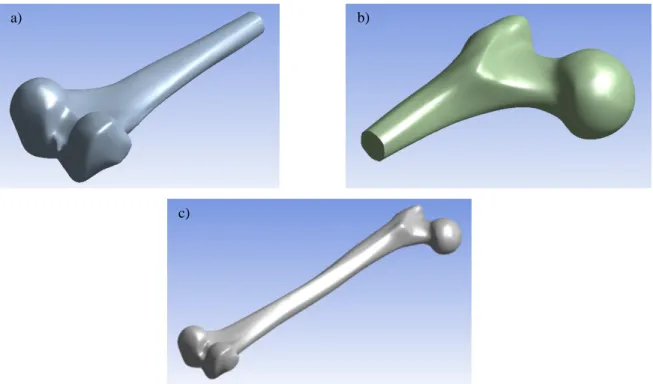
- Human Femur Bone Model Acquisition
- Boundary Conditions
- Load Application
- Meshing
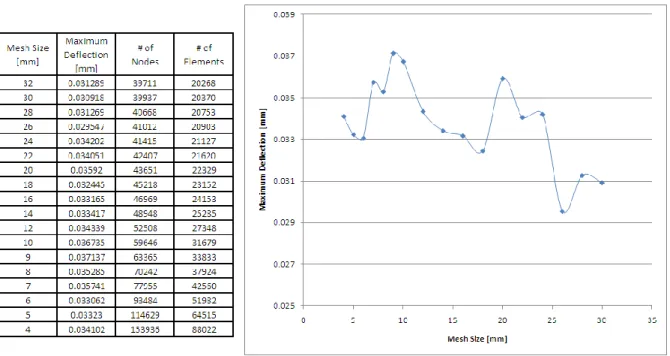
- Mesh Sensitivity Analysis
The second site of interest was at the proximal end of the bone (where the femur joins the hip). The final drill site examined is at the distal end of the femur (where the bone joins the knee). To perform a mesh sensitivity analysis, the femur was loaded with a realistic force and torque at the mid-diaphyseal point of the bone.
Design of Experiments
- Experiment Classification
- Experimental Procedure
- Model Parameter Definition
- Model Calibration Procedure
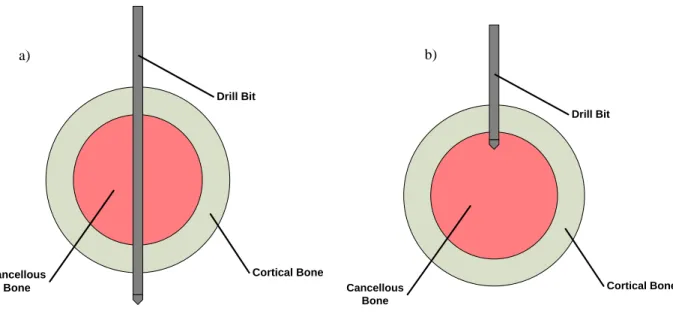
When the drill penetrates the cortical bone and enters the cancellous bone, stop the feed of the CNC machine. As can be seen above, the force and torque prediction models are both a function of the operating parameters of the drill; namely, they are a function of the spindle speed and feed rate of the drill. This involved an inspection of the geometry of the drill to determine the contact lengths and the area of the grooves of the drill.
Experimental Set-up
- CNC Drill
- Transducer and Data Acquisition
- Drill Bit
- Bone Specimen
Each of the drills used for experiments were unused and came directly from the manufacturer. A photo of one of the drills used for these experiments is shown in Figure 4-5. Figure 4-6 shows an image of one of the femur bone specimens loaded into the vise and ready for experimentation.

Drill Misalignment
This means that the axis of the bore path must be parallel to the z-axis of the sensor. Furthermore, these forces and torque would be due to the contributions of the cutting force and would actually reduce the force observed along the z-axis. Another misalignment problem that occurred was the misalignment of the drill path axis with the drill shaft axis.
Data Test for Normality
- Motivation and Procedure
- Data Collection
- Median Rank Test
- Chi Square Test
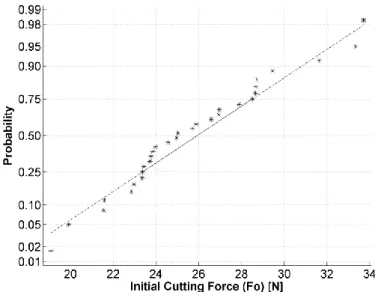
The result of the median ranking test for the initial cutting force is depicted in Figure 4-13. As with the test performed on the initial cutting force, this median rank test shows that the data are also trending. The Chi Square test is based on plotting the data in a histogram form.
Data Processing
Data Isolation
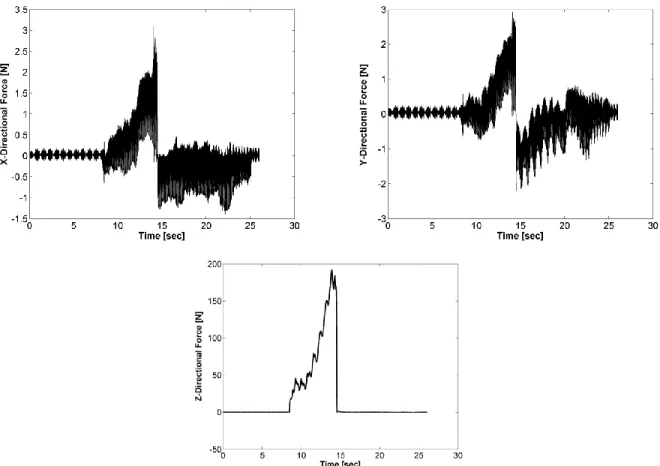
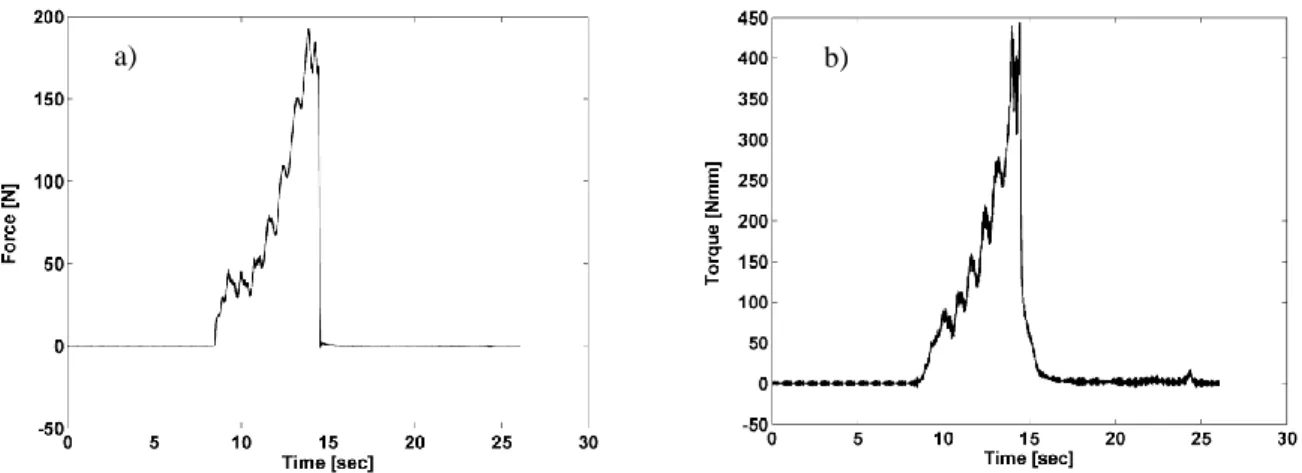
The second part of the data that is undesirable is the rapid increase in the cutting force and torque that is observed when the drill first engages the bone and continues until the initial cutting force is reached. This portion of the data is undesirable as prediction models for the initial cutting force are common in the literature and our model only attempted to predict the force and torque after the initial cutting force was reached. The last portion of the signal that is unwanted is the portion of data from when the drill breaks through the cortical bone until the data collection equipment is turned off.
Data Normalization
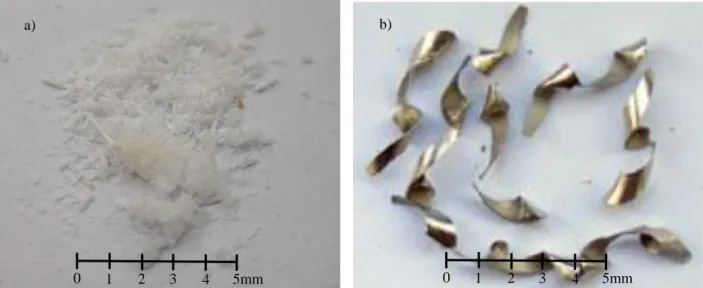
These three sections of data were removed manually, leaving only the drill clogging signal of interest.
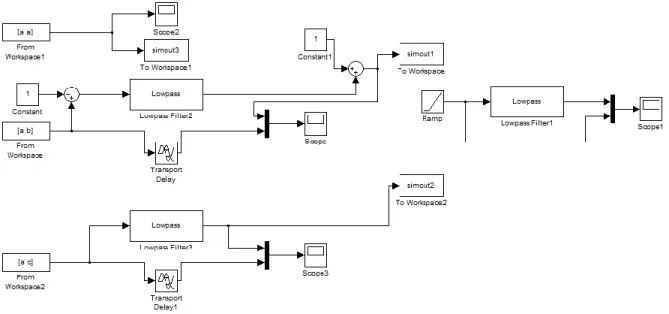
Data Filtering
In addition, a low-pass filter will also remove any of the high-frequency noise inherent in the data acquisition system. Tuning the low-pass filter required an examination of the data to determine the filter parameters; namely: the sampling frequency (fs), the pass frequency (fpass) and the stop frequency (fstop). The filter parameters needed to properly tune the low-pass filter were strictly dependent on the experimental conditions; specifically on the conditions of the experiment which are time dependent.
Empirical Chip-Evacuation Model Calibration
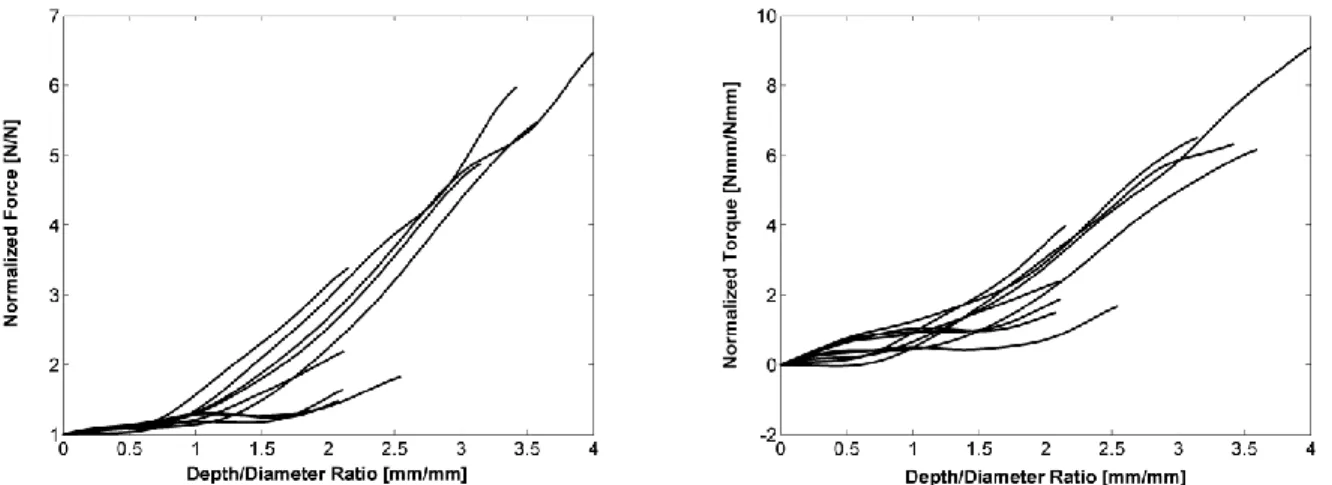
Since jamming is a function of hole depth, experiments performed on thinner areas of bone lacked increased force and torque due to the jamming effect. This involved comparing the experimentally obtained values with the empirical form of the force and torque prediction models using Eq. With the optimized friction coefficients determined for all data sets, the next step was to determine the power law coefficients.
Empirical Chip-Evacuation Model Validation
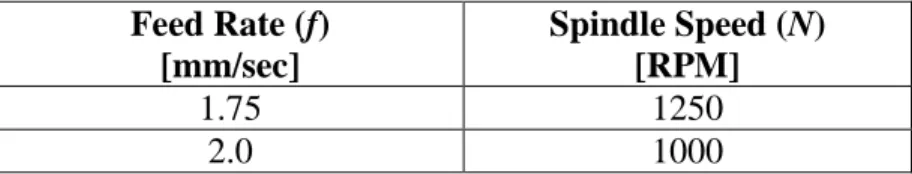
Figures 5-3 and 5-4 show the thrust and torque using a feed rate of 1.75mm/sec and a spindle speed of 1250RPM for each of the two tests. Figures 5-5 and 5-6 show the thrust force and torque using a feed rate of 2.0mm/sec and a spindle speed of 1000RPM for each of the two trials. Also in each figure is the respective empirical model's prediction of the chip evacuation force and torque based on the operating parameters.
Empirical Chip-Evacuation Model Sensitivity Analysis
This is due to the force caused by μw acting perpendicular to the thrust and adding only a marginal effect to the total force. This can be explained by observing that the effect of μw occurs at the radius of the drill, where an increasing resistance at the contact between material accumulation in the groove and the wall of the hole is in the opposite direction to the rotation of the drill. . Furthermore, as discussed, the effect of μf acts perpendicular to the drilling surface and thus has a reduced effect on drilling torque.
Artificial Neural Network Training
Network Neuron Sensitivity Analysis
In general, increasing the number of neurons in the hidden layer increases the flexibility and processing power of the system. It is therefore important to determine the optimal number of hidden layer neurons that will be used by the network. The first step in this analysis was to select the range of hidden layer neurons to use to determine the sensitivity of the network.
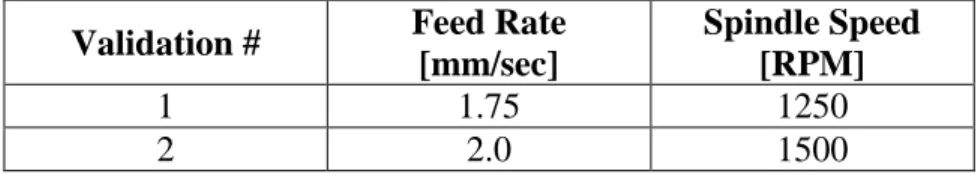
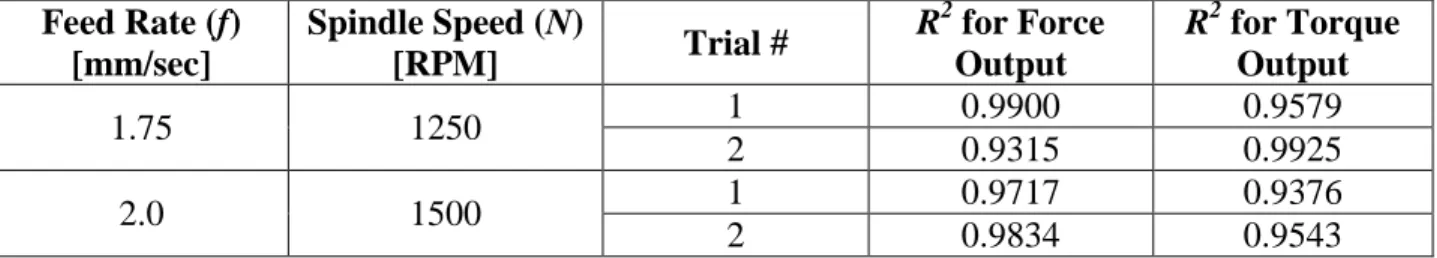
Artificial Neural Network Validation
The newly obtained data were processed and plotted against the predicted chip evacuation force and grid torque output. As can be seen in Figures 5-14 to 5-17, the two-neuron artificial neural network predicts the chip evacuation thrust force and torque for drilling the bovine bone well. Based on the relatively high R-squared values shown in Table 5-8, it can be concluded that the output obtained for the two-neuron artificial neural network is acceptable to estimate the increased thrust force and torque experienced during drilling of beef bone.
Empirical Chip-Evacuation Model Calibration – Human Bone Drilling
As can be seen for Figures C-6 to C-10 of Appendix C, the experimental data collected for the chip evacuation force and torque for drilling human bone showed much greater variation than the data collected for the drill from beef bone. There are some trends that are similar to the trends seen in beef bone drilling. In addition, as seen when drilling beef bone, as the feed rate increased while the spindle speed remained constant, the coefficient of friction between the drill flute and the bone chip, μf, increased.
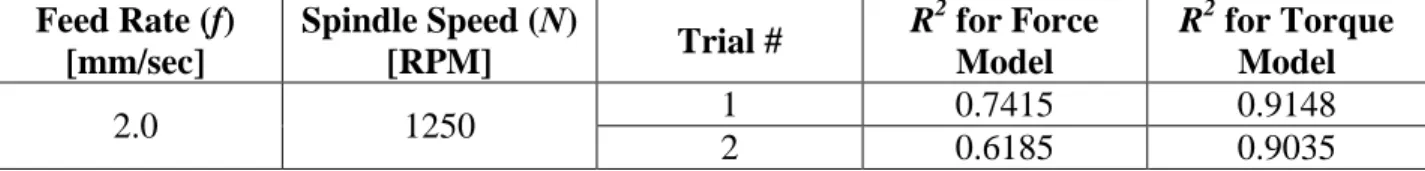
Empirical Chip-Evacuation Model Validation – Human Bone Drilling
As was done with the validation for drilling bovine bone, the accuracy of the results for drilling human bone can be measured by calculating the coefficient of determination. This discrepancy can be attributed to the variation in material properties of the bones used for calibration and validation. This greatly affects the consistency of the compressive force, as softer bones would require less force, while harder bones would require more force.
Comparison of Results
Empirical Model versus Artificial Neural Network
Drilling of Bovine Bone versus Drilling of Human Bone
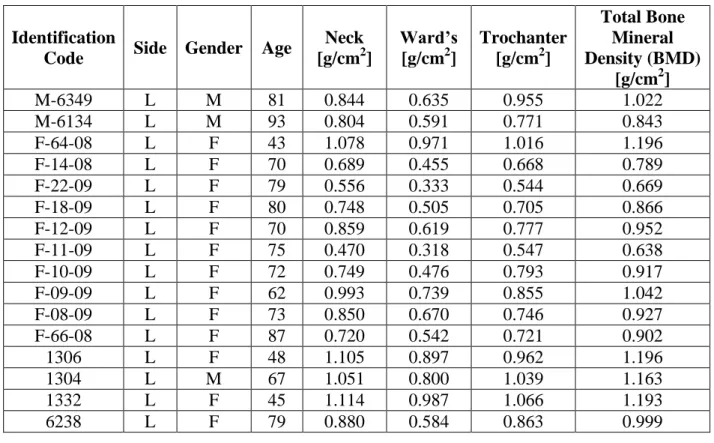
As mentioned previously, the relatively poor correlation for the human bone model validation and the large variation in the friction coefficient, μw, can be attributed to the inconsistencies in material properties of the human bone specimens. The donors of the femur bones used for calibration and validation experiments varied between men and women and had a wide range in age. For this reason, it can be concluded that although the presented models adequately predict the tension force and torque experience during drilling of human bone, experiments performed on specimens of the same sex and of similar age would have provided much more accuracy. Results.
Empirical Model Comparisons to the Literature
This resulted in a large disparity in bone strength and hardness between the samples, which was not present in the experiments where bovine bone was drilled.
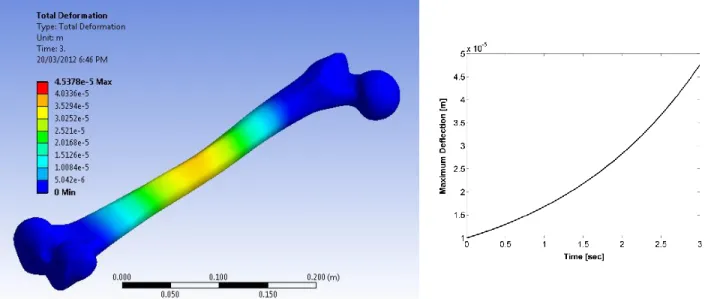
Empirical Model Implementation into FEA Simulation
FEA Simulation Solution and Post-Processing
Also depicted in this figure is a plot showing the maximum deflection as a function of time. The results indicate that the maximum deflection experienced by the bone as a result of dynamic loading is more than 4 times the deflection resulting from static loading. The maximum deflections for the three locations using the two models are shown in Table 5-14.
Summary of Contributions
Concluding Remarks
A comparison was made between the empirical model for drilling bovine bone with two models from the literature. These results were compared with those obtained using one of the static models from the literature. It was found that the deflection and equivalent stress were almost five times greater when the dynamic loading of the presented models was applied.
Future Work
It was concluded that the established models were acceptable for predicting the chip evacuation force and torque for drilling human bone, but more accurate results could be obtained if greater control over biological variations of specimens was used. This comparison showed that none of the formulations taken from the literature were able to accurately predict the experimental thrust force. Handbook of Fractures: 3rd Ed. evaluation of the less invasive stabilization system for the internal fixation of distal femur fractures.
![Figure 2-13: Experimental results indicating the three way relationship between spindle speed, thrust force, and power consumption [32]](https://thumb-us.123doks.com/thumbv2/9docorg/12433683.0/42.918.266.653.116.366/figure-experimental-results-indicating-relationship-spindle-thrust-consumption.webp)
![Figure 2-14: Pictorial representation of formulation parameters; a) infinitesimally small bone layer thickness, dx; b) material transition [12]](https://thumb-us.123doks.com/thumbv2/9docorg/12433683.0/43.918.263.663.108.379/pictorial-representation-formulation-parameters-infinitesimally-thickness-material-transition.webp)