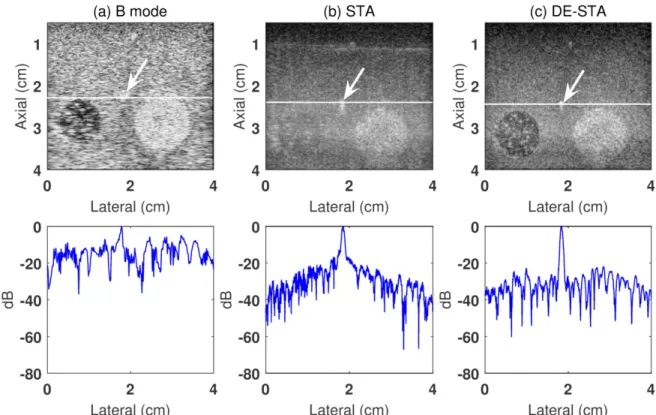
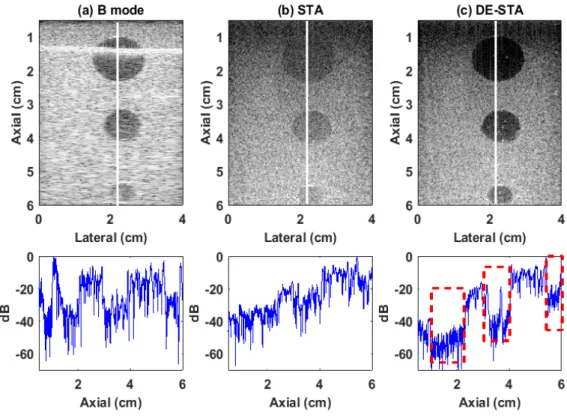
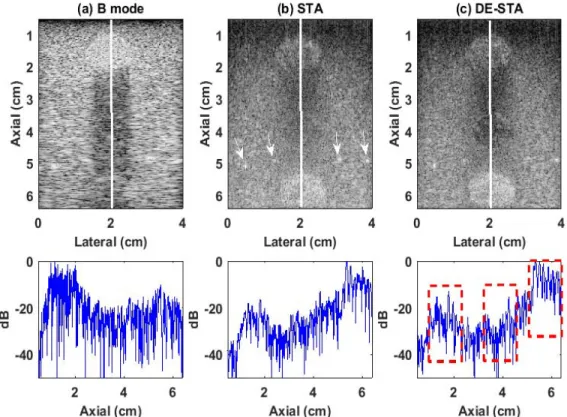
PSNR and FWHM of the point target and CNR of the hyperechoic inclusion in conventional B-mode, traditional STA and DE-STA images, respectively, in Figures 2-6. Three dashed squares on the axial line plot in (c) indicate the position of the three hypo-inclusions.
Introduction
- Motivation
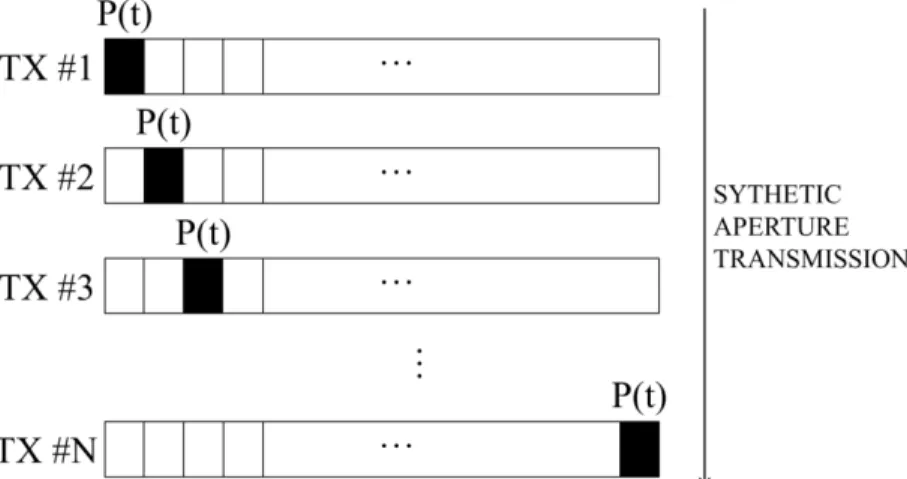
- Principle of Synthetic Transmit Aperture (STA) Imaging
- Single Element Transmission pattern
- Delay-and-Sum Reconstruction
- Dynamic Apodization
- Image Assessment (Quality metrics)
- Signal-to-Noise Ratio of Backscattered RF signals ( SNR ) .................................. 7 dB
- Speckle Signal-to-Noise Ratio (sSNR)
- Lateral and Axial resolutions
- Contrast-to-Noise Ratio (CNR)
- Lesion Signal-to-Noise Ratio (lSNR)
- Clutter-energy-to-total-energy ratio (CTR)
- Goals and Specific Aims
- Overview of the Dissertation
Speckle SNR measures the fluctuations of the speckle pattern in the background, which is calculated as. The same 2D aperture domain filter design was used as in the FSC technique.
Delay-encoded Transmission and Image Reconstruction Method in Synthetic
Abstract
The results from both the simulations and experiments showed increased SNR for pre-beamformed RF signals and improved image quality in terms of peak signal-to-noise ratio (PSNR), resolution, and contrast-to-noise ratio (CNR) compared to traditional STA. The lateral resolution (as assessed by a lead target) of DE-STA imaging was improved by 28% and the PSNR of the lead was increased by 7 dB, respectively, compared to traditional STA imaging.
Introduction
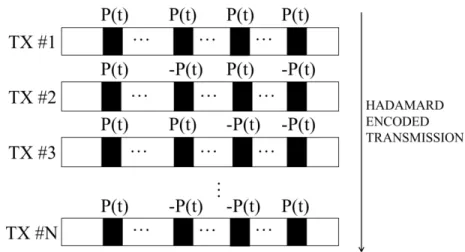
In many commercial scanners, the various array probe elements are driven by the same pulse sequence in a stream, and only the timing or delay of the pulse sequence can be controlled/set for each individual element. Spatial coding proposed by Chiao et al [28] requires that the different probe elements of the array are driven by two opposite-phase waveforms in a stream.
Methods
- Theory of DE-STA imaging
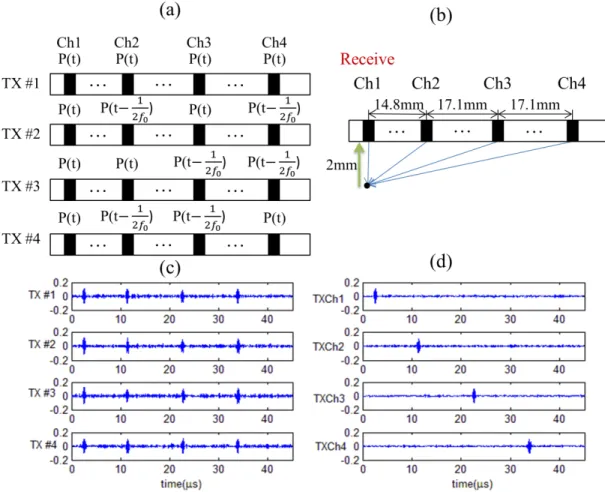
- Application to Ultrasound Imaging: DE-STA
Simulation and experiment results are presented and possible improvement of the DE-STA method is discussed. the same corresponding delay. To generate the DE-STA signals in the lth transmission (l=1-128), a half-period delay (100 ns) was applied to the traditional STA RF signals corresponding to the transmission channels to be delayed according to row l of the matrix of delay T.
Results
- Simulation Results
- Experimental Results
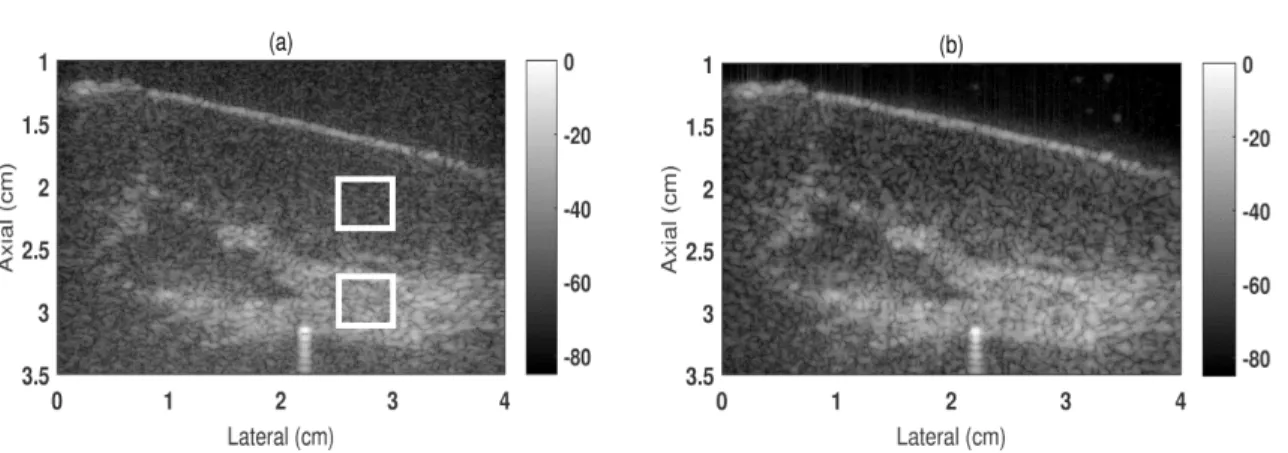
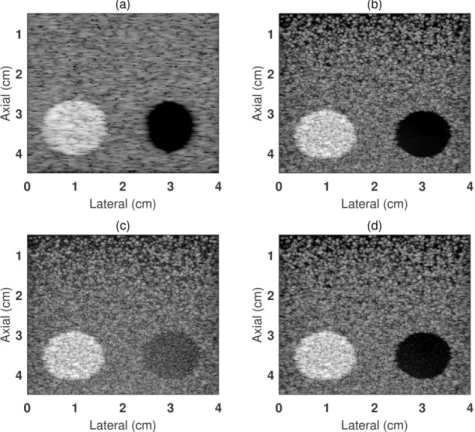
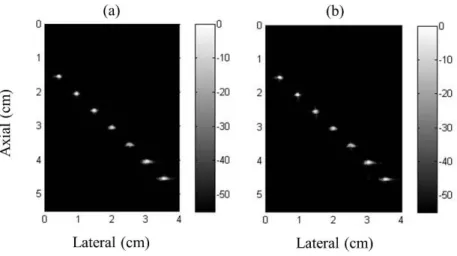
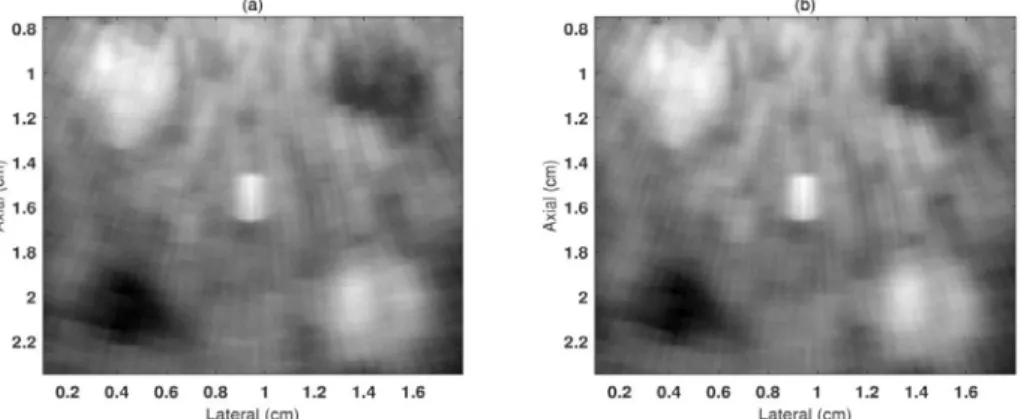
The DE-STA image (d) also matches well with the corresponding B-mode image (a) and the STA image (b) without adding noise to the RF data. Experimental log-envelope beam images acquired in (a) B-mode imaging, (b) traditional STA imaging, and (c) DE-STA imaging. Experimental log-envelope beam images acquired in (a) B-mode imaging, (b) traditional STA imaging, and (c) DE-STA imaging.
Discussion
These improvements are due to the fact that DE-STA imaging can increase the SNR of pre-beamformed RF signals through multi-element transmission to achieve the highest potential spatial resolution in traditional STA imaging. DE-STA imaging has also been shown to be the least sensitive to the shadow effect (Figure 2-8). Therefore, future work may focus on optimizing DE-STA imaging to speed up the decoding process and image reconstruction.
Conclusion
Since there are several other approaches to improve the SNR of the pre-beamformed RF signals by using multi-element transmission, it would be an interesting future study to compare the performance of these approaches and B-mode with DE-STA on a systematic way.
Pseudo-Inverse (PI) Decoding process in Delay-encoded Synthetic Transmit
Abstract
CPI and TPI can restore the signals stably, and the noise has mainly affected the preformed signals corresponding to the first transmission channel. The difference in overall image qualities of wrapped beam images between CPI and TPI was negligible. Also, according to the special distribution of the singular values of the coding matrix, we proposed a new efficient decoding formula which was based on the conjugate transposition of the coding matrix.
Introduction
As a result, the direct inversion of the coding matrix may be unstable in the DE-STA decoding process. In such cases, a pseudo-inverse is commonly used instead of direct inverse of the matrix A. The difference in the overall image qualities of the enveloped ray images between the direct and pseudo-inverse was negligible.
Methods
- Pseudo-Inverse (PI) in DE-STA Imaging
- Application to Ultrasound Imaging: Pseudo-DE-STA
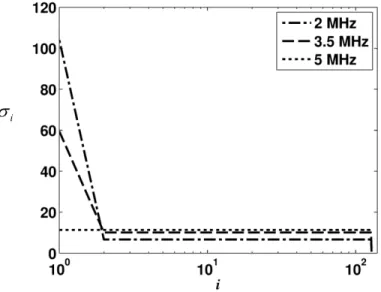
We also applied singular value decomposition (SVD) to the coding matrix to study the properties of singular values and singular vectors of the matrix. Based on the SVD results, an efficient decoding method is derived to reduce the computational complexity of the decoding process. In Results Section 3.4, we first studied the singular values and singular vectors of the DE-STA encoding matrix and derived a method to decode the STA data.
Results
- Singular Values and the Singular Vectors Study
- Simulation Results
- Experimental Results
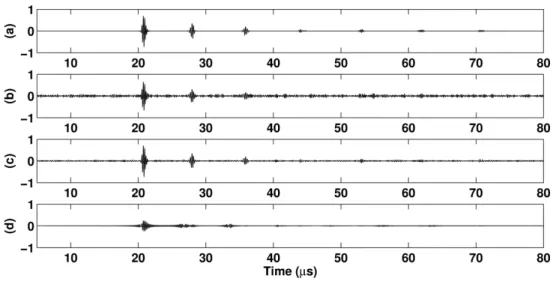
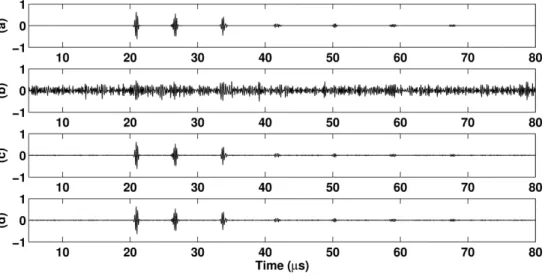
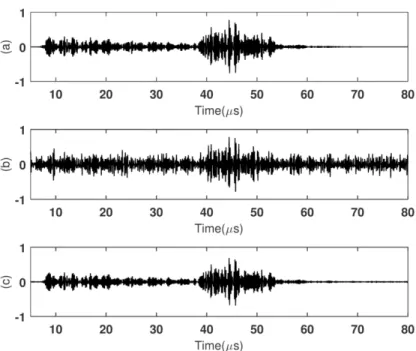
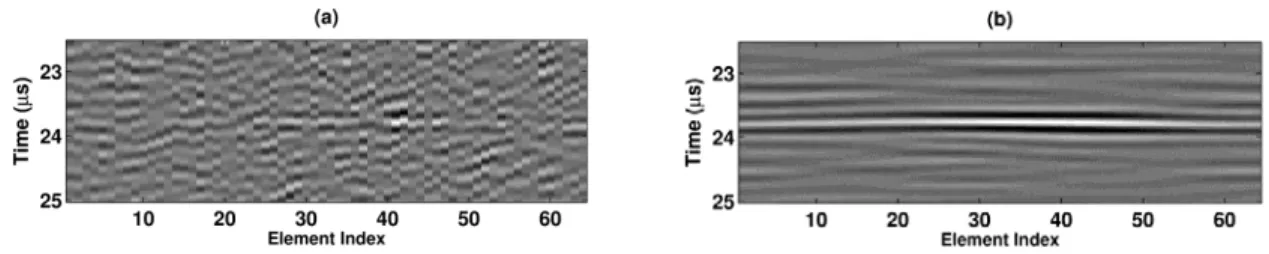
Pre-beamformed RF signals received by the 30th receiving element at the transmission of the 30th element from 4 different cases: (a) standard STA signal without noise, (b) standard STA signal with 0 dB additive bandpass noise , reconstructed DESTA signal after applying (c) CPI and (d) TPI to the RF data with . Pre-beamformed RF signals received by the 30th receiving element at the transmission of the 1st element from 4 different cases: (a) standard STA signal without noise, (b) standard STA signal with 0 dB additive bandpass noise , reconstructed DESTA signal after applying (c) CPI and (d) TPI to the RF data with . Pre-beamformed RF signals received by the 30th receiving element at the transmission of the 30th element from 4 different cases: (a) standard STA signal without noise, (b) standard STA signal with -10 dB additive band -passed noise, recovered DE -STA signal after applying (c) CPI and (d) TPI to the RF data with.
Discussion
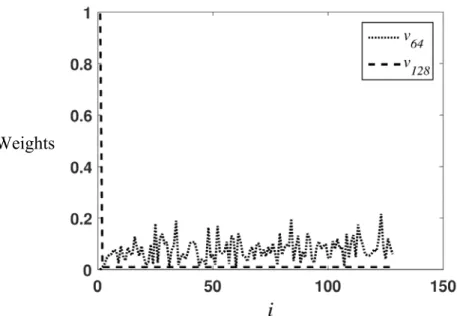
The index of the horizontal axis, i, is the index of the transmitting elements in the vector v128 and v64. To estimate the computational complexity, we estimate the number order of multiplication and addition in the decoding processes. For simplicity, we assume that the number of transmitters and receivers is the same as R, (I K R), the rank of the coding matrix.
Conclusion
The efficiency improvement is important since the decoding matrix is frequency dependent which involves heavy computational load (eg to generate Figure 3-8 more than 300 decoding matrices are needed). 3-8 or 3-9 may also provide the opportunity to implement the decoding through hardware, which will further improve the speed of the decoding process.
Image Reconstruction by Filtered Spatial Compounding (FSC) in Synthetic
Abstract
Image quality is improved in terms of the target CNR and lSNR (maximum improved by 110% in simulation). The effects of the filter bandwidth, additive noise and apodization on the performance of FSC were also investigated. Finally, we showed that some other image reconstruction methods, such as DAS, conventional spatial compositing (CSC), and sub-aperture compositing, can be considered as special cases of FSC with different choices of filter parameters.
Introduction
Spatial compounding has also been applied to synthetic transmit aperture (STA) imaging [2] and is called Synthetic Aperture Compounding (SAC). This technique performs compounding by manipulating the transmit and receive apodizations applied to a convex array. In this chapter, we propose a new spatial compounding technique that applies a 2D aperture domain filter to standard STA signals and is called filtered spatial compounding (FSC).
Methods
- Filtered Spatial Compounding (FSC) in Synthetic Transmit Aperture (STA)
- Application to Ultrasound Imaging: FSC
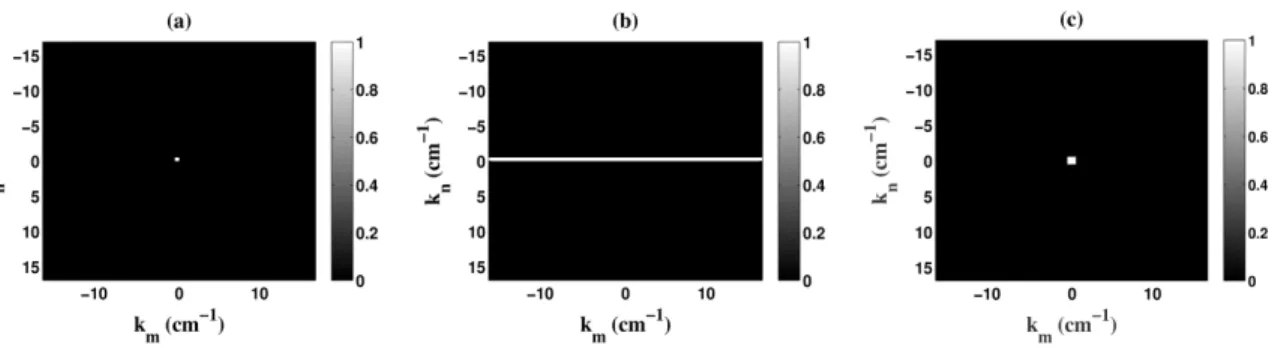
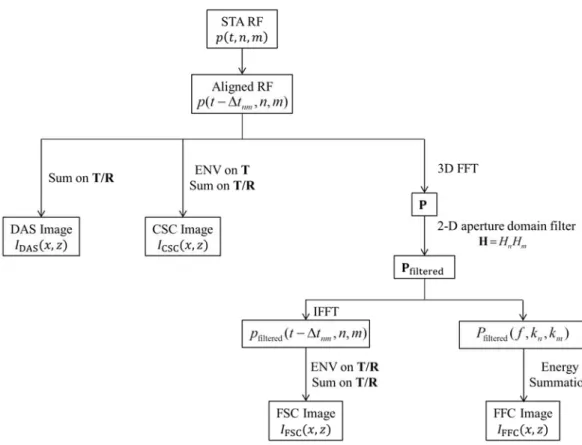
This coherent summation of signals on the axis is constructive and leads to the value of the focus point in the image. The different spatial orientation of signals from on- and off-axis objects can be characterized as different spatial frequencies after applying a Fourier Transform (FT) on the T/R opening directions of the 3-D data matrix. Therefore, in the FSC technique, before the incoherent summations over the T/R aperture directions, we implement a 2-D aperture domain filter to the 3-D Fourier transform of the aligned RF data over the T/R aperture domains to remove off-axis signals as shown in Figure 4-2 (b).
Results
- Simulation Results
- Stability against Noise
- Experimental Results
To evaluate the effect of the Hanning window selection, both simulated point targets and speckle-generating phantoms were investigated. As the Hanning window size increased, the lateral resolutions (FWHM) of FSC images degraded. From the simulation results of the point target phantom, a small Hanning window size is preferred.
Discussion
- Computational efficiency of Post-Processing in FSC technique
- Aperture Domain Filter: An Unified Framework for Various Beamformers
- Lateral Resolution
- lSNR Improvement
Note that when there is only a DC component in the aperture domain (kmkn 0), the signal p(ttnm,n,m) are all the same at time (ttnm) for any combination of ( m,n), so that coherent and incoherent summations are equal. H with a cutoff frequency of 2.6 cm-1 provides a sub-aperture of 30 elements, shown as a shaded area in the upper left corner of Figure 4-17. Based on the discussion above, the active sub-aperture to beam each sub-image in FSC was almost the entire array corresponding to the 1.0 cm-1.
Conclusion
Image Reconstruction by Filtered Frequency Compounding (FFC) in
Abstract
Despite this, FFC offered a large improvement of CNR, resulting in significantly improved target lSNR, up to 130%, compared to that in the standard delay-and-sum (DAS) method. The effects of the filter bandwidth, the window length applied to the radio frequency (RF) signal and the frequency domain normalization on the performance of FFC were investigated. Finally, we demonstrated that FFC is a combination of both spatial and frequency composition in which each sub-image is acquired using a sub-aperture in the transmit-receive aperture domain and a sub-band in the temporal frequency domain of a complete STA data set.
Introduction
In this chapter, we describe the technique called filtered frequency compounding (FFC) for synthetic transmission aperture (STA) image data [2]. Consequently, the enhancement of speckle SNR and image contrast-to-noise ratio (CNR) is a combination of both spatial and frequency compounding processes. However, the combination of both spatial and frequency compounding in the proposed FFC technique extends the trade-off between resolution loss and CNR improvement, resulting in significantly improved target lSNR in FFC images.
Methods
- Filtered Frequency Compounding (FFC) in Synthetic Transmit Aperture (STA)
- Application to Ultrasound Imaging: FFC
In section 5.5 we explain the reasons for the lateral and axial resolution loss in the FFC method. The simulated phantom shown in Figure 4-9 was tested with FFC using the Field II program. The STA signals obtained from the same phantom shown in Figure 4-13 were reconstructed using the FFC method.
Results
- Hanning window and RF window Selection
- Simulation Results
- Experimental Results
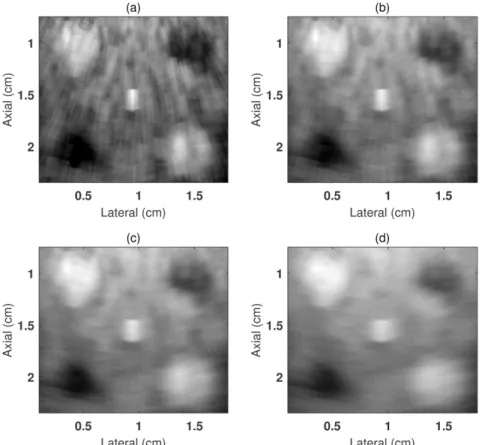
Quantification of sSNR, resolutions, CNR, and lSNR values of tissue-mimicking phantom images (Figures 5-6) obtained by (a) DAS, (b) CSC, (c) FSC, and (d) FFC, respectively. X-ray images of the experimental gel phantom reconstructed with (a) DAS, (b) CSC (c) FSC and (d) FFC, respectively. Quantification of sSNR, resolutions, CNR and lSNR values of experimental gel phantom images (Figures 5-8) obtained by (a) DAS, (b) CSC, (c) FSC and (d) FFC, respectively.
Discussion
- Normalization Effect
- Lateral Resolution Loss
- Axial Resolution Loss
- Relationship between FFC and CFC
- CNR and sSNR Improvement
W(f) is the subband filter and fn is the center frequency of the nth subband. Considering the convolution property of the Fourier Transform, the convolution of the subband filter W(fn) with the RF spectrum P(fn) in Eq. From the derivation, the frequency composite part in FFC is equivalent to CFC with the subband scanning through the frequency spectrum with a step size of 1/T, where T is the length of the windowed RF data.
Conclusion
In addition to spatial binning in FSC, we now show that FFC is equivalent to subband frequency binning by translating the subbands along the frequency spectrum by one frequency interval (or the inverse of the time domain data length). on the entire STA data set. Spatial binning occurred during filtering in the aperture domain, while frequency binning was performed during energy summation of the windowed RF signals. Image post-processing methods such as deconvolution can be considered to reduce future resolution loss. especially for low-contrast targets) as a result of combining spatial and frequency compositing.
Conclusions and Future Work
Summary and Conclusions
The stability of the proposed DE-STA technique was verified in Chapter 3 through a Singular Value Decomposition (SVD) study of the encoding matrix. In Chapters 4 and 5, we proposed two binning techniques, named filtered spatial binning (FSC) and filtered frequency binning (FFC), to reduce speckle variation and improve lSNR in ultrasound imaging. However, the CNR improvement of FFC was more significant compared to that of FSC alone due to the joint effect of SC and FC.
Future Work
- Decoding Scheme Extension
- Reducing Post-Processing time
- Phase Aberration Correction
Trahey, "Synthetic Aperture Focusing for Short-Lag Spatial Coherence Imaging," IEEE Transactions on Ultrasonics Ferroelectrics and Frequency Control, vol. Jensen, "Compounding in Synthetic Aperture Imaging," IEEE Transactions on Ultrasonics Ferroelectrics and Frequency Control, vol. Zemp, "S-Sequence Spatally-Encoded Synthetic Aperture Ultrasound Imaging," IEEE Transactions on Ultrasonics Ferroelectrics and Frequency Control, vol.