Due to the timing of approval of the new service, Regional Velstand projects a profit of The expected operating income is expected to be above budgeted levels by approx. $6.3 million due to higher than expected waste flows.
MVRD Requisition and Levies / Total Revenue
These reports are intended to help demonstrate the financial ability of Metro Vancouver Districts to continue providing services to the region on a sustainable basis. This involves evaluating a number of factors, including the ongoing ability to ensure that revenues meet expenses, the ability to meet debt obligations, and the flexibility to address unexpected situations.
Operating Reserves/ Total Revenues
Total MVRD Requisition, Water, Sewer and Solid Waste Charges / Per Capita
Capital expenditures for solid waste management services were $12.6 million through the end of August, compared to a pro rata capital budget of $59.5 million. As of August 31, 2019, Metro Vancouver's capital expenditures were approximately $310.9 million, or 50.0%, of the pro rata capital budget.
Metro Vancouver
ATTACHMENT 2
Lions Gate Sludge Thickness No. 1) The project will end with budget savings due to competitive pricing. 2020 project budget update proposal to transfer $2.7 million to the Central Park WPS Starters Replacement.
Capital Project Status Information – Liquid Waste Services August 31, 2019
ATTACHMENT 3
FSA – Sapperton Pump Station – The construction contract was awarded in September 2016 and is expected to be substantially completed in 2020. FSA – Sperling Pump Station – The Sperling Pump Station Upgrading Project includes the modernization and expansion of the existing outdated and undercapacity facility.
Capital Project Status Information – Solid Waste Services August 31, 2019
1 – Seismic Upgrade and Upgrades (Non-Seismic) – The key components of the seismic upgrade work are exterior shear walls, replacement of existing roof slab and thickening of perimeter walls and footings. Coquitlam Intake Tower Seismic Upgrade - The Coquitlam Intake Tower is located in the southeast corner of Coquitlam Lake.
ON TABLE REPLACEMENT ATTACHMENT 4
Tender/Contract Award Information – June 2019 to August 2019 Performance and Audit Committee Regular Meeting Date: October 10, 2019 Page 5 of 6. Tender/Contract Award Information – June 2019 to August 2019 Performance and Audit Committee Regular Meeting Date: October 10, 2019 Page 6 of 6 .
Appendix A
The award was given to the highest ranked proposer based on the evaluation criteria set out in the RFP. Proposers were invited by Metro Vancouver and BC Bid websites and private invitations on March 27, 2019. The award was given to the highest ranked and lowest cost proponent based on the evaluation criteria set out in the RFP.
The estimated amount is a combination of the successful contractors' proposed price of $553,737 (net of tax) and an additional $43,329 (net of tax) to account for the anticipated longer construction period (Phase 3) identified during negotiations as permitted in the RFP. . Bidders were invited via the Metro Vancouver and BC Bid websites and a private invitation on March 1, 2019. 34,234 (excluding taxes) to respond to issues identified during negotiations as permitted in the RFP.
Award was made to the proponent with the highest ranking and the lowest cost based on the evaluation criteria established in the RFP.
Appendix B
The award of Phases A and B (Preliminary and Detailed Design) and subsequent approved change orders issued during Phases A and B increased the contract value to $492,929. The level of effort required for Phase C is greater than originally proposed and therefore increased the contract value above 30%.
Appendix C
Consulting Engineering Services for the Kennedy Newton Main & Annacis Main # 5 South for the Greater Vancouver Water District. Annacis Island Wastewater Treatment Plant Cogeneration System Engineering Services for the Greater Vancouver Sewerage and Drainage District. Waiting for the information to complete the design would have delayed the tender by one year, resulting in increased consulting engineering costs and inflation on the construction cost.
The total project value of $82M for design and construction is expected to be under budget by $10M due to the completed project decisions. Construction of the South Surrey Interceptor Johnston Road Section – Trenchless segments for the Greater Vancouver Sewerage and Drainage District. 01 is the result of changes to the BC Contaminated Sites Regulation (CSR) that raised the maximum standard for iron (Fe) during the contractor's procurement process, so this change was not captured in the design.
Cleveland Dam spillway restoration construction for the Greater Vancouver Water District.
Appendix D
That the Indigenous Relations Committee receive for information the October 1, 2019 report entitled “A Review of Red Women Rising: Indigenous Women Survivors in Vancouver's Downtown Eastside.”. The purpose of this report is to provide the Indigenous Relations Committee with a brief summary of the Red Women Rising: Indigenous Women Survivors in Vancouver's Downtown Eastside report and to identify which of the report's 35 key recommendations are relevant to Metro's operations Vancouver. On April 3, 2019, the Downtown Eastside Women's Center released Red Women Rising: Indigenous Women Survivors in Vancouver's Downtown Eastside.
Overview of Red Women Rising: Indigenous Women Survivors in Vancouver's Downtown Eastside Indigenous Relations Committee Regular Meeting Date: October 10, 2019 Page 2 of 3 Overview of Red Women Rising: Indigenous Women Survivors in Vancouver's Downtown Eastside Indigenous Relations Committee Regular Meeting Date : October 10, 2019 Page 3 of 3 Thirty-five key recommendations identified in Red Women Rising: Indigenous Women Survivors in Vancouver's East Side.
Provide an annual transport allowance to indigenous women in DET to travel to their place of origin.
ATTACHMENT
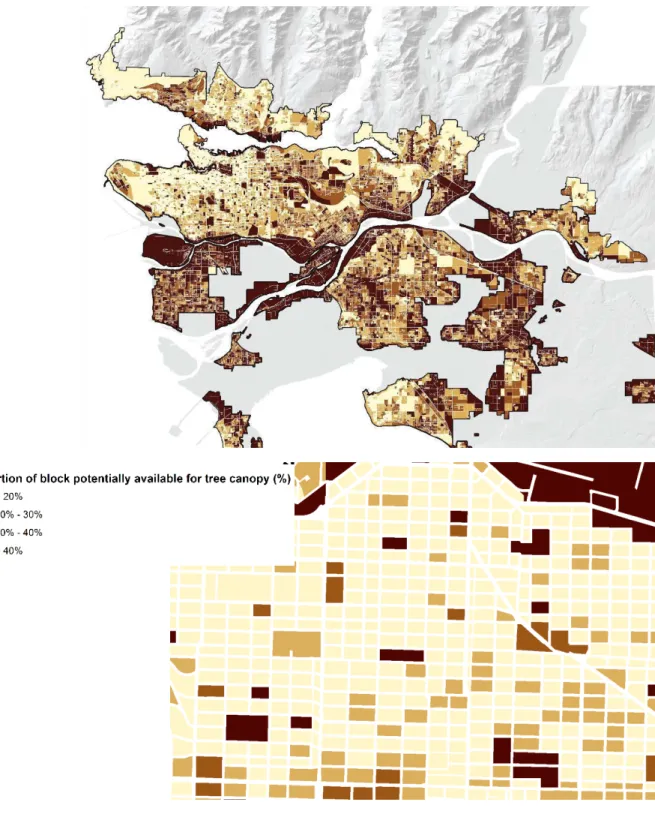
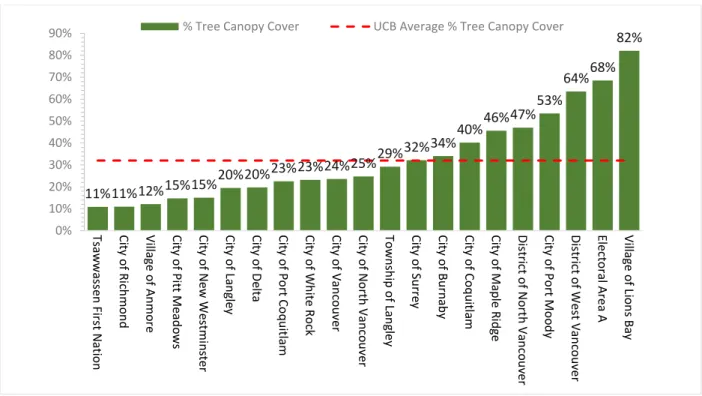
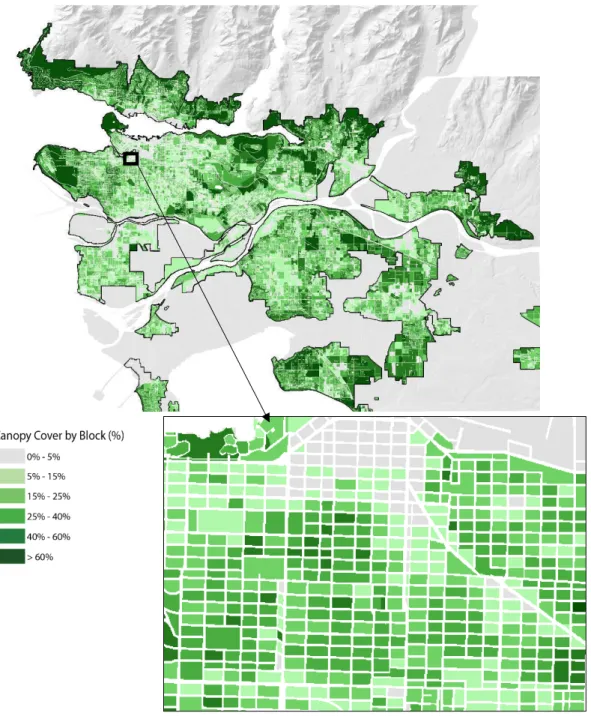
Tree Canopy Cover
Gray indicates very low canopy cover (less than 5%), and dark green indicates very high canopy cover (greater than 60%). Densified areas with low tree canopies generally correspond to densely populated urban areas and industrial land. Maps of the spatial distribution of tree canopies (such as Figure 3) can be used by local.
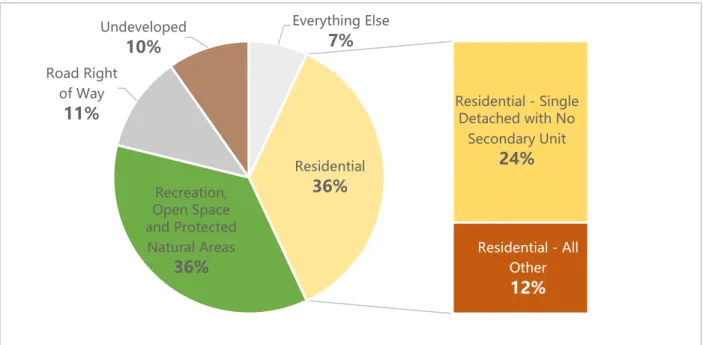
About half (54%) of Metro Vancouver's tree canopy cover within the UCB is located within the four members. To further understand the spatial distribution of tree canopy cover within the UCB, canopy was measured in relation to land use. Most of Metro Vancouver's tree cover within the UCB is located within recreational and natural protected areas (36%) and residential areas (36%).
24% of the tree canopy cover within the UCB is found within one specific type of residential area.
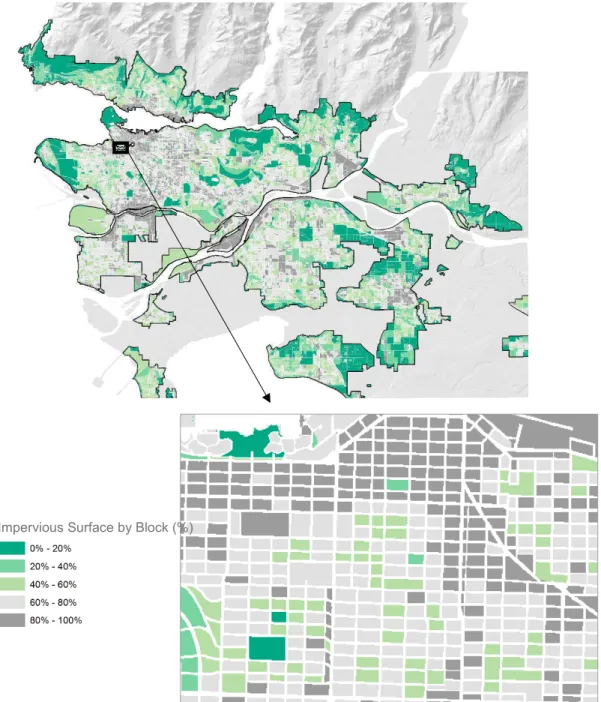
Impervious Surface
It is not yet possible to assess trends in regional impervious surface coverage because comparable historical data are not available. Overall, the twelve member jurisdictions are below the UCB average of 50% impervious surface for land within their borders and within the UCB. Many thresholds for biological degradation (e.g., invertebrate and fish diversity) and physical degradation (e.g., hydrology and geomorphology) in streams are associated with 10-20% impervious surface within the catchment30.
Approximately half (49%) of Metro Vancouver's impervious surface within the UCB is located within three member jurisdictions; Surrey contributes 23% of all impervious surface within the UCB, followed by Vancouver (16%), Richmond (11%) and Burnaby (10%). To further understand the spatial distribution of impervious surface within the UCB, amount of impervious surface was measured in relation to land use. Most of Metro Vancouver's impervious surface is located within residential areas (42%) and right-of-ways (25%).
30% of the impervious surface within the UCB is located in one specific type of residential zone - "Residential - Detached Single Family Home without Secondary Unit".
The Relationship between Tree Canopy Cover, Impervious Surfaces, and Residential Density - Temporal Analysis and Future
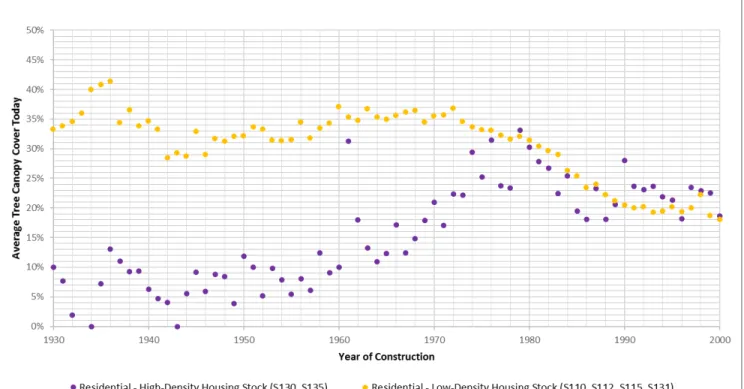
24 Figure 13: Average percentage of tree roof coverage for low-density homes and high-density lots, by year of construction. Although the relationship is less strongly linear, the data indicate that there has been an overall increase in the number of trees planted or retained for high-density housing over time. Comparing Figures 13 and 14, you will see that the pattern of change for percent impervious surface over time is consistent with that of percent tree canopy cover for both high-density and low-density residential parcels.
As average tree canopy cover decreased over time in low-density housing, there was a corresponding increase in impervious surface area. For high-density housing, this relationship is reversed, and as average tree canopy cover increased, impervious surface levels decreased over time. This results in less room for trees and an increase in impervious surfaces on low-density residential lots.
After 1980, % tree canopy cover on high-density residential lots declined slightly (Figure 13), but this was not matched by a corresponding increase in % impervious area, which remained relatively constant (Figure 14).
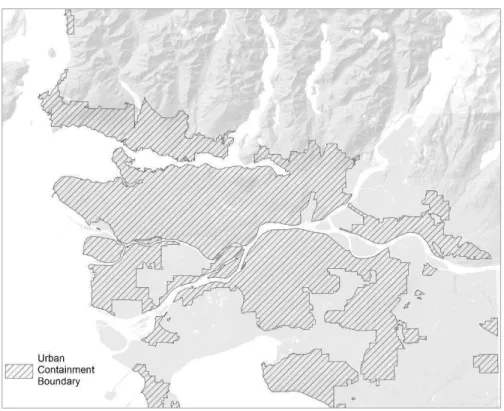
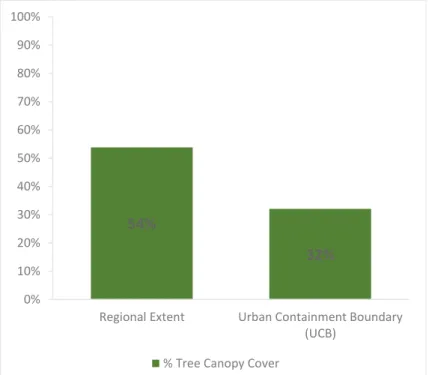
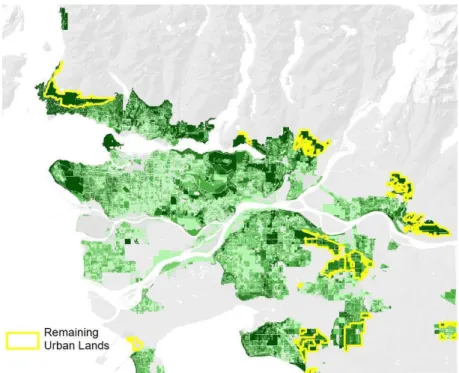
Future Projections of Tree Canopy Cover within the Urban Containment Boundary
Considering only the above two sources of loss, tree canopy cover within the UCB is projected to decline from 32% to 28% by 2040. Measuring tree canopy cover is a relatively simple way to determine the extent of an urban forest and the range of services it provides. Regional tree canopy cover in Metro Vancouver is 54% and for the urban boundary (UCB) is 32%.
Projected growth in the region over the next 20-30 years is expected to impact tree canopy cover within the UCB as land slated for future urban growth is developed, and single-family detached housing stock is redeveloped. Canopy cover in the UCB is expected to decrease from 32% to 28% due to these sources of loss. Metro Vancouver, member jurisdictions and other landowners and managers all have a role to play in maintaining tree canopy cover and reducing imperviousness.
Monitor the extent, distribution and status of tree canopy cover and imperviousness to inform planning and management.
Additional tables for % Tree Canopy Cover, % Impervious Surface and % Potential Planting Area
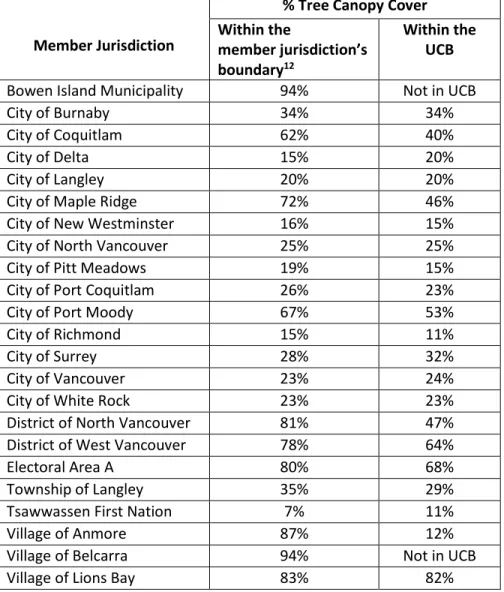
32 Table 5: % Tree Canopy Cover and % Impervious Surfaces by Member Jurisdiction within the Urban Catchment Boundary.
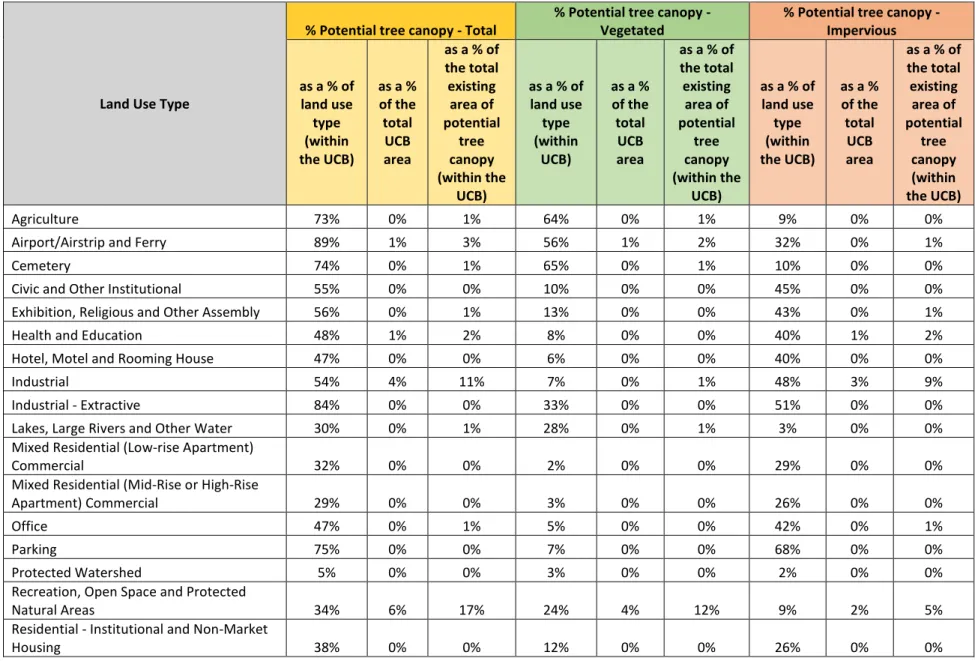
Potential Planting Area
- All industrial operations are carbon neutral
- The industrial sector employs Lowest Achievable Emission Rate technology to minimize air contaminant emissions to protect public health and the environment
The study focuses on all 6 municipalities with the most agricultural land in the region. Implementation of the Roadmaps will be driven by Metro Vancouver's management plans and other policies, including the Clean Air Plan. Input received will be used in the Clean Air Plan and the Climate 2050 transport roadmap.
The Clean Air Plan and Climate 2050 will be the key air quality and climate change planning documents for Metro Vancouver to support the transition to a carbon neutral and resilient region. An additional discussion paper, specific to the Clean Air Plan, outlines goals and actions for improving the tools and approaches Metro Vancouver and partners use to reduce emissions and manage air quality in the region. Short-term goals are milestones to support the achievement of the long-term goals and will be included in the Climate 2050 Transportation Roadmap and the Clean Air Plan.
The input received will be used in the Clean Air Plan and Industry Roadmap for Climate 2050. The Clean Air Plan and Climate 2050 will be key air quality and greenhouse gas planning documents for Metro Vancouver to support the transition to a carbon neutral and resilient region. The short-term goals are milestones in support of the long-term goals and will be included in the Industry 2050 Climate Plan and the Clean Air Plan.