A first approach to evaluate the vulnerability of islands’ vertebrates to
climate change in Mexico
Carolina URETA1, Angela P. CUERVO-ROBAYO2*, Edith CALIXTO-PÉREZ3, Constantino GONZÁLEZ-SALAZAR4 and Emiliano FUENTES-CONDE3
1 Laboratorio de Genética Molecular, Desarrollo y Evolución de Plantas, Instituto de Ecología, Universidad Nacional
Autónoma de México, 04510 Ciudad de México, México.
2 Comisión Nacional para el Conocimiento y Uso de la Biodiversidad (CONABIO), Periférico-Insurgentes Sur 4903,
14010 Ciudad de México, México.
3 Laboratorio de Análisis Espaciales, Instituto de Biología, Universidad Nacional Autónoma de México, 04510 Ciudad
de México, México.
4 Departamento de Ciencias Ambientales, Universidad Autónoma Metropolitana, Unidad Lerma, Hidalgo Pte. 46,
52006 Lerma, Estado de México, México.
* Corresponding author; email: [email protected]
Received: March 31, 2017; accepted: April 18, 2018 RESUMEN
Las islas mexicanas son de los territorios más diversos del mundo y por lo tanto su conservación debería ser una prioridad nacional e internacional. Se han detectado tres amenazas principales para la conservación de la diversidad en las islas de México: especies invasoras, cambio de uso de suelo y cambio climático. La mayoría de los estudios se ha enfocado a evaluar con diferentes perspectivas la problemática de las especies invasoras, en tanto que otros han abordado como tema principal el cambio de uso de suelo. Sin embargo, este estudio es el primer intento de realizar una evaluación del impacto del cambio climático sobre las especies de las islas mexicanas. En este trabajo se tuvieron dos objetivos: generar una lista de especies registradas en islas y modelar el posible impacto del cambio climático sobre la distribución potencial de las especies. Para la modelación de los posibles impactos se utilizaron modelos de nicho ecológico. Esta herramienta se basa en relacionar puntos de presencias con variables ambientales con el fin de crear un perfil bioclimático que pueda proyectarse en otros tiempos y espacios geográficos. Se compiló información y se creó una nueva lista de especies en islas que duplica la cantidad que había registrado el gobierno mexicano; además, se realizó el modelado de nicho ecológico para 54 especies de vertebrados. El esfuerzo de compilación sobre especies de islas es un paso fundamental para su posterior conservación. En el caso del modelado de nicho ecológico, se decidió modelar especies de mamíferos, reptiles y anfibios. De estos tres grupos, los reptiles exhibieron mayores pérdidas y presentan el mayor número en la lista de especies más vulnerables. Si se considera un escenario sin dispersión, todas las especies evaluadas tienen pérdidas en sus áreas de distribución potencial a futuro. Sin embargo, si se toma en cuenta el escenario de dispersión total, el valor neto de cambio es po-sitivo para la mayoría de las especies. En otras palabras, si no existen barreras humanas y la capacidad de dispersión es adecuada, es posible que el cambio en las condiciones climáticas no sea la amenaza principal para las especies residentes en islas. Al menos no en términos climáticos, pero habría que evaluar el papel que juega el incremento en el nivel del mar. No obstante, estas barreras ambientales y humanas existen en la mayoría de las especies evaluadas. Por otro lado, los mapas de riqueza muestran cambios futuros, ya que las áreas de mayor riqueza se desplazan al este y al norte. Finalmente, se encontraron diferencias significativas entre tiempos y escenarios en cuanto a pérdidas. Las mayores pérdidas se encontraron a largo plazo en el RCP 8.5 Wm–2 en comparación del RCP 4.5 Wm–2. Este resultado es relevante porque muestra que el rumbo que decida tomar la humanidad en términos de cambio climático tendrá impactos sobre la biodiversidad de las islas. Finalmente, recomendamos que futuros esfuerzos para evaluar vulnerabilidad al cambio climático
incorporen el aumento en el nivel del mar, cuyas consecuencias esperadas sobre las especies de islas serán mucho más graves.
ABSTRACT
Mexican islands are one of the most diverse territories in the world and consequently their conservation should be a national and international priority. Three main threats to islands’ diversity have been detected: invasive species, land use change and climate change. Most studies have been focused on invasive species and land use change. Actually, as far as we know, this work is the first approach to evaluate climate change impacts on the biodiversity of islands in Mexico. We had two main goals: to list the vertebrate species that have been registered in Mexican islands and to model the possible impacts of climate change in the distri-bution of islands’ vertebrates. To evaluate climate change impacts, we used the ecological niche modeling that relates geographic occurrences with environmental variables to create a bioclimatic profile that can be projected in other time and other geographic areas. In our results we obtained a list of species registered in Mexican islands that increased in more than twice the number of species acknowledged by the Mexican government and the ecological niche modeling of 54 vertebrate species. We found that the species list effort was very important, because knowing which species exist is the first step to preserve them. In terms of eco-logical niche modeling, we modeled mammals, reptiles and amphibians. From these three groups, reptiles were the group with greatest losses and more species in the top-ten vulnerable list. If we considered a no dispersion scenario, all evaluated species presented losses regarding their current potential distribution area. If the full dispersion scenario was taken into account, the net change value resulted positive for the majority of the species evaluated, consequently if no barriers exist and the dispersion ability is good enough, changes in climatic conditions might not be an important threat. However, this is not the case for most species eval-uated. Areas with a higher number of species (richest areas) do show changes in the future with shifts to the east and north of the country. Finally, we could find significant differences between times and scenarios in terms of suitable area losses. Greatest losses can be found in the long term RCP 8.5 Wm–2 in comparison to the long term RCP 4.5 Wm–2, meaning that the direction that humanity takes in terms of climate change will have consequences on island biodiversity. In this work, we did not take into account the sea level rise, which is expected to have important impacts on islands species.
Keywords: Climate change, island's biodiversity, ecological niche modeling
1. Introduction
Mexico has around 3210 islands (INEGI, 2014) embracing at least 2000 terrestrial species with over 10% of endemism (Aguirre-Muñoz et al., 2010). Most Mexican islands are in the Pacific Ocean and the Gulf of California, but there are others all over the territory incorporating an important amount of climatic diversity that goes from very dry to very humid climates. In terms of biodiversity, these ter-ritories are considered some of the richest on Earth (Aguirre-Muñoz et al., 2010). Due to the biological importance of Mexican islands, their species conser-vation should be a national and international priority; however, there is still a lack of biological and eco-logical knowledge about these systems.
There are three main factors threatening Mexican islands’ species: exotic species, land-use change and climate change (Aguirre-Muñoz et al., 2008, 2010). Efforts have mainly been focused on issues related to exotic species and land-use change (Arnaud et al.,
1993; Donlan et al., 2003; Knowlton et al., 2007), but very little attention has been given to climate change. Due to the lack of knowledge about island’s biodiversity and climate change we propose the use of ecological niche modeling (ENM) as a first approach to evaluate the vulnerability of terrestrial vertebrates that have been registered in Mexican is-lands, although they are mostly not endemic to them.
We are aware that there are other factors rather than the lack of a climatically suitable geographic area that might increase islands’ species vulnera-bility to climate change, such as specific biological characteristics (Foden et al., 2009, 2013a) and the sea level rise. However, this study is a first approach expected to help understanding how changes in climate will impact the potential distribution of islands’ species. Our research had two main goals: (1) to create a presence species list of terrestrial ver-tebrates (birds, mammals, reptiles and amphibians) for knowing what has been registered until now in all Mexican islands, and (2) to assess ecological niche models of 54 terrestrial vertebrates species (mammals, reptiles and amphibians) (CONABIO 2011, 2013; Lee, 2000; Navarro and Gordillo, 2006; Ramírez, 1999; Wilson and Ruff, 1999) recorded in Mexican islands under future climate change projections. We decided to use a single way to refer to our vertebrate groups under study for three dif-ferent reasons: (1) to make results more accessible to a broader public, like policymakers, (2) because our selected species were revised in the taxonomic authority catalogues published by the Comisión Nacional para el Conocimiento y Uso de la Biodi-versidad (National Commission for the Knowledge and Use of Biodiversity, CONABIO) (CONABIO, 2011, 2013; Navarro and Gordillo, 2006; Ramírez, 1999) where a common way of classification is used, and (3) the taxonomic discussion of these groups is beyond the goals of our study and does not affect our results. However, we are aware of the fact that there is a more accurate way of referring to the vertebrate groups under study (Cubo et al., 2005).
2. Methods
2.1 Species selection
In order to decide which species were going to be evaluated, we firstly needed to have a list of the spe-cies that were distributed in Mexican islands. As a first approach, the Mexican government provided us a list of 259 terrestrial vertebrate species (CONABIO, 2016). Then, we made an additional review of species in reports, theses, books, and governmental programs; and we increased the species list up to more than double the number of species that was firstly given to us by the Comisión Nacional para el Conocimiento y
Uso de la Biodiversidad (CONABIO) (Table I, Ap-pendix I). Finally, the geographic distribution of the listed species (Appendix I) was double-checked with polygons of known distributions from the red list of the International Union for Conservation of Nature (IUCN, 2017) and with taxonomic authority catalogs, in order to confirm their current taxonomic status and distribution on Mexican islands (CONABIO, 2011, 2013; Navarro and Gordillo, 2006; Ramírez, 1999).
Once we prepared the species list, we looked up for the species geographic records at CONABIO (2017) and the Global Biodiversity Information Fa-cility (GBIF, 2017). The first criterion for choosing species to be modeled was the number of unique geographic records. A minimum amount of records to create reliable models is still under discussion, but some experts suggest at least five (Pearson et al., 2007). We decided to use a minimum threshold of 10 unique records in order to have enough data for cre-ating and validcre-ating the model. The second criterion was to reduce uncertainty and error sources coming from scarce information and conceptual complexity, and although marine mammals and birds were listed in the occurrence data set, we decided not to consider them in the ecological niche modeling. As far as we know, there are no future marine layers for Mexico and as a result it is not possible to create ecological niche models (ENM) in the ocean. In terms of birds, most of islands’ species with over 10 unique records are migratory and consequently they need to be mod-eled in a particular way.
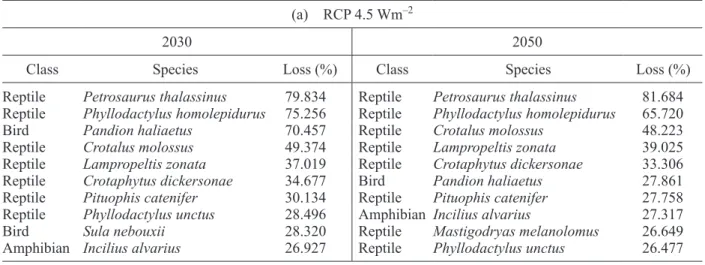
Table I. Top 10 evaluated species with greatest losses of future potential distribution area. (a) RCP 4.5 Wm–2 (loss), (b) RCP 8.5 Wm–2 (loss), (c) RCP 4.5 Wm–2 (net change) and (d) RCP 8.5 Wm–2 (net change).
(a) RCP 4.5 Wm–2
2030 2050
Class Species Loss (%) Class Species Loss (%)
Reptile Petrosaurus thalassinus 79.834 Reptile Petrosaurus thalassinus 81.684 Reptile Phyllodactylus homolepidurus 75.256 Reptile Phyllodactylus homolepidurus 65.720
Bird Pandion haliaetus 70.457 Reptile Crotalus molossus 48.223
Reptile Crotalus molossus 49.374 Reptile Lampropeltis zonata 39.025
Reptile Lampropeltis zonata 37.019 Reptile Crotaphytus dickersonae 33.306
Reptile Crotaphytus dickersonae 34.677 Bird Pandion haliaetus 27.861
Reptile Pituophis catenifer 30.134 Reptile Pituophis catenifer 27.758 Reptile Phyllodactylus unctus 28.496 Amphibian Incilius alvarius 27.317
Bird Sula nebouxii 28.320 Reptile Mastigodryas melanolomus 26.649
Amphibian Incilius alvarius 26.927 Reptile Phyllodactylus unctus 26.477 (b) RCP 8.5 Wm–2
2030 2050
Class Species Loss (%) Class Species Loss (%)
Reptile Petrosaurus thalassinus 77.157 Reptile Phyllodactylus homolepidurus 98.216
Bird Pandion haliaetus 75.868 Mammal Peromyscus eva 88.654
Reptile Phyllodactylus homolepidurus 71.525 Reptile Crotalus molossus 76.081
Reptile Crotalus molossus 62.389 Bird Chadrarius nivosus 75.711
Reptile Phyllodactylus xanti 60.739 Reptile Petrosaurus thalassinus 74.011
Reptile Lampropeltis zonata 57.079 Amphibian Aneides lugubris 68.45
Reptile Drymarchon corais 47.568 Reptile Drymarchon corais 64.498
Reptile Mastigodryas melanolomus 47.441 Reptile Lampropeltis zonata 63.891 Reptile Phyllodactylus unctus 45.199 Reptile Ctenosaura hemilopha 57.085
Reptile Pituophis catenifer 44.317 Mammal Chaetodipus baileyi 52.650
(c) RCP 4.5 Wm–2
2030 2050
Class Species Net Change Class Species Net Change
Reptile Crotalus molossus –40.297 Reptile Crotalus molossus –38.126
Reptile Mastigodryas melanolomus –14.088 Reptile Mastigodryas melanolomus –14.087 Reptile Lampropeltis zonata –11.046 Reptile Lampropeltis zonata –12.159
Amphibian Anaxyrus cognatus –6.043 Amphibian Anaxyrus cognatus –7.088
Mammal Chaetodipus baileyi –3.515 Amphibian Aneides lugubris –2.172
Reptile Oxybelis aeneus –1.113 Mammal Chaetodipus baileyi –1.274
Mammal Chaetodipus penicillatus 1.356 Amphibian Batrachoseps major 0.63
Amphibian Batrachoseps major 1.525 Reptile Oxybelis aeneus 0.765
2.2 Climate change scenarios
The species ecological niche was modeled under a current climatic scenario (1961-2000) and two-time series (2015-2039 and 2075-2099) under two differ-ent represdiffer-entative concdiffer-entration pathways (RCPs 4.5
and 8.5 Wm–2) (IPCC, 2014) at a 1 km2 resolution,
using regionalized climatology created with a weight-ed ensemble (Reliability Ensemble Averaging, REA) of 21 general circulation models (Fernández-Eguiarte et al., 2015). We modeled two contrasting RCPs scenarios to get an idea of the different outcome possibilities. The worst-case emission scenario is the
RCP 8.5 Wm–2, and it helps having an insight of the
consequences under the greatest changes expected
in climate. The moderate scenario, RCP 4.5 Wm–2,
gave us an insight of what would happen in terms of species geographic distribution if some positive actions take place to reduce future impacts.
To run ENMs we used 19 bioclimatic variables that represent annual tendencies and temporal varia-tion of climatic values that can be related to more bio-logical meaningful results (Nix, 1986). We generated these variables with the package “dismo” (Hijmans et al., 2014) of the open software R (R Core Team, 2014) and monthly values of precipitation, and maximum and minimum temperatures. The geographic area in which our species were projected was the entire
Mexican territory (M). The geographic area or M in
a BAM diagram represents the reachable geographic
area for the species, while B are the biotic factors of
the species niche and A the abiotic factors (Soberón
and Nakamura, 2009).
To select the geographic area M we should
con-sider which BAM diagram is more plausible for our
species. The main assumption for species distribution models using climatic change scenarios is that abiotic variables will be the main species constraints, and any reachable area for our target species cannot be occupied due to a lack of favorable environments.
It would be a BAM diagram in which A is a subset
of M and B is disregarded (Saupe et al., 2012). We
considered the Mexican territory as the potential area to be occupied in a free dispersion scenario
for all species (M), and climatic conditions (A) the
principal species constraints to reach any region of
Mexico (A is a ubset of M ). We decided to include
the entire Mexican territory, because even though we are modeling island species, most of them are not endemic to islands but are also distributed in
the continent. Additionally, using a single M for all
evaluated species allowed us a fair comparison of loss or gain area under climate change conditions. In order to reduce collinearity between the climatic variables, we performed a Pearson correlation test and selected nine variables that were not related to each other (determination coefficient value threshold
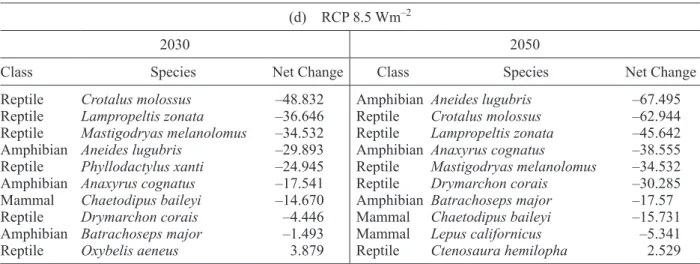
Table I. Top 10 evaluated species with greatest losses of future potential distribution area. (a) RCP 4.5 Wm–2 (loss), (b) RCP 8.5 Wm–2 (loss), (c) RCP 4.5 Wm–2 (net change) and (d) RCP 8.5 Wm–2 (net change).
(d) RCP 8.5 Wm–2
2030 2050
Class Species Net Change Class Species Net Change
Reptile Crotalus molossus –48.832 Amphibian Aneides lugubris –67.495
Reptile Lampropeltis zonata –36.646 Reptile Crotalus molossus –62.944
Reptile Mastigodryas melanolomus –34.532 Reptile Lampropeltis zonata –45.642 Amphibian Aneides lugubris –29.893 Amphibian Anaxyrus cognatus –38.555 Reptile Phyllodactylus xanti –24.945 Reptile Mastigodryas melanolomus –34.532
Amphibian Anaxyrus cognatus –17.541 Reptile Drymarchon corais –30.285
Mammal Chaetodipus baileyi –14.670 Amphibian Batrachoseps major –17.57
Reptile Drymarchon corais –4.446 Mammal Chaetodipus baileyi –15.731
Amphibian Batrachoseps major –1.493 Mammal Lepus californicus –5.341
Reptile Oxybelis aeneus 3.879 Reptile Ctenosaura hemilopha 2.529
R2 = 0.8) in the geographic area where models were
projected (M) (Soberón and Nakamura, 2009).
The following variables were used to create the model: Bio1: mean annual temperature; Bio2: mean diurnal range; Bio4: temporal variability; Bio6: minimum temperature of the coldest month; Bio7: annual range temperature; Bio12: annual precipi-tation; Bio13: precipitation of the wettest quarter; Bio18: precipitation of the hottest quarter, and Bio19: precipitation of the coldest quarter. This test was per-formed with the function cor in the R-based package (R Core Team, 2014).
2.3 Modeling with BIOMOD
The BIOMOD package (Thuiller et al., 2009) is a platform for ENM that works as a multimodeling system where several algorithms can be used si-multaneously and helps creating different types of model ensembles (Thuiller et al., 2009). One of the uncertainties in climate change assessments is that projections of species distributions can vary be-tween algorithms (Pearson et al., 2006). Ensembles are a way to manage and reduce uncertainty (Araújo and New, 2007). In this study we selected two al-gorithms: maximum entropy (MAXENT [Phillips et al., 2006]) and GAM (general additive models) that have shown a good performance in comparison to other methods (Elith et al., 2006). We used the default parameterization, creating randomly 10 000 pseudo-absences and 10 replicates per algorithm. We split species records and used 70% to create the model and 30% to validate it. As a model assem-bly rule, we chose the total consensus, which was weighted by the sum of probabilities of the model through the true skill statistic value (TSS) ≤ 0.7, meaning that every model used for the ensemble had at least that validation value. The threshold for the binary maps (presence/absence) was also de maximization of the TSS. We chose the TSS test because it has been shown that it is the best statistical option to interpret binary maps dealing with ecological phenomena (Allouche et al., 2006). We also used the BIOMOD range change function to estimate the proportion and relative number of lost, gained and stable pixels for each time period and RCPs.
Only four out of 54 species evaluated had less than 20 records, one mammal and three reptiles (see
Appendix II); however, for species with less than 20 unique records a jackknife analysis was carried out. The jackknife method helps validating the pre-dictability of models constructed with less than 20 data (Pearson et al., 2007). For species having more than 700 records, we used the SpThin packages (Aiello-Lammens et al., 2015). This library helps eliminating a specific amount of records to reduce bias resulting from oversampling and keeps the useful information in terms of unique records. It works by calculating the minimum geographic distance be-tween two points and randomly eliminating the ones which distance is equal or shorter than this minimum distance, where thin.par = 10 km.
3. Results
3.1 Biodiversity in the islands of Mexico
As we described above, we had to compile the in-formation about vertebrates registered in Mexican islands. To our knowledge, this is the most complete list of Mexican vertebrate species with an insular distribution. Our list is made up of 87 mammals, 228 birds, 117 reptiles and 20 amphibians. From this list, that includes all terrestrial vertebrates (mammals, birds, reptiles and amphibians), there are 10 species not recognized by GBIF.org (2017) and other six that do not have any geographic record (Appendix I). Most bird species that have been registered in Mexican islands are migratory (Appendix I), which represents a more complex system to model (Pérez-Moreno et al., 2016); however, we encourage future assessments with a specific type of analysis.
3.2 General tendencies in climate change vulnera-bility
For each evaluated species we reported unique georeference data, the percentage of area loss in the future with respect to the area that is climatically suit-able under current conditions, the percentage of new area that will have climatically suitable conditions under specific climate change scenarios in the future, and the net change, which is the difference between the future suitable area and the area loss (Appendix II). This information is presented for both RCPs 4.5
and 8.5 Wm–2 and for both short- and long term time
kind of restriction to disperse and migrate (unlimited dispersion scenario), then it is possible to take into account the net change. However, for precaution in terms of conservation we cannot forget about the limited dispersion scenario, in which species are restricted by biological/ecological characteristics and anthropogenic barriers.
In general, all evaluated species from all groups presented climatically suitable areas that may be lost in both RCPs and time frames (Appendix II). Still, increases in suitability areas were in general higher than losses, meaning that in the future there will be more climatically suitable areas for most species. Sig-nificant statistical differences were observed between RCPs in terms of area loss, gain and net change at
both time frames (Wilcoxon test, P≤ 0.05).
Signifi-cant differences were only found in the loss and gain of climatically suitable areas between scenarios 4.5
and 8.5 Wm–2 in the long term (2075-2099) and in
losses, gains and net change between times (4.5 Wm–2
[2015-2039] vs.4.5 Wm–2 [2075-2099], and 8.5 Wm–2
[2015-2039] vs.8.5 Wm–2 [2075-2099]).
To identify vulnerability between the studied groups, we created boxplots of the percentage of cli-matically suitable loss (Fig. 1) under a limited disper-sion scenario. In this figure it is possible to distinguish that in both extremes analyzed, the “best case
scenar-io” (4.5 Wm–2) in the short term and “the worst-case
emission scenario” in the long term (8.5 Wm–2),
reptiles are the species with greatest losses followed by amphibians and mammals. In the long term, the variability in area loss increases up to almost 100% of the area that is climatically suitable under current climatic conditions (Fig. 1).
3.2 Top ten vulnerability list
We ranked species and selected the top 10 with great-est losses under a limited dispersion scenario and the top 10 that will be more affected even when taking into account future suitable regions—i.e., unlimited dispersion scenario—(Table I). Under a limited dis-persion scenario, reptiles are the group that has more species in the top 10 with greatest losses, followed by amphibians. Mammals are almost not present in the top 10 list (Table Ia, c). When net change is analyzed, reptiles continue to be a vulnerable group followed by amphibians and mammals. The current suitable area loss in these groups is so great that it
cannot be compensated by future new areas with suitable conditions.
3.3 Vulnerability inside the three vertebrate groups 3.3.1 Mammals
In the short term (2015-2039), solely Chaetodipus
baileyi will have a negative net change, which means that it will lose more climatically suitable area than it will win under both RCPs evaluated. The rest of the mammal species studied show a positive net change. Under the unlimited dispersion scenario at
RCP 4.5 Wm–2, 80% of the species lose 10% of their
distribution area. At RCP 8.5 Wm–2, the percentage
of species losing more than 10% of their distribution area rises to 90% (Appendix II).
In the long term, there are two species showing
neg-ative net change: Chaetodipus baileyi and Lepus
cal-ifornicus (only in RCP 8.5 Wm–2). Under both RCPs, 90% of the species are expected to lose more than 10% of their distribution area. Greatest losses are expected
from Chaetodipus baileyi (30%) in RCP 4.5 Wm–2 and
from Peromyscus eva in RCP 8.5 Wm–2 (88%).
3.3.2 Reptiles
In all times and scenarios, evaluated species lose a fraction of their suitable current area. Through time the percentage of area losses increases (Appendix II). In this group, more species are found with negative net change values. The species with greatest negative
net change values are Lampropeltis zonata,
Masti-godryas melanolomus and Crotalus molossus. Their net change value in the worst-case scenario (long
term RCP 8.5 Wm–2) rises to –45.64, –34.53 and
–62.94%, respectively.
3.3.3 Amphibians
As with reptiles, amphibians had more than one species with negative net change values. In the short
term, under RCP 4.5 Wm–2, only Anaxyrus cognatus
presented a net change of –6.043%, but under RCP
8.5 Wm–2 there were two species Anaxyrus cognatus
and Aneides lugubris (Appendix II). In the long term,
Batrachoseps major had also a negative net change. Under an unlimited dispersion scenario, the two species that exhibited greatest losses did not have a negative net change because it was compensated with climatically new potential distribution areas. That is
4. Discussion
4.1 General tendencies in climate change vulnera-bility
This study is a good first approach to imrpove our knowledge on species diversity in Mexican islands and getting an insight of their vulnerability under cli-mate change conditions. The compilation of species found in these islands allows us to understand that
greater efforts are needed to increase our knowledge on which species are present in our territory. If this basic information is incomplete, it is very difficult to channel conservation efforts. Several species of different groups of vertebrates are present in Mexican islands but lack the minimum occurrence records (Appendix I). An increase in sampling efforts is needed for species mentioned in our appendix as
Fig. 1. Percentage of area loss in all evaluated groups in terms of species richness (number of species in a geographic area) for all taxonomic groups. The greatest species distributional shifts are shown in central and northern Mexico. Mammals’ richest areas under current climatic con-ditions can be found in the Baja California peninsula. With time, the richest areas decrease and besides shifting towards the north, they show an eastward trend in colonization. For reptiles, the richest areas were found mainly in the coast of Baja California and Sonora, but under future scenarios the areas with higher number of species decrease and shift eastward toward the center of Mexico. A similar pattern can be found for amphibians (Appendix III).
80
60
40
% Los
s
20
0
Mammals Reptiles Amphibians Terrestrial vertebrates
RCP 4.5
Short-Term
80
60
40
% Los
s
20
0
Mammals Reptiles Amphibians Terrestrial vertebrates
RCP 8.5
80
60
40
% Loss
20
0
Mammals Reptiles Amphibians Terrestrial vertebrates
RCP 4.5
Long-Term
80
60
40
% Loss
20
0
Mammals Reptiles Amphibians Terrestrial vertebrates
“without records”, which are 16 reptile species and two birds (Appendix I).
In terms of vulnerability to climate change, spe-cies that will suffer in the future great losses of their current climatically suitable area do not necessarily present a negative net change. Species might be gaining new potential distribution areas bigger than area losses. However, the fact that new climatically suitable areas will exist in the future does not mean that species will be able to reach them. There are factors such as dispersion ability and ecological or anthropogenic barriers that might keep species from relocating to the new suitable regions (Pearson and Dawson, 2003; Parmesan 2006). Consequently, it is important to keep in mind the question to be answered in order to decide which result is needed: the unlimited or the limited dispersion scenario. We think that in terms of conservation it will be important to use both results. Both scenarios can channel our efforts regarding conservation plans. For example, if ecological and anthropogenic barriers were obvious, then assuming that species will be able to reach new suitable areas would be unrealistic. Those species could be considered vulnerable even when its net change is positive. However, translocation could be an alternative. For species without new potential dis-tribution areas, preservation efforts must take place in their current distribution area. In general, our results project positive net changes, meaning that new cli-matically suitable areas were greater than area losses for most species evaluated. We could also find sig-nificant differences in area losses between scenarios
RCP 4.5 and RCP 8.5 Wm–2 in the long term, meaning
that if humanity chooses to follow an ecological way of life and reduces emissions, negative impacts in the distribution (and possible extinctions) of species will be significantly reduced. On the other hand, the richest areas for all evaluated taxonomic groups are expected to shift and change under future scenarios. In other words, hotspots of species richness will probably change and consequently current hotspots should not be the only tools used to concentrate conservation efforts.
In general, reptiles are the species with great-est losses and lower net change values (Fig. 1 and Table I). This result was very surprising, because amphibians as a group have been reported to be very vulnerable to environmental and climate changes
(Blaustein et al., 2003; Foden et al., 2013a). However, it is important to keep in mind that even when their net change or losses in the future are not greater than those of reptiles, most species in this group have very restricted distributions and other biological charac-teristics (such as the strong dependence to specific timing and amount of precipitation in order to fulfill their life history requirements) that make them sen-sitive to climate change (Wake, 2007).
4.2 Vulnerability in the three vertebrate groups 4.2.1 Mammals
Mammals were the group that showed less impact by climate change in their ranges. In fact, most species in this group had positive net change values (i.e., more area gains than losses). However, as mentioned above, positive net change does not necessarily mean less vulnerability. The mammals studied here are mainly distributed on the Pacific slope in the west side of the Sierra Madre Occidental pine-oak forest ecoregion (Wilson and Ruff, 1999; Ceballos and Ol-iva, 2005). Our outcomes show that some of the new suitable climate areas were forecasted toward eastern regions of Mexico that represent another ecoregion, and consequently an important ecological barrier for species to reach their new climatically suitable area. In addition, 65% of the species belong to the order Rodentia, for which low dispersion ability is recognized (Schloss et al., 2012). Thus, due to the rapidity of projected climatic changes, these species probably will not be able to modify their ranges fast enough to track suitable climates. On the other hand, some species may have better dispersion abilities but their ecological requirements restrict them to particular habitats; for instance, the piscivorous bat
Myotis vivesi (González-Salazar et al., 2014) will not be able to occupy the predicted areas if these are not located near water bodies.
If we consider a limited dispersion scenario, i.e., species remain in areas where current ranges are retained more than colonizing new areas, mammals may suffer a reduction in their geographic distribution ranging from 6 to 24% in the short term for both RCPs.
However, in the long term under RCP 8.5 Wm–2,
be considered highly threatened by climate change.
Three other species, Ammospermophilus leucurus,
Neotoma lepida and Peromyscus merriami, which are restricted to the Baja California peninsula even though they are not endemic to Mexico, show an area loss of 25-46%. Therefore, in terms of mammals, this region can be considered at high risk of biodiversity loss. Similar results in the Baja California peninsula were identified by Aguado and Escalante (2015), who identified endemism in this area and showed reductions under climate change conditions.
4.2.2 Reptiles
In our results, reptiles were the group with greatest future losses in terms of potential distribution area (Fig.1, Table I). In general, populations of reptiles have been declining around the world (Gibbon et al., 2000), and species in Mexico are not the exception. The populations of several Mexican reptiles have been reduced or extinguished in the last 30 yrs (Bal-lesteros-Barrera et al., 2007; Sinervo et al., 2010), mostly due to land used change.
In our study, under a limited dispersion scenario, most species will lose around 50% of their potential distribution. Nevertheless, even under the unlim-ited dispersion scenario, this group had a greater number of species with negative net change values.
Within the species with negative net changes, L.
zonata and C. molossus are currently considered as
threatened by the Mexican government. L. zonata
is a native species of Baja California, associated to water bodies and riparian vegetation, which are currently at risk due to fragmentation and extensive
agriculture (Arriaga et al., 2000). C. molosus, is a
generalist species that can be found in diverse types of vegetation; however, it is also threatened due to the presences of cattle and agriculture (Ramírez and Hernández, 2004). The reptile species with greatest
losses, P. thalassius, is native of Baja California. It
is currently under special protection by the Mexican authorities due to habitat degradation and fragmen-tation (Arriaga et al., 2000).
4.2.3 Amphibians
Amphibians were the second most vulnerable group according to our results. Three different species,
A. cognatus, A. lugubris and B. major, presented
negative net changes. A. lugubris and B. major have
restricted distributions and are localized in the Baja California peninsula and its islands. By contrast,
A. cognatus is widely distributed and its negative net change values might not represent an important threat to this species. The two species that exhibited greater losses but did not present negative net change
values were A. californicus and I. alvarius, being
A. californicus the only one with a very restricted distribution, which implies vulnerability to climate change. Even though climate change might not seem an important threat to this group, it is important to highlight that studies have shown in general that amphibians are vulnerable to changes in temperature and precipitation patterns (Wake, 2007; Foden et al., 2013b). Furthermore, greater threats are expected from the indirect impact of climate change, which will affect amphibians biological interactions increas-ing the probability of disease and the loss of positive interaction with specific tree species (Wake, 2007).
5. Conclusions
This study is an effort to increase our knowledge of Mexican islands’ species. It was possible through this effort to have a better idea of the terrestrial ver-tebrate’s diversity that exists in islands and for which species information is urgently needed. On the other hand, it was also an effort to increase our knowledge about the vulnerability of species to climate change. ENM was a first approach that allowed us to under-stand that climatically suitable areas will exist in the future for most species. Still, climate change cannot be discarded as an important threat, because we do not know if species will be able to migrate to new suitable areas. Furthermore, climate change might affect species in indirect ways by modifying their bi-ological interactions with other organisms or simply because their biological characteristics make them vulnerable to any environmental change. Finally, sea level rise, which is expected to have great negative impacts on islands diversity (Bellard, 2013), was not considered in this study.
Acknowledgments
the Instituto Nacional de Ecología y Cambio Climáti-co and the Programa de las Naciones Unidas para el Desarrollo for their support to fulfill this project.
References
Aguado-Bautista Ó. and Escalante T., 2015. Cambios en los patrones de endemismo de los mamíferos terrestres de México por el calentamiento global. Rev. Mex. Biodivers. 86, 99-110.
DOI: 10.7550/rmb.46637
Aguirre-Muñoz A., Croll D.A., Donlan C.J., Henry III R.W., Hermosillo M.A., Howald G.R., Keitt B. S., Luna-Mendonza L., Rodríguez-Malagón M. and Salas-Flores L.M., 2008. High-impact conservation: invasive mammal eradications from the islands of western Mexico. AMBIO 37, 101-107.
DOI: 10.1579/0044-7447(2008)37[101:HCIMEF]2.0. CO;2
Aguirre-Muñoz A., Bezaury Creel J., De la Cueva H., March Mifust I. and Peters Recagno E. (Comp.), 2010. Islas de México, un recurso estratégico. Instituto Nacional de Ecología-The Nature Conservancy-Gru-po de Ecología y Conservación de Islas- Centro de Investigación Científica y de Educación Superior de Ensenada, Mexico. Available at: http://www.biodiver-sidad.gob.mx/ecosistemas/pdf/IslasMex.pdf.
Aiello-Lammens M.E., Boria R., Radosavljevic A., Vilela B. and Anderson R.P., 2015. spThin: an R package for spatial thinning of species occurrence records for use in ecological niche models. Ecography 38, 541-545. DOI: 10.1111/ecog.01132
Allouche O., Tsoar A. and Kadmon R., 2006. Assessing the accuracy of species distribution models: Prevalence, kappa and the true skill statistic (TSS). J. Appl. Ecol. 43, 1223-1232.
DOI: 10.1111/j.1365-2664.2006.01214.x
Araújo M.B. and New M., 2007. Ensemble forecasting of species distributions. Trends Ecol. Evol. 22, 42-27. DOI: 10.1016/j.tree.2006.09.010
Arriaga L. Espinoza-Rodriguez J.M., Aguilar-Zuñiga C., Martinez-Romero E., Gomez-Mendoza L. and Loa Loza E., 2000. Regiones terrestres prioritarias de México. Comisión Nacional para el Conocimiento y Uso de la Biodiversidad. Disponible en: http://bioteca. biodiversidad.gob.mx/janium/Documentos/1036.pdf. Arnaud G., Rodríguez A., Ortega-Rubio A. and Álva-rez-Cárdenas S., 1993. Predation by cats on the unique
endemic lizard of Socorro Island (Urosaurus auricula-tus), Revillagigedo, Mexico. Ohio J. Sci. 93, 101-104. Available at: http://hdl.handle.net/1811/23573. Ballesteros-Barrera C., Martínez-Meyer E. and Gadsden
H., 2007. Effects of land-cover transformation and cli-mate change on the distribution of two microendemic lizards, genus Uma, of northern Mexico. J. Herpetol-ogy 41, 733-740. DOI: 10.1670/06-276.1
Bellard C., Leclerc C. and Courchamp F., 2013. Impact of sea level rise on the 10 insular biodiversity hotspots. Global Ecol. Biogeogr. 32, 203-2012.
DOI: 10.1111/geb.12093
Blaustein A.R., Romansic J.M., Kiesecker J.M. and Hatch A.C., 2003. Ultraviolet radiation, toxic chemicals and amphibian population declines. Divers. Distrib. 9, 123-140. DOI: 10.1046/j.1472-4642.2003.00015.x Ceballos G. and Oliva G., 2005. Los mamíferos silvestres
de México. Comisión Nacional para el Conocimiento y Uso de la Biodiversidad-Fondo de Cultura Económica, México, 968 pp.
CONABIO, 2011. Catálogo de autoridades taxonómicas de los anfibios (Amphibia: Craniata) de México. Base de datos SNIB-CONABIO. Incluye información del proyecto CS003. Comisión Nacional para el Cono-cimiento y Uso de la Biodiversidad, México.
CONABIO, 2013. Catálogo de autoridades taxonómicas de los reptiles (Reptilia:Craniata) nativos de México. Base de datos SNIB-CONABIO. Incluye información del proyecto CS003. Comisión Nacional para el Cono-cimiento y Uso de la Biodiversidad, México. CONABIO, 2016. Sistema Nacional de Información
so-bre Biodiversidad (SNIB). Registros de especímenes, versión 2016-09. Comisión Nacional para el Cono-cimiento y Uso de la Biodiversidad, México. Available at: http://www.snib.mx/d/CONABIO-SNIB-Ver-sion-201609.pdf.
Cubo J., Ponton F., Laurin M., De Margerie E. and Castanet J., 2005. Phylogenetic signal in bone microstructure of sauropsids. Syst. Biol. 54, 562-574.
DOI: 10.1080/10635150591003461
Donlan C.J., Howald G.R., Tershy B.R. and Croll D.A., 2003. Evaluating alternative rodenticides for island conservation: roof rat eradication from the San Jorge Islands, Mexico. Biol Conserv114, 29-34.
DOI: 10.1016/S0006-3207(02)00401-9
Manion G., Moritz C., Nakamura M., Nakazawa Y., Overton J., McC., Peterson A.T., Phillips S. J., Richard-son K.S., Scachetti-Pereira R., Schapire R.E., Soberón J., Williams S., Wisz M. S. and Zimmermann N.E., 2006. Novel methods improve prediction of species’ distributions from occurrence data. Ecography 29, 129-151. DOI: 10.1111/j.2006.0906-7590.04596.x Fernández-Eguiarte A., Zavala Hidalgo J., Romero Centeno
R., Conde Álvarez A.C. and Trejo Vázquez R.I., 2015. Actualización de los escenarios de cambio climático para estudios de impactos, vulnerabilidad y adaptación. Centro de Ciencias de la Atmósfera, Universidad Nacio-nal Autónoma de México-Instituto NacioNacio-nal de Ecología y Cambio Climático-Secretaría de Medio Ambiente y Recursos Naturales, México. Disponible en: http:// atlasclimatico.unam.mx/AECC/servmapas/.
Foden W., Mace G.M., Vié J.-C., Angulo A., Butchart S.H., DeVantier L., Dublin H.T., Gutsche A., Stuart S., and Turak E., 2009. Species susceptibility to climate change impacts. In: Wildlife in a changing world–an analysis of the 2008 IUCN Red List of threatened species (Vié J.-C., Hilton-Taylor C. and Stuart S.N., Eds.). International Union for Conservation of Nature, Gland, Switzerland, 77-88.
Foden W., Butchart S.H., Stuart S.N., Vié J.-C., Akçakaya H.R., Angulo A., DeVantier L.M., Gutsche A., Turak E. and Cao L., 2013a. Identifying the world’s most climate change vulnerable species: A systematic trait-based assessment of all birds, amphibians and corals. PloS One 8, e65427. DOI: 10.1371/journal.pone.0065427 Foden W., Butchart S.H.M., Stuart S., Vié J.C., Akcakaya
H.R., Angulo A., Devantier L., Gutsche A., Turak E., Cao L., Donner S., Katariya V., Bernard R., Holland R., Hughes A., O’Hanlon S., Garnett S., Sekercioglu C. and Mace G.M., 2013b. Identifying the world’s most climate change vulnerable species: A systematic trait-based assessment of all birds, amphibians and corals. PloS One 8, e65427. DOI: 10.1371/journal. pone.0065427
GBIF, 2017. Global Biodiversity Information Facility. Available at: https://www.gbif.org.
Gibbon J.W., Scott D.E., Ryan T.J., Buhlmann K.A., Tuberville T.D., Metts B.S., Greene J.L., Mills T., Leiden Y., and Poppy S., 2000. The global decline of reptiles, déjà vu amphibians: Reptile species are declining on a global scale. Six significant threats to reptile populations are habitat loss and degradation, introduced invasive species, environmental pollution,
disease, unsustainable use, and global climate change. BioScience 50, 653-666.
DOI: 10.1641/0006-3568(2000)050[0653:TG-DORD]2.0.CO;2
González-Salazar C., Martínez-Meyer E. and López-San-tiago G., 2014. A hierarchical classification of trophic guilds for North American birds and mammals. Rev. Mex. Biodivers. 85, 931-941. DOI: 10.7550/rmb.38023 Hijmans R., Phillips S., Leathwick J. and Elith J., 2017.
Package “dismo”. R package. Available at: https:// cran.r-project.org/web/packages/dismo/dismo.pdf (last accessed on: June 2018).
INEGI, 2014. Catálogo del Territorio Insular Mexicano. Subgrupo del Catálogo de Islas Nacionales del Grupo Técnico para la Delimitación de las Zonas Maríti-mas Mexicanas, 2014. INEGI, SEGOB, SEMAR, SEMARNAT, SRE, SCT, INECC, CONANP, UNAM. Aguascalientes, Mexico, 245 pp. Available at: http:// internet.contenidos.inegi.org.mx/contenidos/produc-tos/prod_serv/contenidos/espanol/bvinegi/productos/ nueva_estruc/702825079239.pdf
IPCC, 2014. Cambio climático 2014: Impactos, adaptación y vulnerabilidad. Resumen para responsables de políti-cas. Contribución del Grupo de trabajo II al Quinto Informe de Evaluación del Grupo Intergubernamental de Expertos sobre el Cambio Climático. Organización Meteorológica Mundial, Ginebra, Suiza, 34 pp. IUCN, 2017. IUCN Red List of Threatened Species.
Version 2013.2. International Union for Conservation of Nature and Natural Resources. Available at: http:// www.iucnredlist.org.
Knowlton J.L., Josh Donlan C., Roemer G.W., Sa-maniego-Herrera A., Keitt B.S., Wood B., Agu-irre-Muñoz A., Faulkner K.R. and Tershy B.R., 2007. Eradication of non-native mammals and the status of insular mammals on the California Channel Islands, USA, and Pacific Baja California Peninsula Islands, Mexico. Southwest Nat. 52, 528-540.
DOI: 10.1894/0038-4909(2007)52[528:EONMAT]2.0. CO;2
la Biodiversidad, Mexico. Available at: http://www. biodiversidad.gob.mx/especies/gran_familia/animales/ aves/doc/Aves.pdf.
Nix H.A., 1986. A biogeographic analysis of Australian elapid snakes. In: Atlas of elapid snakes of Australia (Longmore R., Ed.). Australian Government Publish-ing Service, Camberra, 4-15.
Parmesan C., 2006. Ecological and evolutionary responses to recent climate change. Annu. Rev. Ecol. Evol. Syst. 37, 637-669.
DOI: 10.1146/annurev.ecolsys.37.091305.110100 Pearson R.G. and Dawson T.P., 2003. Predicting the
im-pacts of climate change on the distribution of species: are bioclimate envelope models useful? Global Ecol. Biogeogr. 12, 361-371.
DOI: 10.1046/j.1466-822X.2003.00042.x
Pearson R.G., Raxworthy C.J., Nakamura M. and Peterson A.T., 2007. Predicting species distributions from small numbers of occurrence records: a test case using cryptic geckos in Madagascar. J. Biogeogr. 34,102-117. DOI: 10.1111/j.1365-2699.2006.01594.x
Pearson R.G., Thuiller W., Araújo M.B., Martinez-Meyer E., Brotons L., McClean C., Miles L., Segurado P., Dawson T.P. and Lees D.C., 2006. Model-based un-certainty in species range prediction. J. Biogeogr. 33, 1704-1711. DOI: 10.1111/j.1365-2699.2006.01460.x Pereira H.M., Leadley P. W., Proença V., Alkemade R.,
Scharlemann J.P., Fernandez-Manjarrés J.F., Araújo M.B., Balvanera P., Biggs R. and Cheung W.W., 2010. Scenarios for global biodiversity in the 21st century. Science 330, 1496-1501.
DOI: 10.1126/science.1196624
Pérez-Moreno H., Martínez-Meyer E., Soberón J. and Rojas-Soto O., 2016. Climatic patterns in the establish-ment of wintering areas by North American migratory birds. Ecol. Evol. 6, 2022-2033.
DOI: 10.1002/ece3.1973
Peterson A. T., Soberón J., Pearson R.G., Anderson R.P., Martínez-Meyer E., Nakamura M. and Araújo M.B., 2011. Ecological niches and geographic distributions. Princeton University Press, 328 pp. (Monographs in Population Biology, 49).
Phillips S.J., Anderson R.P. and Schapire R.E., 2006. Maximum entropy modeling of species geographic distributions. Ecol. Model. 190, 231-259.
DOI: 10.1016/j.ecolmodel.2005.03.026
Ramírez P.J., 1999. Catálogo de autoridades de los mamíferos terrestres de México. Universidad Autónoma
Metropolitana-Iztapalapa. Base de datos SNIB-Con-abio, proyecto Q023, 111 pp. Available at: http://www. biodiversidad.gob.mx/especies/gran_familia/animales/ mamiferos/pdf/Mamiferos.pdf.
Ramírez Bautista A. and Hernández Ibarra X., 2004. Ficha técnica de Crotalus molossus. In: Sistemática e historia natural de algunos anfibios y reptiles de Méx-ico (Arizmendi M.C., comp.). Facultad de Estudios Superiores Iztacala, Unidad de Biología, Tecnología y Prototipos (UBIPRO), Universidad Nacional Autóno-ma de México. Base de datos SNIB-CONABIO, proyecto W013, Mexico, 25 pp. Available at: http:// www.conabio.gob.mx/institucion/proyectos/resulta-dos/W013_Fichas%20de%20Especies.pdf.
R Core Team, 2014. R: A language and environment for statistical computing. R Foundation for Statistical Computing, Vienna, Austria. Available at: http://ww-w.R-project.org/.
Saupe E.E., Barve V., Myers C.E., Soberón J., Barve N., Hensz C.M., Peterson A.T and Lira-Noriega A., 2012. Variation in niche and distribution model performance: the need for a priori assessment of key causal factors. Ecol. Model. 237, 11-22.
DOI: 10.1016/j.ecolmodel.2012.04.001
Schloss C.A., Nuñez T.A. and Lawler J.J., 2012. Dispersal will limit ability of mammals to track climate change in the Western Hemisphere. P. Natl. Acad. Sci. USA 109, 8606-8611. DOI: 10.1073/pnas.1116791109
Sinervo B., Méndez-De-La-Cruz F., Miles D.B., Heulin B., Bastiaans E., Villagrán-Santa M., Lara-Reséndiz R., Martínez-Méndez N., Calderón-Espinosa M. L. and Meza-Lázaro R. N., 2010. Erosion of lizard diversity by climate change and altered thermal niches. Science 328, 894-899. DOI: 10.1126/science.1184695 Soberón J. and Nakamura M., 2009. Niches and
distribu-tional areas: concepts, methods, and assumptions. P. Natl. Acad. Sci. USA 106, 19644-19650.
DOI: 10.1073/pnas.0901637106
Thuiller W., Lafourcade B., Engler R. and Araújo M.B., 2009. BIOMOD – a platform for ensemble forecasting of species distributions. Ecography 32, 369-373. DOI: 10.1111/j.1600-0587.2008.05742.x
Wake D.B., 2007. Climate change implicated in amphibian and lizard declines. P. Natl. Acad. Sci. USA 104, 8201-8202. DOI: 10.1073/pnas.0702506104
Appendix I
Mammals
Species Name GBIF total records
Ammospermophilus leucurus 3112
Antrozous pallidus 8532
Arctocephalus townsendi 117
Balaenoptera edéni 452
Balaenoptera acutorostrata 11649
Balaenoptera musculus 6321
Balaenoptera physalus 94475
Bassariscus astutus 3165
Canis latrans 24842
Chaetodipus arenarius 4847
Chaetodipus fallax 4430
Chaetodipus baileyi 7632
Chaetodipus intermedius 6800
Chaetodipus penicillatus 12052
Chaetodipus spinatus 7286
Corynorhinus townsendii 8720
Delphinus capensis 922
Delphinus delphis 12170
Dipodomys merriami 42381
Eptesicus furinalis 2286
Eschrichtius robustus 5098
Feresa attenuata 191
Globicephala macrorhynchus 1409
Glossophaga soricina 33757
Grampus griseus 3766
Kogia sima 573
Lagenorhynchus obliquidens 1671
Lepus insularis 263
Lasiurus cinereus 7772
Lasiurus xanthinus 610
Leptonycteris nivalis 2980
Lepus alleni 774
Lepus californicus 9296
Lynx rufus 17635
Macrotus californicus 4320
Megaptera novaeangliae 28654
Mesoplodon peruvianus 72
Mirounga angustirostris 1345
Mormoops megalophylla 8109
Musonycteris harrisoni 158
Myotis californicus 5898
Myotis vivesi 1140
Nasua narica 3403
Neotoma albigula 15290
Neotoma anthonyi 29
Neotoma bryanti 2554
Neotoma bunkeri 15
Neotoma lepida 11344
Mammals
Species Name GBIF total records
Neotoma albigula 15290
Notiosorex crawfordi 1512
Nyctinomops femorosaccus 1042
Odocoileus hemionus 7685
Orcinus orca 3090
Ovis canadensis 10868
Peponocephala electra 330
Peromyscus eremicus 27362
Peromyscus eva 1855
Peromyscus guardia 173
Peromyscus caniceps 95
Peromyscus dickeyi 198
Peromyscus interparietalis 576
Peromyscus maniculatus 222.624
Peromyscus merriami 1152
Peromyscus pembertoni 18
Peromyscus pseudocrinitus 74
Peromyscus sejugis 348
Peromyscus slevini 135
Peromyscus stephani 121
Phoca vitulina 19463
Pipistrellus hesperus 7290
Procyon lotor 56
Procyon pygmaeus 56
Pseudorca crassidens 1187
Reithrodontomys spectabilis 178
Spermophilus tereticaudus 2705
Spermophilus variegatus 5970
Stenella longirostris 2692
Stenella attenuata 5639
Stenella coeruleoalba 4243
Steno bredanensis 863
Sylvilagus bachmani 2274
Sylvilagus graysoni 110
Sylvilagus mansuetus 98
Tadarida brasiliensis 341
Thomomys bottae 39572
Thomomys umbrinus 10260
Trichechus manatus 1811
Tursiops truncatus 30027
Urocyon cinereoargenteus 9243
Zalophus californianus 10314
Ziphius cavirostris 1608
Birds
Species Name (2006) GBIF total records
Actitis macularius 759695
Aimophila ruficeps 65683
Amazona oratrix 4040
Birds
Species Name (2006) GBIF total records
Anas americana 769168
Anas clypeata 1222929
Anas crecca 1544223
Anas cyanoptera 242469
Anas discors 625548
Anas platyrhynchos 5321407
Anhinga anhinga 263549
Anous minutus 9923
Anous stolidus 18121
Anser albifrons 270840
Antrostomus badius 286
Aramus guarauna 68637
Aratinga brevipes 59
Ardea alba 1745615
Ardea herodias 2768177
Arenaria interpres 428469
Arenaria melanocephala 74405
Aythya affinis 576103
Aythya americana 375321
Aythya collaris 708914
Aythya valisineria 257783
Bartramia longicauda 55866
Bubo virginianus 346998
Bubulcus ibis 716009
Bucephala albeola 1088414
Butorides virescens 661885
Cairina moschata 39686
Calidris alba 442865
Calidris alpina 785787
Calidris bairdii 93011
Calidris canutus 209527
Calidris fuscicollis 79309
Calidris himantopus 100035
Calidris mauri 248957
Calidris melanotos 224983
Calidris minutilla 665378
Calidris pusilla 299559
Calidris virgata 31110
Cardellina pusilla 474221
Cardinalis cardinalis 4923935
Cathartes aura 3037793
Cerorhinca monocerata 57914
Charadrius semipalmatus 406815
Charadrius vociferus 2056655
Charadrius collaris 11380
Charadrius melodus 82045
Charadrius montanus 9742
Charadrius nivosus 58313
Charadrius semipalmatus 406815
Charadrius wilsonia 50089
Birds
Species Name (2006) GBIF total records
Chen rossii 58938
Chlidonias niger 333686
Chloroceryle aenea 7767
Chloroceryle americana 53025
Cochlearius cochlearius 10101
Colaptes auratus 2779986
Columbina passerina 199023
Coragyps atratus 927262
Crotophaga sulcirostris 65036
Cyclarhis gujanensis 34185
Dendrocygna autumnalis 154927
Dendrocygna bicolor 32269
Diomedea immutabilis 12068
Phoebastria nigripes 28079
Egretta caerulea 442000
Egretta rufescens 86999
Egretta thula 921359
Egretta tricolor 84
Eudocimus albus 417347
Falco peregrinus 446209
Fregata magnificens 111273
Fregata minor 9664
Fulica americana 1424279
Gallinula galeata –
Gavia immer 684606
Geothlypis formosa 77686
Glaucidium griseiceps 702
Granatellus venustus 1253
Grus canadensis 407149
Haematopus palliatus 156285
Himantopus mexicanus 371001
Sterna caspia 522584
Icterus cucullatus 100503
Ixobrychus exilis 58689
Jacana spinosa 28789
Junco insularis 418
Larus heermanni 126108
Larus occidentalis 345745
Larus californicus 397694
Larus canus 991699
Larus delawarensis 2332775
Larus glaucescens 339761
Larus heermanni 126108
Larus livens 8544
Larus occidentalis 345745
Leucophaeus atricilla 354283
Leucophaeus pipixcan 117690
Limnodromus griseus 220370
Limnodromus scolopaceus 211052
Limosa fedoa 184455
Birds
Species Name (2006) GBIF total records
Megascops guatemalae 2126
Megascops kennicottii 33970
Melanitta perspicillata 304296
Melospiza lincolnii 405446
Melozone fusca 96609
Mergus serrator 967918
Mimus graysoni 288
Mycteria americana 157568
Myiarchus tuberculifer 69777
Numenius americanus 135299
Numenius phaeopus 343771
Nyctanassa violacea 162607
Nycticorax nycticorax 518518
Oceanodroma castro 7891
Oceanodroma homochroa 8692
Oceanodroma leucorrhoa 42643
Oceanodroma melania 13749
Oceanodroma microsoma 3391
Oceanodroma homochroa 8692
Oceanodroma leucorhoa 42643
Oceanodroma macrodactyla 243
Oceanodroma melania 13749
Oceanodroma microsoma 3391
Oceanodroma tethys 2770
Onychoprion anaethetus 13974
Onychoprion fuscatus 25889
Leiothlypis celata 605714
Leiothlypis peregrina 274762
Leiothlypis ruficapilla 382102
Oxyura jamaicensis 712019
Pandion haliaetus 1260662
Parkesia motacilla 131963
Parkesia noveboracensis 272477
Parula pitiayumi 2598
Passer domesticus 4253591
Passerina caerulea 258187
Patagioenas flavirostris 35987
Pelecanus erythrorhynchos 408913
Pelecanus occidentalis 549569
Phaethon aethereus 7070
Phalacrocorax auritus 2011586
Phalacrocorax penicillatus 115117
Phalacrocorax auritus 2011586
Phalacrocorax brasilianus 206314
Phalacrocorax pelagicus 138217
Phalacrocorax penicillatus 115117
Phalaropus fulicarius 47854
Phalaropus lobatus 142692
Phalaropus tricolor 138837
Pheugopedius felix 8225
Birds
Species Name (2006) GBIF total records
Phoebastria immutabilis 12068
Phoebastria nigripes 28079
Phoenicopterus ruber 30077
Piranga bidentata 10977
Platalea ajaja 142663
Pluvialis dominica 77650
Pluvialis fulva 66867
Pluvialis squatarola 588384
Podiceps nigricollis 296386
Podilymbus podiceps 1151778
Caracara lutosa 8
Porphyrio martinica 56656
Porzana carolina 210564
Pterodroma cookii 1617
Pterodroma neglecta 827
Pterodroma phaeopygia 7385
Ptychoramphus aleuticus 40503
Ptychoramphus aleuticus 40503
Puffinus auricularis 281
Puffinus opisthomelas 20441
Puffinus creatopus 40015
Puffinus griseus 108817
Puffinus opisthomelas 20441
Puffinus pacificus 82635
Puffinus tenuirostris 135042
Rallus limicola 147749
Recurvirostra americana 272007
Rissa tridactyla 194066
Rynchops niger 142333
Setophaga americana 506144
Setophaga castanea 107360
Setophaga cerulea 53571
Setophaga citrina 184752
Setophaga coronata 2350719
Setophaga discolor 190158
Setophaga dominica 178863
Setophaga fusca 206037
Setophaga magnolia 396048
Setophaga nigrescens 126652
Setophaga palmarum 527292
Setophaga pensylvanica 355131
Setophaga petechia 1212597
Setophaga pitiayumi 35953
Setophaga striata 231487
Setophaga tigrina 108848
Setophaga townsendi 202054
Setophaga virens 429440
Sphyrapicus varius 528884
Spinus psaltria 696736
Spiza americana 136864
Birds
Species Name (2006) GBIF total records
Stercorarius pomarinus 62305
Sterna anaethetus 13974
Sterna elegans 62405
Sterna fuscata –
Sterna maxima 272830
Sterna forsteri 429478
Sterna hirundo 646877
Sternula antillarum 161999
Sula granti 3087
Sula leucogaster 39534
Sula nebouxii 14032
Sula sula 9915
Sula dactylatra 9071
Sula leucogaster 39534
Sula nebouxii 14032
Synthliboramphus hypoleucus 7130
Synthliboramphus craveri 1678
Synthliboramphus hypoleucus 7130
Synthliboramphus scrippsi 4675
Sterna elegans 62405
Thalasseus maximus 272832
Sterna sandvicensis 237695
Tigrisoma mexicanum 14954
Toxostoma guttatum 236
Tringa flavipes 493255
Heteroscelus incana 34372
Tringa melanoleuca 717942
Tringa semipalmata 470248
Tringa solitaria 247133
Troglodytes tanneri 227
Troglodytes sissonii 379
Vermivora chrysoptera 52440
Vermivora cyanoptera 136467
Vireo flavoviridis 13908
Xema sabini 29919
Zenaida aurita 28124
Zenaida graysoni 207
Reptiles
Species Name (CAT, 2013) GBIF total records
Agkistrodon bilineatus 534
Anniella geronimensis 380
Anniella pulchra 3451
Anolis nebulosus 4011
Aspidoscelis ceralbensis 378
Aspidoscelis hyperythra 4471
Aspidoscelis tigris 31679
Aspidoscelis communis 1776
Aspidoscelis cozumela 481
Reptiles
Species Name (CAT, 2013) GBIF total records
Aspidoscelis rodecki 156
Gopherus agassizii 3123
Masticophis mentovarius 1585
Bipes biporus 3074
Boa constrictor 5790
Bogertophis rosaliae 47
Callisaurus draconoides 23722
Callisaurus draconoides 24128
Caretta caretta 26736
Charina trivirgata 386
Chelonia mydas 20487
Chilomeniscus stramineus 1021
Chilomeniscus savagei 17
Aspidoscelis bacatus –
Aspidoscelis canus –
Aspidoscelis carmenensis –
Aspidoscelis catalinensis –
Aspidoscelis ceralbensis 378
Aspidoscelis costata 3428
Aspidoscelis gularis 10691
Aspidoscelis hyperythra 4471
Aspidoscelis communis 1776
Aspidoscelis martyris –
Aspidoscelis estebanensis –
Coleonyx gypsicolus –
Coleonyx variegatus 6561
Crocodylus moreletii 3665
Crotalus mitchellii 475292
Crotalus atrox 9861
Crotalus oreganus 6530
Crotalus catalinensis 61
Crotalus cerastes 4385
Crotalus enyo 538
Crotalus estebanensis –
Crotalus stephensi 475305
Crotalus ruber 2623
Crotalus tigris 546
Crotalus atrox 9861
Crotaphytus dickersonae 284
Ctenosaura nolascensis –
Ctenosaura acanthura 822
Ctenosaura pectinata 2871
Ctenosaura similis 4174
Dermochelys coriacea 4433
Diadophis punctatus 19121
Leptophis diplotropis 741
Dipsosaurus dorsalis 7838
Mastigodryas melanolomus 2446
Elgaria cedrosensis 26
Elgaria multicarinata 8662
Reptiles
Species Name (CAT, 2013) GBIF total records
Eretmochelys imbricata 4774
Eridiphas slevini –
Gambelia copeii 189
Gambelia wislizenii 4864
Hypsiglena chlorophaea 391
Kinosternon integrum 4112
Lampropeltis catalinensis –
Lampropeltis herrerae –
Lampropeltis zonata 777
Lepidochelys olivacea 5910
Leptophis diplotropis 741
Rena humilis 753
Masticophis aurigulus 29
Masticophis bilineatus 16
Masticophis flagellum 1313
Coluber fuliginosus 355
Masticophis slevini 6
Mastigodryas melanolomus 1872
Micruroides euryxanthus 555
Oxybelis aeneus 4599
Pelamis platurus 1262
Petrosaurus repens 116
Petrosaurus slevini –
Petrosaurus thalassinus 1010
Phrynosoma coronatum 4182
Phrynosoma solare 1674
Phyllodactylus nocticolus 307
Phyllodactylus bugastrolepis 94
Phyllodactylus homolepidurus 366
Phyllodactylus partidus 51
Phyllodactylus unctus 742
Phyllodactylus xanti 1400
Phyllodactylus tuberculosus 2405
Phyllorhynchus decurtatus 2877
Pituophis catenifer 15394
Pituophis insulanus –
Pituophis vertebralis 55
Rhinocheilus etheridgei –
Salvadora hexalepis 2431
Sceloporus angustus 625
Sceloporus grandaevus 1050
Sauromalus hispidus 379
Sauromalus ater 2726
Sauromalus slevini 50
Sauromalus varius 325
Sceloporus clarckii 6843
Sceloporus hunsakeri 916
Sceloporus lineatulus 15
Sceloporus occidentalis 32209
Sceloporus orcutti 2804
Reptiles
Species Name (CAT, 2013) GBIF total records
Sceloporus smithi 160
Sceloporus variabilis 16407
Sibon nebulatus 1448
Sonora semiannulata 7124
Tantilla planiceps 387
Trimorphodon biscutatus 2389
Urosaurus nigricaudus 4514
Urosaurus ornatus 20571
Uta nolascensis 118
Uta palmeri 733
Uta squamata 312
Uta stansburiana 59717
Amphibians
Species Name (2011) GBIF total records
Anaxyrus cognatus (Bufo cognatus) 11315
Anaxyrus californicus (Bufo californicus) 1574
Anaxyrus punctatus (Bufo punctatus) 13143
Anaxyrus woodhousii (Bufo woodhousii) 21016
Aneides lugubris 5998
Batrachoseps major 5096
Anaxyrus punctatus (Bufo punctatus) 13143
Incilius alvarius 2197
Anaxyrus boreas 19304
Ensatina eschscholtzii 18034
Pseudacris regilla 25399
Hypopachus variolosus 4752
Incilius alvarius 2197
Leptodactylus fragilis 2289
Leptodactylus melanonotus 12435
Lithobates berlandieri 15354
Lithobates catesbeianus 28829
Lithobates forreri 3085
Lithobates yavapaiensis 2388
Pseudacris regilla 25399
Lithobates berlandieri 15354
Lithobates catesbeianus 28829
Lithobates forreri 3085
Lithobates yavapaiensis 2388
Scaphiopus couchii 12425
Smilisca baudinii 16555
Area loss, gains and net change for all species evaluated. Total number of pixels: number
of pixels in Mexico at 1 km2 resolution. #Unique data: number of unique georreferenced
data in a 1 km2 resolution cell. #Pixels: number of pixels in which de species is present.