Evolution of the formal quality indicators of the Web spaces of University Libraries in Spain
11
0
0
Texto completo
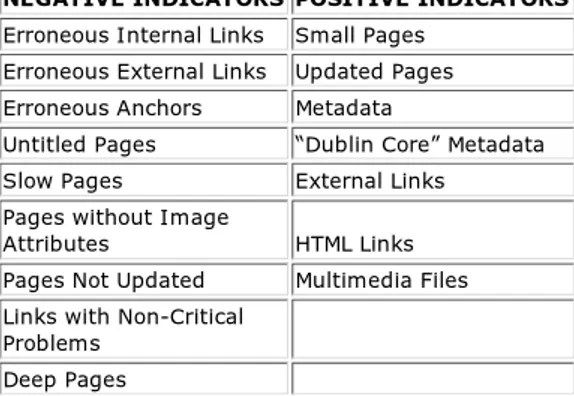
(2) Cybermetrics. Issues Contents: Vol. 13 (2009): Paper 1. Evolution of the.... 2 de 11. http://www.cindoc.csic.es/cybermetrics/articles/v13i1p1.html. evidenced by their various formal quality indicators over a period of six months. The selection in this study of formal quality indicators previously used by Faba-Pérez, Guerrero-Bote and Moya-Anegón (2004, 2005) in their investigations and, therefore, validated by them, allow us to ensure the objectivity of the results.. 2. Material and methods 2.1. Material Our study population comprises the web spaces of the university libraries throughout Spain. We obtained the population by contrasting the following official electronic sources: 1. Directory supplied by the Consejo Superior de Investigaciones Científicas (CSIC): http://www.csic.es/cbic/webuni.htm (January 2005) 2. Directory supplied by the Red de Bibliotecas Universitarias (REBIUN): http://bibliotecnica.upc.es/Rebiun/nova/directorios/bibliotecas_rebiun.asp (January 2005) 3. Directory supplied by RedIris : http://www.rediris.es/recursos/centros /univ.es.html (January 2005) Having compared these sources, and having eliminated from the study the library web space of the Universidad Alfonso X due to problems of restricted access, we elaborated a table with the 68 web spaces to be studied (Annex I). 2.2. Methodology In this section we delimit the formal quality indicators that will allow us to obtain objective data upon which to apply a model for web space evaluation based on the temporal evolution of the quality indicators. Following the methodology described by Faba-Pérez, Guerrero-Bote and Moya-Anegón (2004, 2005), Table I shows the indicators used. They are divided into negative and positive indicators depending on their significance with respect to information retrieval. This methodology has been chosen for their ability and strength to be applied to any field on the Internet, including university libraries. Table I. Formal Quality Indicators NEGATIVE INDICATORS POSITIVE INDICATORS Erroneous Internal Links. Small Pages. Erroneous External Links. Updated Pages. Erroneous Anchors. Metadata. Untitled Pages. “Dublin Core” Metadata. Slow Pages. External Links. Pages without Image Attributes. HTML Links. Pages Not Updated. Multimedia Files. Links with Non-Critical Problems Deep Pages Below is a brief description of each one. Negative indicators: Erroneous Internal Links: indicating the number of broken internal links of the web space. These misleading links constitute one of the major problems of a web space. Erroneous External Links: indicating the number of broken external links of the web space. The external links that misdirect the user are an even more important problem than the broken internal links. Both the external and the internal erroneous links can be traced to one of the following causes: File not found: the file in question may have been eliminated or moved, and cannot be located. Impossible to establish connection: if the Server where the linked file is situated is turned off, or too busy, the file cannot be accessed. Server not found: if Server of the linked file does not exist. Time out: a lack of coordination in the speed of reply of the linked Server and the waiting time of the navegator being used. Erroneous Anchors: indicating the number of wrong anchors of the web space, that is, the problems of hypertextual linking to parts of a document. The fact that they are erroneous impedes access to the information on the page and is therefore a negative indicator. Untitled Pages: they lack the hmtl tag “title”, or present empty contents. As the title will speed one´s grasp of the information to appear on a given page, its absence or the fact that it is empty must be considered a negative aspects.. 07/05/2009 16:53.
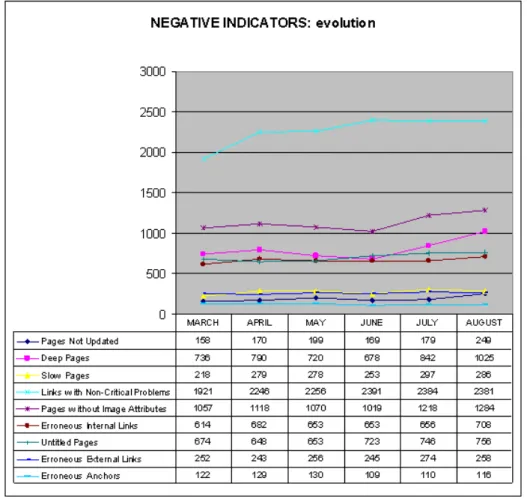
(3) Cybermetrics. Issues Contents: Vol. 13 (2009): Paper 1. Evolution of the.... 3 de 11. http://www.cindoc.csic.es/cybermetrics/articles/v13i1p1.html. Slow Pages: taking too long to download. It has been shown that the average waiting time for a user to download a page is 20 to 30 seconds, for pages under 50 KB in size. Therefore, if a web space has pages of a greater size, they might not be viewed by the user. Pages without Image Attributes: that is, lacking the tags “height”, “width” or “alt”. The first two attributes warn the navigator that there are images, and so less time is needed to interpret the pages; the alternative text gives a brief description of the image, allowing the user to visualize the pages without necessarily downloading the images. This reduces waiting time for the user, and so the lack of these attributes would constitute a problem for information access. Pages Not Updated: if pages have not been modified in the last six months, the information is likely to be obsolete. Therefore, information that is not updated periodically must be seen as a negative characteristic. Links with Non-Critical Problems: including links to web spaces that do not work properly for some relatively insignificant reason, usually one of three causes: Temporary redirection: this happens when the link to a file with a URL address resends it directly to another address that substitutes the first in a temporary way, causing a delay in the process. Permanent redirection: unlike the above, this happens when the file to be accessed has been moved or erased, and is redirected to the new address (the solution being to modify the URL of the target file). Others: they may be errors of the sort “No connect”, if the link is correct but the file is empty, or “Illegal Ref.”, when the route to the target file is assumed, or when there are minor problems regarding syntax. Deep Pages: these need more than four clicks on the mouse to move from the main page. From an informational standpoint, these pages interfere with access but not with contents (furthermore, the number of clicks is necessarily tied to the size of the web space), meaning it can be considered a slightly negative characteristic, of minor significance. Positive indicators: Small pages: less than 3 KB in size, meaning they can be downloaded quickly, and make it easier and faster for the user to view the information. Updated Pages: it is a positive characteristic when the pages have been modified in the past month. Metadata: meaning the different types of META tags, elements that must be placed at the head of the web pages and specify information about the document itself. We underline the convenience of Dublin Core (DC)metadata, which stand as an international and multidisciplinary attempt to establish a standard metadata model that defines a set of properties recommended for electronic bibliographic descriptions in order to favor interoperability among different descriptive models. External Links:having this type of links lends the web space two positive parameters: Luminosity —the more the links, the greater the luminosity— and External validity —the index of valid external links of the web space. In addition, the fact that one has external links that have been selected and evaluated following some quality criterion and that are reasonably updated would be a key quality indicator for assessing the contents of the space. HTML Links: The html links of every web space offer a view of the independence or autonomy of the web space. The greater the number of links, the less the degree of isolation, and therefore a more positive consideration. Multimedia Files: indicating the images and the audio and video files of each web space. Most of the research on design and evaluation of web spaces holds this to be a positive characteristic, though we must remember that at times their size may mean slow downloading. In order to obtain the data for each one of these formal quality indicators of the web spaces pertaining to the university libraries in Spain, we ran a market link examiner that crawled monthly (from March to August of 2005) over every web space of our population, automatically extracting the values associated with their indicators. Due to Web dynamics, before proceeding with this automatic monthly crawling over each one of the 68 URLs of study, we confirmed any possible variation thereof.. 3. Results and Discussion The graphs offered below show the global results obtained by applying the methodology of study. The first two figures (1 and 2) reveal the evolution over the six-month time span (March/August 2005) of the formal indicators for the set of 68 web spaces corresponding to Spain´s university libraries, on the basis of the mean values obtained for the indicators. Figures 3 and 4 show the evolution taking into account the distribution of the 68 university webs by region (one of the 17 Autonomous Communities of Spain, denoted AC) the overall averages obtained with regard to the quality indicators studied. In Figure 1, whose distributions are ordered in view of their increase over time, we see a generalized increase, from March through August, of all the negative indicators analyzed (except for the Erroneous Anchors, whose mean declines by 4.97%). Thus, the Pages No Updated increase 57.97%, the Deep Pages show an increase of 39.28%, the Slow Pages are 30.70% more prevalent, the Links with Non-critical Problems increase 23.93%, the Pages without Image Attributes increase by 21.41%, the Internal Erroneous Links by 15.30%, the Untitled Pages increase by 12.20%, and there are 2.32% more Erroneous. 07/05/2009 16:53.
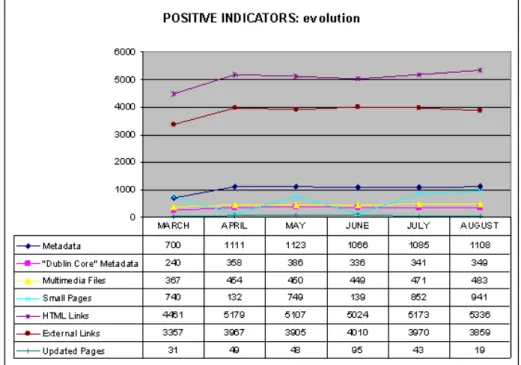
(4) Cybermetrics. Issues Contents: Vol. 13 (2009): Paper 1. Evolution of the.... 4 de 11. http://www.cindoc.csic.es/cybermetrics/articles/v13i1p1.html. External Links. On the other hand, as favorable aspects we can point out that the External Erroneous Links, a very negative quality indicator for Information retrieval, and therefore for virtual libraries as well (Faba-Pérez, 2003) is the negative characteristic showing the slightest increase over the period of study.. Figure 1.Monthly evolution of the average negative indicators of the web spaces of Spain´s university libraries (March/August 2005). With regard to the evolution of the positive indicators of the web spaces analyzed (Figure 2, shown according to temporary increase in the positive indicators), we can also see an overall increase of these positive indicators from March through August, except in the case of Updated Pages, where a sharp drop of 37.21% is observed. This generalized increase is reflected in the 58.37% growth of Metadata and the 45.55% increase in “Dublin Core” Metadata, the 31.46% increase in Multimedia Files, a 27.12% increase in Small Pages, a 19.61% increase in HTML Links, and the 14.97% augment in External Links. We stress that the Metadata constitute an essential element for information retrieval, and that the Dublin Core is a worthy multidisciplinary and worldwide means of establishing an international model for metadata to define a set of recommended properties for electronic bibliographic description, thus promoting operability among different descriptive models. That is, these are critical indicators for showing the quality of virtual library web spaces and their respective services (Méndez-Rodríguez, 2002). For this reason, it is noteworthy that these two quality indicators evidence the greatest evolution over time.. 07/05/2009 16:53.
(5) Cybermetrics. Issues Contents: Vol. 13 (2009): Paper 1. Evolution of the.... 5 de 11. http://www.cindoc.csic.es/cybermetrics/articles/v13i1p1.html. Figure 2. Monthly evolution of the average positive indicators of the web spaces of Spain´s university libraries (March/August 2005) If we compare Figures 1 and 2, we see that of the total 16 quality indicators analyzed (nine negative and seven positive), seven follow a positive evolution, as the one negative indicator decreases and six positive indicators increase over the period of study. Table II, meanwhile, shows the mean values obtained for the set of negative indicators of the web spaces of the university libraries (given in decreasing order in the final column) grouped by the AC or region within Spain, and by the increase (%) that they undergo in the six-month period. Table II. By Autonomous Community of Spain: mean negative indicators of the web spaces of university libraries. Increase from March to August, 2005.. CASTILLA-LEÓN MADRID CANTABRIA VALENCIA CANARIAS BALEARES CATALUÑA NAVARRA ANDALUCÍA ARAGÓN CASTILLA-LA MANCHA PAÍS VASCO GALICIA EXTREMADURA LA RIOJA MURCIA ASTURIAS. MARCH APRIL 128 339 155 224 1768 2043 1540 1551 68 81 149 171 1506 1476 136 135 743 807 221 242 924 952 454 439 1188 1187 18 15 13 13 77 80 255 571. MAY 286 230 1289 1531 79 175 1518 139 821 237 956 433 1151 15 13 84 522. JUNE 283 233 1342 1339 82 189 1639 146 800 234 962 424 1181 15 13 45 501. JULY AUGUST INCREASE % 286 287 124.04 232 234 50.67 1371 2416 36.70 1878 1995 29.51 84 87 27.47 185 185 24.09 1739 1813 20.39 152 156 14.25 800 811 9.20 230 234 5.89 965 976 5.60 443 467 2.67 1184 1186 -0.12 15 15 -15.00 14 10 -19.30 45 46 -40.21 124 123 -51.70. The graphic representation of Table II (Figure 3) shows that 70.59% of the ACs (12 out of 17) witnesses an unfavorable evolution over time (March to August) of the mean negative indicators associated with the university webs. In favorable contrast however, Galicia, Extremadura, La Rioja, Murcia and Asturias exhibit a decline in negative features over time in terms of these indicators (0.12%, 15%, 19.30%, 40.21% and 51.70% respectively). The ACs are listed in the figure in order of greater to lesser negative indicators.. 07/05/2009 16:53.
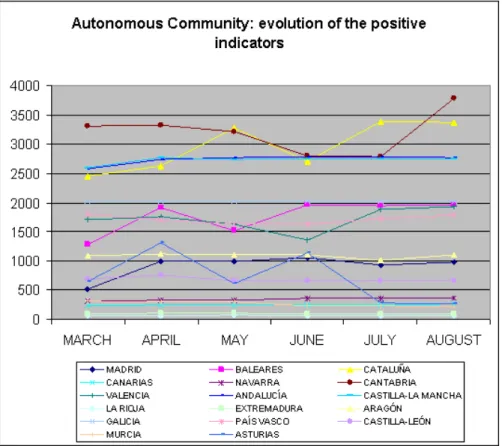
(6) Cybermetrics. Issues Contents: Vol. 13 (2009): Paper 1. Evolution of the.... 6 de 11. http://www.cindoc.csic.es/cybermetrics/articles/v13i1p1.html. Figure 3. By Autonomous Community: monthly evolution of the negative indicators of Spain´s university libraries (March/August 2005). In Table III (ordered top to bottom in the column “Increase”) one can see the mean values of the set of positive indicators of the web spaces of the university libraries of study, again grouped by AC or region, as well as the percentage-wise increase over the six months of follow-up. Table III. By Autonomous Community: mean values for positive indicators of the web spaces of Spain´s university libraries. Increase from March to August, 2005.. MADRID BALEARES CATALUÑA CANARIAS NAVARRA CANTABRIA VALENCIA ANDALUCÍA CASTILLA-LA MANCHA LA RIOJA EXTREMADURA ARAGÓN GALICIA PAÍS VASCO CASTILLA-LEÓN MURCIA ASTURIAS. MARCH APRIL 523 990 1288 1915 2454 2618 230 250 312 326 3309 3319 1706 1753 2579 2733 2589 66 99 1089 2022 1799 701 314 652. 2759 71 104 1127 2024 1711 764 304 1309. MAY 996 1510 3271 251 331 3217 1634 2771. JUNE 1052 1954 2699 256 369 2791 1359 2784. 2730 73 105 1113 2032 1636 657 308 612. 2748 58 100 1113 2023 1629 664 239 1144. JULY AUGUST INCREASE % 937 975 86.52 1951 1956 51.90 3387 3375 37.55 261 270 17.39 364 364 16.66 2782 3778 14.17 1876 1931 13.23 2790 2761 7.08 2749 67 99 1008 2025 1729 671 235 283. 2746 69 101 1114 2028 1782 671 229 264. 6.09 4.09 2.60 2.31 0.31 -0.96 -4.32 -26.99 -59.46. Figure 4 offers a graphic illustration of the evolution of the positive indicators of study. We see that 76.47% of the ACs (13 out of 17) present a favorable evolution from March to August in terms of the positive indicators associated with web services in the libraries. In other words, nearly all the virtual university libraries of Spain undergo a significant improvement in quality according to these criteria, ranging from the 86.52% rise evidenced in the Autonomous Community of Madrid, to the very discreet 0.31% improvement seen in Galicia. Increases of over 10% are seen for Baleares (51.90%), Cataluña (37.55%), Canarias (17.39%), Navarra (16.66%), Cantabria (14.17%) and Valencia (13.23%). The only ACs that show an unfavorable evolution —here, understood as a decrease in positive indicators for their university libraries— are País Vasco, Castilla-León, Murcia and Asturias.. 07/05/2009 16:53.
(7) Cybermetrics. Issues Contents: Vol. 13 (2009): Paper 1. Evolution of the.... 7 de 11. http://www.cindoc.csic.es/cybermetrics/articles/v13i1p1.html. Figure 4. By Autonomous Community: monthly evolution of the positive indicators of web spaces in Spain´s university libraries (March/August 2005). A comparison of Tables II and III reveals quite favorable developments in five of the ACs in terms of negative indicators that are on the decline (Galicia, Murcia, La Rioja, Extremadura and Asturias); and 13 ACs in terms of positive indicators on the rise (Madrid, Cataluña, Andalucía, Valencia, Navarra, Galicia, Canarias, Baleares, Cantabria, Castilla-La Mancha, La Rioja, Extremadura and Aragón). Only three (La Rioja, Extremadura and Galicia) coincide in optimal positions: that is, with rising positive indicators and decreasing negative indicators. It is important to point out, however, that La Rioja and Extremadura have only one university library, and Galicia has just three. Meanwhile, there are two Autonomous Communities that show the opposite evolution, as they suffer a temporary increase with regard to negative indicators as well as a decrease in positive indicators: Castilla-León (seven libraries analyzed) and País Vasco (two libraries). The interpretation of the results expounded here calls for some consideration of the fact that only moderate correlation exists (0.43)between the increase in negative indicators and the number of web spaces of the university libraries analyzed in each of Spain´s Autonomous Communities; and only substantial correlation exists (0.53) between the increase in positive characteristics and the number of virtual university libraries studied in each AC (see Table IV, ordered by number of libraries studied). Table IV. Increase in the formal quality indicators from March to August (2005) of the ACs and the web spaces of each. AC MADRID CATALUÑA ANDALUCÍA CASTILLA-LEÓN VALENCIA NAVARRA GALICIA MURCIA CANARIAS PAÍS VASCO BALEARES CANTABRIA CASTILLA-LA MANCHA LA RIOJA EXTREMADURA ARAGÓN ASTURIAS. Increase Increase NEGATIVE INDICATORS POSITIVE INDICATORS 50.67 86.52 20.39 37.55 9.20 7.08 124.04 -4.32 29.51 13.23 14.25 16.66 -0.12 0.31 -40.21 -26.99 27.47 17.39 2.67 -0.96 24.09 51.90 36.70 14.17 5.60 6.09 -19.30 4.09 -15.00 2.60 5.89 2.31 -51.70 -59.46. Nº Web Spaces analyzed 14 11 11 7 5 3 3 3 2 2 1 1 1 1 1 1 1. 4. Conclusions The results obtained and expounded here with regards to the evolution of formal quality indicators. 07/05/2009 16:53.
(8) Cybermetrics. Issues Contents: Vol. 13 (2009): Paper 1. Evolution of the.... 8 de 11. http://www.cindoc.csic.es/cybermetrics/articles/v13i1p1.html. applied to the web spaces of Spain´s university libraries over a six-month period of study (March through August 2005) lead us to formulate the following conclusions about their virtual evolution and that of the respective Autonomous Communities, at least insofar as their university library services are concerned: A separate analysis of the two groups of quality indicators (negative/positive) reveals an increase over time in both senses: the negative factors, or problems that impede full and efficient use of the web space services, are on the rise; while at the same time there is a favorable increase in the positive characteristics studied here, understood as those that facilitate and speed up user access to the services offered. The fact that 11.11% of the negative indicators (1 of 9) and 85.71% of the positive indicators (6 of 7) undergo a favorable evolution would suggest that there is indeed growing interest on the part of virtual libraries within Spain´s university system to improve their services, the bulk of evidence lying in the gradual increase in the positive indicators of their webs. Joint analysis of the indicators shows that seven of the 16 quality indicators studied (precisely, 43.75%) trace a path of positive evolution, as the negative indicators drop while the positive ones rise. Most noteworthy is the finding that, among the signs of improvement, 85.71% (6 out of 7) correspond to positive indicators, with the use of Metadata and DC Metadata at the lead. If we bear in mind that the web spaces studied belong to university library systems, and that DC Metadata were introduced for the purpose of conforming a standard referential unit, or a set of properties that might be upheld internationally for use in electronic bibliographic descriptions, these findings lead us to affirm that the virtual university libraries of Spain are indeed gradually incorporating such recommendations in their designs, in a general (but not unanimous) effort to offer enhanced quality to the user. If we break down our results by Autonomous Community within Spain, other findings come to light: Analysis of the ACs shows the evolution of the negative indicators and that of the positive indicators do not exactly go hand in hand. Whereas only 29.41% ACs exhibit favorable progress in terms of the negative indicators, 76.47% show a favorable increase in positive indicators. Thus we may affirm that most ACs are gradually adopting positive trends in the web spaces of their university libraries. If we look at the ACs in view of both negative and positive criteria, we notice that the regions of La Rioja, Extremadura and Galicia stand out in evolutionary terms, in that their positive characteristics increase and their negative ones decrease. In other words, these would be the Autonomous Communities of Spain best positioned on the evolutionary scale of electronic library services in the University setting, as determined by the methodology applied here. This finding, in turn, leads us to emphasize the need for Spain´s diverse regions to progressively incorporate improved elements in their web spaces, along the lines of the quality indicators described here. The lack of a very strong statistical correlation (> 0.700; Ferreiro-Aláez, 1993) between the evolution of the indicators used in our study and the number of the university libraries analyzed here for each Autonomous Community within Spain, leads us to conclude that changes over time in the indicators are not influenced (negatively or positively) by the number of university libraries associated with each Autonomous Community.. 5. References Bar-Ilan, J. (2001). Data collection methods on the Web for informetric purposes: a review and analysis. Scientometrics, 50(1):7-32. Bar-Ilan, J. (2004a). A microscopic link analysis of academic institutions within a country – the case of Israel. Scientometrics, 59(3):391-403. Bar-Ilan, J. (2004b). Self-linking Scientometrics, 59(1):29-41.. and. self-linked rates of academic institutions on the Web.. Bawden, D. and Rowlands, I. (1999). Digital libraries: assumptions and concepts. Libri, 49:181-191. Chao, H. (2002). Assessing the quality of academic libraries on the Web: the development and testing of criteria. Library & Information Science Research, 24:169-194. Clausen, H. (1999). Evaluation of library Web sites: the Danish case. The Electronic Library, 17(2):83-87. Clyde, L.A. (1996). The library as information provider: the home page. The Electronic Library, 14(6):549-558. Clyde, L.A. (2004). School library Web sites: 1996-2002. The Electronic Library, 22(2):158-167. Craven, J. (2000). Electronic Access for All: Awareness in Creating Accessible Web Sites for the University Library. Disability and Information Systems in Higher Education (DISinHE). <http://www.dmag.org.uk/resources/casestudies/cravenfull.asp> (9 September 2007). Faba-Pérez, C. (2003). Análisis cibermétrico de la información WEB: El caso de Extremadura en Internet. Ph.D. Thesis, Universidad de Granada. Faba-Pérez, C., Guerrero-Bote, V.P. and Moya-Anegón, F. (2004). Fundamentos y técnicas cibermétricas. Mérida: Junta de Extremadura. Faba-Pérez, C., Guerrero-Bote, V.P. and Moya-Anegón, F. (2005). Self-Organizing Maps in Web Spaces based on Formal Characteristics. Information Processing and Management, 41:331-346. Falk, H. (1999). Library web site innovations. The Electronic Library, 17(5):323-328.. 07/05/2009 16:53.
(9) Cybermetrics. Issues Contents: Vol. 13 (2009): Paper 1. Evolution of the.... 9 de 11. http://www.cindoc.csic.es/cybermetrics/articles/v13i1p1.html. Ferreiro-Aláez, L. (1993). Bibliometría: análisis bivariante. Madrid: Espasa. Fitzgerald, M.A. and Galloway, C. (2001). Relevance judging, evaluation, and decision making in virtual libraries: a descriptive study. Journal of the American Society for Information Science and Technology, 52(12):989-1010. Joint, N. (2001). Designing interfaces for distributed electronic collections: the lessons of traditional librarianship. Libri, 51:148-156. Li, X., Thelwall, M., Wilkinson, D. and Musgrove, P. (2005a). National and international university departmental Web site interlinking. Part 1: validation of departmental link analysis. Scientometrics, 64(2):151-185. Li, X., Thelwall, M., Wilkinson, D. and Musgrove, P. (2005b). National and international university departmental Web site interlinking. Part 2: link patterns. Scientometrics, 64(2):187-208. Méndez-Rodríguez, E. (2002). Metadatos y recuperación de información: estándares, problemas y aplicabilidad en bibliotecas digitales. Gijón: Trea. Nicholas, D., Huntington, P. and Williams, P. (2002). Evaluating metrics for comparing the use of web sites: a case study of two consumer health web sites. Journal of Information Science, 28(1):63-75. Novljan, S. and Žumer, M. (2004). Web pages of Slovenian public libraries: evaluation and guidelines. Journal of Documentation, 60(1):62-76. Osorio, N. L. (2001). Web sites of science-engineering libraries: an analysis of content and design. Issues in Science and Technology Librarianship, Winter. <http://www.library.ucsb.edu/istl/01winter/refereed.html> (21 March 2005). Park, H. and Thelwall, M. (2006). Web science communication in the age of globalization: Links among universities’ websites in Asia and Europe. New Media & Society, 8(4):631-652. Pinto-Molina, M., Alonso-Berrocal, J.L., Cordón-García, J.A., Fernández-Marcial, V., García-Figuerola, C., García-Marco, J., Gómez-Camarero, C. and Zazo-Rodríguez, A.F. (2005). Quality assessment of Spanish universities’ web sites focused on the European Research Area. Scientometrics, 65(1):67-93. Providenti, M. (2004). Library Web Accessibility at Kentucky's 4-year Degree Granting Colleges and Universities. D-Lib Magazine, 10 (9) <http://www.dlib.org/dlib/september04/providenti /09providenti.html> (24 August 2007). Qiu, J., Chen, J. and Wang, Z. (2004). An analysis of backlink counts and Web Impact Factors for Chinese university websites. Scientometrics, 60(3):463-473. Ramos-Simón, L.F. (1995). Dirección, administración y marketing de empresas e instituciones documentales. Madrid: Síntesis. Ramos-Simón, L.F. (2003). Introducción a la administración de información. Madrid: Síntesis. Schmetzke, A. (2005). Web Accessibility at University of Wisconsin Libraries. Wisconsin Association of Academic Librarians (WAAL), Newsletter, 22(3): 5-9 <http://www.wla.lib.wi.us /waal/newsletter/223.html#webaccess> (9 September 2007). Smith, A. G. (1999). The impact of web sites: a comparison between Australasia and Latin America <http://www.vuw.ac.nz/~agsmith/publns/austlat/>(14 March 2005). Spindler, T. (2002). The Accessibility of Web Pages for Mid-sized College and University Libraries. Reference and User Services Quarterly, 42(2): 149-154 <http://digitalcommons.rwu.edu /cgi/viewcontent.cgi?article=1000ycontext=librarypub> (15 July 2007). Stover, M. and Zink, S. D. (1996). World Wide Web home page design: patterns and anomalies of higher education library home pages. Reference Services Review, Fall:7-20. Thelwall, M. (2008). Bibliometrics to Webometrics. Journal of Information Science, 34(4):605-621. Thelwall, M. and Smith, A.G. (2002). Interlinking Scientometrics, 55(3):363-376.. between. Asia-Pacific. University Web. sites.. Thelwall, M. and Zuccala, A. (2008). A university-centred European Union link analysis, Scientometrics, 75(3):407-420. Thomas, O. and Willett, P. (2000). Webometric analysis of departments of librarianship and information science. Journal of Information Science, 26(6):421-428. Woodruff, A., Aoki, P.M., Brewer, E., Gauthier, P., and Rowe, L.A. (1996). An investigation of documents from the World Wide Web. Computer Networks and ISDN Systems, 28(7-11):963-ss <http://www2.parc.com/istl/projects/uir/pubs/items/UIR-1996-21-WoodruffWWW5-WWW.pdf> (20 May 2005). ******. Appendix ANNEX I. Web spaces of Spain´s university libraries AC. URL (LIBRARY) http://www.etea.com/biblioteca/bibetea. ANDALUCÍA. http://desaual.ual.es/web/pInicio.jsp?id=7442 http://biblioteca.uca.es/ http://www.uco.es/webuco/buc/. UNIVERSITY ETEA, Institución Universitaria de la Compañía de Jesús Universidad de Almería Universidad de Cádiz Universidad de Córdoba. 07/05/2009 16:53.
(10) Cybermetrics. Issues Contents: Vol. 13 (2009): Paper 1. Evolution of the.... 10 de 11. http://www.cindoc.csic.es/cybermetrics/articles/v13i1p1.html. http://www.ugr.es/~biblio/ http://www.uhu.es/biblioteca/default.htm http://www.ujaen.es/serv/biblio/ http://www.uma.es/servicios/biblioteca/ http://bib.us.es/index.asp. Universidad de Granada Universidad de Huelva Universidad de Jaén Universidad de Málaga Universidad de Sevilla Universidad Internacional de http://www.unia.es/biblioteca_unia/default_biblio.html Andalucía http://www.upo.es/serv/bib/bib.htm Universidad Pablo de Olavide ARAGÓN http://wzar.unizar.es/doc/buz/unizar.html Universidad de Zaragoza ASTURIAS http://buo.uniovi.es/ Universidad de Oviedo BALEARES http://www.uib.es/servei/biblioteca/ Universitat de les Illes Balears http://papyrus.bbtk.ull.es/index.htm Universidad de La Laguna CANARIAS http://biblioteca.ulpgc.es/ Universidad de Las Palmas CANTABRIA http://www.buc.unican.es/ Universidad de Cantabria CASTILLA LA Universidad de Castilla-La http://www.biblioteca.uclm.es/ MANCHA Mancha http://www.ubu.es/biblioteca/ Universidad de Burgos http://www.ucavila.es/servicios Universidad Católica de Ávila /mostrar_servicios2.php?id=32 http://biblioteca.unileon.es/indice.shtml Universidad de León Universidad de Salamanca CASTILLA LEÓN http://sabus.usal.es/bibliotecas.htm http://almena.uva.es/ Universidad de Valladolid http://www.upsa.es/~/servicios/biblioteca Universidad Pontificia de /biblioteca.html Salamanca http://www.usek.es/servicios/biblioteca/biblioteca.htm Universidad SEK de Segovia Universidad Autónoma de http://www.bib.uab.es Barcelona http://www.bib.ub.es/bub/ebub.htm Universidad de Barcelona http://www.uvic.es/biblioteca/ca/inici.html Universidad de Vic http://www.upf.edu/bib/ Universidad Pompeu Fabra http://www.url.es/cas/se001.htm Universidad Ramón Llull Universidad Ramón Llull http://www.esade.es/biblio/ CATALUÑA ESADE Universitat Politécnica de http://bibliotecnica.upc.es/ Catalunya http://biblioteca.udg.es/ Universitat de Girona http://www2.bib.udl.es/ Universitat de Lleida Universitat Oberta de http://biblio.uoc.es/ Catalunya http://www.urv.es/biblioteca Universitat Rovira i Virgili EXTREMADURA http://biblioteca.unex.es/ Universidad de Extremadura Universidad de Santiago de http://busc.usc.es/ Compostela GALICIA http://www.uvigo.es/biblioteca/index.es.htm Universidad de Vigo http://www.udc.es/biblioteca/galego/index.htm Universidade da Coruña LA RIOJA http://biblioteca.unirioja.es/ Universidad de La Rioja Real Colegio Universitario http://www.rcumariacristina.com Escorial-María Cristina /esp/portada1.php?idSub=23 Universidad Antonio de http://www.nebrija.com/servicios/biblioteca/index.htm Nebrija Universidad Autónoma de http://biblioteca.uam.es/ Madrid http://www.ucjc.es/biblioteca/index.htm Universidad Camilo José Cela Universidad Carlos III de http://www.uc3m.es/uc3m/serv/BIB/indice.php Madrid Universidad Complutense de http://www.ucm.es/BUCM/ Madrid http://www.uah.es/servi/biblioteca/inicio.htm Universidad de Alcalá MADRID Universidad Europea de http://www.uem.es/web/buem/index.htm Madrid http://213.229.161.87/web/alumnos Universidad Francisco de /biblioteca_y_centro_de_doc._europea/default.asp Vitoria http://biblioteca.uned.es/lenya/bibliuned Universidad Nacional de /live/index.html Educación a Distancia Universidad Politécnica de http://www.upm.es/bibliotecas/ Madrid http://www.upco.es/webcorporativo/Servicios Universidad Pontificia Comillas /biblioteca/ http://www.urjc.es/z_files/ac_biblio/nuevaweb/ Universidad Rey Juan Carlos http://www.ceu.es/paginaceu.asp?idpagina=3936 Universidad San Pablo- C.E.U. Universidad Católica San http://www.ucam.edu/biblioteca/ Antonio MURCIA http://www.um.es/biblioteca/ Universidad de Murcia Universidad Politécnica de http://www.bib.upct.es/ Cartagena http://www.unav.es/biblioteca/indice.html Universidad de Navarra http://www.iese.edu/es/ConocimientoeInvestigacion Universidad de Navarra - IESE NAVARRA /Library/Library.asp Universidad Pública de http://brocar.unavarra.es/biblio2.htm Navarra PAÍS VASCO http://www.biblioteca.deusto.es/ Universidad de Deusto. 07/05/2009 16:53.
(11) Cybermetrics. Issues Contents: Vol. 13 (2009): Paper 1. Evolution of the.... 11 de 11. VALENCIA. http://www.cindoc.csic.es/cybermetrics/articles/v13i1p1.html. http://www.biblioteca.ehu.es/ http://www.ua.es/es/bibliotecas/index.html http://www.uji.es/cd/ http://www.umh.es/frame.asp?url=/bibliotecas/ http://www.upv.es/bib/ http://www.uv.es/~infobib/index_c.html. Universidad del País Vasco Universidad de Alicante Universitat Jaume I Universidad Miguel Hernández Universidad Politécnica de Valencia Universitat de València. Received 3/November/2008 Accepted 9/February/2009. Copyright information | Editor | Webmaster | Sitemap Updated: 05/06/2009. 07/05/2009 16:53.
(12)
Figure

+2
Documento similar
Keywords: iPSCs; induced pluripotent stem cells; clinics; clinical trial; drug screening; personalized medicine; regenerative medicine.. The Evolution of
Astrometric and photometric star cata- logues derived from the ESA HIPPARCOS Space Astrometry Mission.
The photometry of the 236 238 objects detected in the reference images was grouped into the reference catalog (Table 3) 5 , which contains the object identifier, the right
Díaz Soto has raised the point about banning religious garb in the ―public space.‖ He states, ―for example, in most Spanish public Universities, there is a Catholic chapel
What is perhaps most striking from a historical point of view is the university’s lengthy history as an exclusively male community.. The question of gender obviously has a major role
We seek to characterize the transport in a time-dependent flow by identifying coherent structures in phase space, in particular, hyperbolic points and the associated unstable and
To contribute to the development of local community & enhancement of life quality in Gaza & Palestine5. To promote universal values & mutual cultural understanding
Students who wish to attend the Spanish Language Course should be in Malaga before the following dates at the very latest:.. • First semester students (September
