Serum cholesterol is a significant and independent
mortality predictor in liver cirrhosis patients
Martin Janicko,* Eduard Veselíny,* Dušan Leško,** Peter Jarcuška*
*1st Department of Internal Medicine, ** 1st Department of Surgery, Pavol Jozef Safárik University Kosice, Trieda SNP 1, Kosice, Slovakia, 04001.
ABSTRACT
Background and Aim. Accurate assessment of cirrhotic patient’s prognosis is essential for decisions regar-ding the course of treatment. Therefore we aimed to confirm and quantify the predictive value of serum cholesterol and serum triglycerides in liver cirrhosis patients. Material and methods. We performed a re-trospective observational cohort study on consecutive patients with liver cirrhosis (n = 191). Relevant clini-cal and laboratory variables were obtained from patients‘ charts and patients were followed for two months. Mortality was the main outcome. Results. Thirty-eight patients died in the follow-up period. Signi-ficant difference was observed in the level of total serum cholesterol between surviving and deceased pa-tients (2.27 ± 1.02 mmol/L vs. 2.97 ± 1.00 mmol/L, P < 0.0001 respectively). Cholesterol was confirmed as a significant predictor of mortality in univariate logistic regression analysis, and independent predictor besi-de bilirubin, creatinine and MELD score in multivariate logistic regression analysis. Addition of serum cho-lesterol level to a prognostic model based on total bilirubin, creatinine and INR increased its accuracy by 4%. Adding cholesterol to the MELD score improved prediction accuracy by 3%. There was no significant difference in serum levels of triglycerides between surviving and deceased patients. Conclusion. Serum cholesterol is a routinely measured parameter, which has independent prognostic value in patients with liver cirrhosis.
Key words. Liver cirrhosis. Cholesterol. Lipoproteins. Mortality. Prognosis.
Correspondence and reprint request: Assoc. Prof. Peter Jarcuška, M.D., Ph.D.
1st. Department of Internal Medicine, P.J. Šafárik University. Trieda SNP 1, Košice 040 01. Slovakia.
Tel./Fax: +421 55 6403-510 E-mail: [email protected]
Manuscrip received: November 11, 2012. Manuscrip accepted: January 16, 2013. INTRODUCTION
Liver cirrhosis is a disease with relatively limited treatment options that eventually leads to liver transplant or death. Because of this natural course of the disease, the accurate assessment of individual patient’s prognosis is essential for decisions regard-ing the course of treatment.
Cholesterol and triglycerides are the basic lipids that are the cornerstone of energetic homeostasis. The liver, together with muscle and fat tissue, has a central role in their metabolism. Serum levels of cho-lesterol and triglycerides are, to a large extent,
in-fluenced by their intake from food, but after a period of fasting, their serum levels are maintained by lipo-lysis in fatty tissue and lipoprotein particle synthesis in the liver. The energy demand after a period of fasting is satisfied mainly by glycogenolysis and gluco-neogenesis in the liver. Glycogen reserves in cirrhotic liver are substantially reduced,1 so the balance is shifted on gluconeogenesis, which has a very large functional reserve even in cirrhotic liver.2 ATP need-ed for this process comes from lipolysis in fatty tis-sue. Cirrhotic patients also suffer from malnutrition and loss of subcutaneous fat which is the main source of fatty acids and triglycerides after fasting.
Routinely measured serum total cholesterol is a sum of lipoprotein particles with high, low, interme-diate and very low density (HDL, LDL, IDL a VLDL). Out of these, VLDL particles are almost exclusively synthesized in the liver and secreted in the bloodstream. IDL and LDL particles are derived from VLDL after loss of free fatty acids. HDL parti-cles are, to a large extent, also created in the liver, but their production in the small bowel is also important.3
^ ^
^ ^ ^
Since advanced liver disease cause progressive decline of serum levels of cholesterol and triglycerides, this could provide additional prognostic infor-mation. Therefore the aim of our study was to confirm the prognostic value of serum cholesterol and triglycerides in cirrhotic patients.
MATERIAL AND METHODS
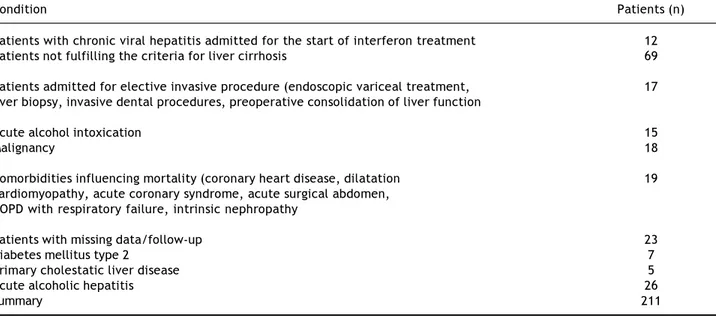
We conducted a retrospective cohort observatio-nal study, which included consecutive patients ad-mitted to the 1st Department of Internal Medicine, University Hospital, Košice, Slovakia in 2002 to 2007 with diagnosis of alcoholic liver cirrhosis (ICD-10 code K70.3), toxic liver disease with fibro-sis and cirrhofibro-sis (K71.7), and liver fibrofibro-sis and cir-rhosis (K74). Exclusion criteria, summarized in table 1, were designed to minimize the influence of other comorbidities on either mortality or serum li-poprotein levels. Patients with acute alcoholic he-patitis were excluded because the possibility of excesive liver delipidization after alcohol withdrawal (Zieve syndrome) that could mask true lipoprotein levels.16
Relevant data, which included age, sex, etiology of liver cirrhosis, comorbidities, duration of hospita-lization and follow-up, serum creatinine, INR, bili-rubin, cholesterol, triglycerides, were extracted from patients’ charts. All test were performed in Košice University hospital laboratories on Advia 1650 au-toanalyzer by Siemens (Germany). Only results ob-tained after overnight fasting were considered.
Diagnosis of liver cirrhosis was reevaluated ac-cording to following criteria:
• Morphologic-typical appearance of the liver on ultrasound (nodular surface, heterogeneous echogenity, reduced vasculature, hypertrophy of the caudate lobe) or CT (heterogeneous density, nodular appearance).
• Laboratory parameters of liver function failure (elevated INR, bilirubin, decreased albumin lev-els and/or thrombocytopenia).
• Clinical signs of liver cirrhosis and portal hyper-tension (spider naevi, caput medusae, ascites, esophageal varices, splenomegaly). At least one condition from each of the three groups needed to be present to confirm the diagnosis of cirrhosis. Liver biopsy was not required.
MELD score was calculated from obtained para-meters according to formula {0.378 x ln [serum bili-rubin (µmol/l)] + 1.12 x ln (INR) + 0.957 x ln (serum creatinine (µmol/L)} and Child-Pugh score and class were determined.4
Patients were followed at least for two months pe-riod, which is a maximal time between scheduled check-ups for patients with advanced liver cirrhosis in our institution. Mortality was the main outcome, there were no secondary outcomes.
The study was approved by institutional ethics committee and performed according to the Declara-tion of Helsinki. Informed consent was obtained from all patients at the time of admission.
Table 1. Exclusion criteria.
Condition Patients (n)
Patients with chronic viral hepatitis admitted for the start of interferon treatment 12
Patients not fulfilling the criteria for liver cirrhosis 69
Patients admitted for elective invasive procedure (endoscopic variceal treatment, 17 liver biopsy, invasive dental procedures, preoperative consolidation of liver function
Acute alcohol intoxication 15
Malignancy 18
Comorbidities influencing mortality (coronary heart disease, dilatation 19
cardiomyopathy, acute coronary syndrome, acute surgical abdomen, COPD with respiratory failure, intrinsic nephropathy
Patients with missing data/follow-up 23
Diabetes mellitus type 2 7
Primary cholestatic liver disease 5
Acute alcoholic hepatitis 26
Statistical analyses
Data is presented as median (range) for data with non-normal distribution or mean ± standard de-viation for data with normal distribution. Data was tested by Kolmogorov-Smirnov test for normality. Differences among continuous variables with nor-mal distibution were analyzed by t-test and among continuous variables with non-normal distribution by Mann-Whitney test. Risk of mortality was asses-sed by univariate and multivariate logistic regres-sion analyses. Bootstrapping analysis was used in conjunction with multivariate logistic regression, using 500 bootstrap samples of the same size as the study sample created by random selection with replacement from the study sample. Separate regres-sion was performed on each of these bootstrap sam-ples and predictors were considered robust when they were found significant in at least 70% of the samples. Statistical analyses were performed in SPSS statistical software, version 17.
RESULTS
A total of 402 patients with specified diagnoses were identified in the records. Two hundred eleven patients were excluded (Table 1). Observation cohort included of 191 patients, 131 (69%) males, 60 (31%) females. All patients with alcoholic liver disease ceased to use alcohol during follow-up mainly because severity of the disease or hospitalization. Mortality rate was 20% (38 patients) at the end of the study period. Variceal bleeding developed in 17.9%, renal failure in 24.6% (hepatorenal syndrome specifically in 8.4%) and spontaneous bacterial peritonitis in 15.2% of patients. Hepatic encephalo-pathy had 18.8% of patients.
In patients who died, most common immediate cause of death was liver failure in 62.9% followed by variceal bleeding in 17.2% and pneumonia in 17.1%. One patient (2.9%) died from severe sepsis.
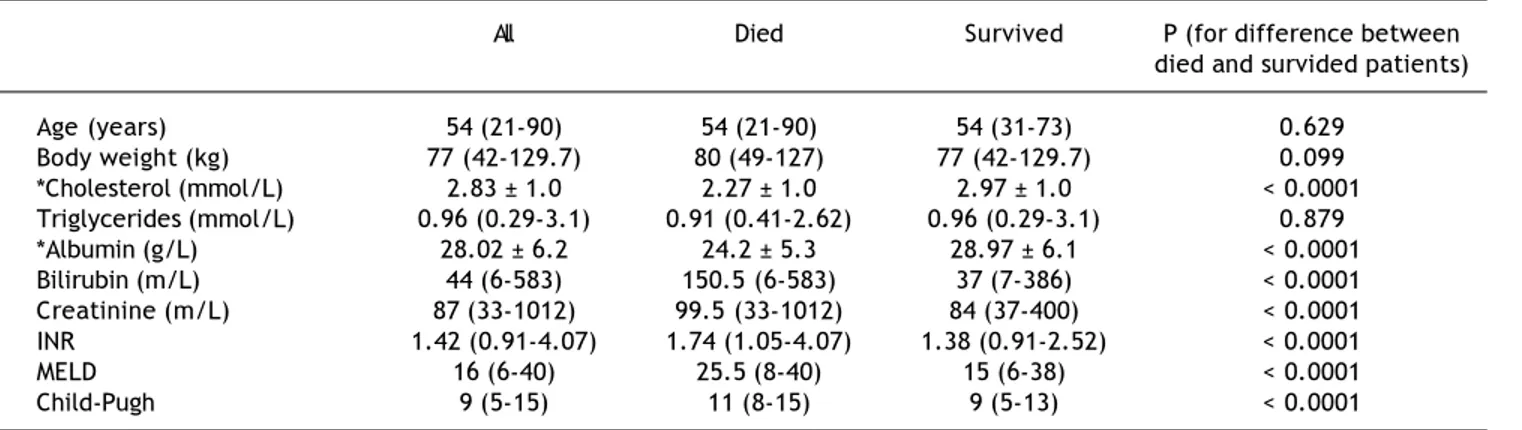
Mean levels of selected parameters in a group of patients who died and who survived are shown in table 2. There was no difference in age or body weight between two groups. As expected, there was significant difference between these patients in total serum cholesterol (2.27 ± 1.02 vs. 2.97 ± 1.00 mmol/L, P < 0.0001). Unexpectedly, no difference in serum triglycerides was observed between two groups (1.09 ± 0.51 vs. 1.07 ± 0.5 mmol/L;
Table 2. Clinical and laboratory parameters of the study cohort.
All Died Survived P (for difference between
died and survided patients)
Age (years) 54 (21-90) 54 (21-90) 54 (31-73) 0.629
Body weight (kg) 77 (42-129.7) 80 (49-127) 77 (42-129.7) 0.099
*Cholesterol (mmol/L) 2.83 ± 1.0 2.27 ± 1.0 2.97 ± 1.0 < 0.0001
Triglycerides (mmol/L) 0.96 (0.29-3.1) 0.91 (0.41-2.62) 0.96 (0.29-3.1) 0.879
*Albumin (g/L) 28.02 ± 6.2 24.2 ± 5.3 28.97 ± 6.1 < 0.0001
Bilirubin (m/L) 44 (6-583) 150.5 (6-583) 37 (7-386) < 0.0001
Creatinine (m/L) 87 (33-1012) 99.5 (33-1012) 84 (37-400) < 0.0001
INR 1.42 (0.91-4.07) 1.74 (1.05-4.07) 1.38 (0.91-2.52) < 0.0001
MELD 16 (6-40) 25.5 (8-40) 15 (6-38) < 0.0001
Child-Pugh 9 (5-15) 11 (8-15) 9 (5-13) < 0.0001
*Denotes variable with normal distribution of values. All other variables have non-normal distribution.
Figure 1. ROC curves for cholesterol and triglycerides for two months mortality.
Sensitivity
1.0
0.8
0.6
0.4
0.2
0.0
0.0 0.2 0.4 0.6 0.8 1.0
P = 0.879). There was a significant difference between patients who survived and who died in already established parameters of liver function.
Predictive value of each individual variable was assessed by univariate logistic regression (Table 3) and also ROC analysis for cholesterol and triglyceri-des (Figure 1). Area under ROC for mortality pre-diction for serum cholesterol was 0.72; (95% CI 0.625-0.814; P < 0.0001 for difference from 0.5) as compared to serum triglycerides [0.491 (95% CI 0.391-0.592); P = 0.868 for difference from 0.5]. To-tal serum cholesterol, as well as other liver and kid-ney function parameters, was found to be significant predictors of mortality. On the other hand, serum triglycerides were not found to have predictive value.
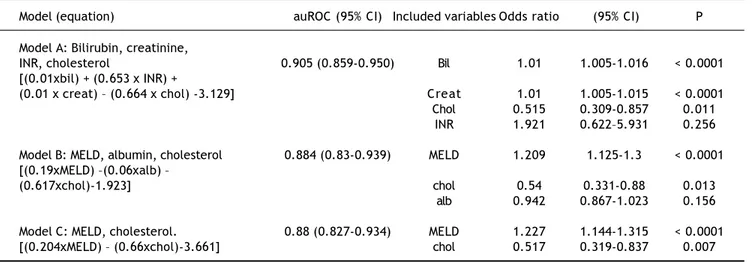
Variables found to be significant mortality predic-tors in the univariate analysis were subsequently evaluated by multivariate logistic regression. Three models, each containing cholesterol, in combination with other parameters of liver and kidney function,
were evaluated (Table 4). All three models have MELD score for 2-moths mortality.Figure 2. ROC curves for predictive models A, B, C and
Table 3. Prognostic value of some laboratory and clinical variables.
P Odds ratio 95% C.I. for OR
Cholesterol < 0.0001 0.437 0.281-0.680
Triglycerides 0.878 1.057 0.519-2.152
Bilirubin < 0.0001 1.010 1.006-1.014
Creatinine < 0.0001 1.008 1.004-1.012
INR < 0.0001 8.561 3.397-21.275
Albumin < 0.0001 0.875 0.82-0.933
MELD < 0.0001 1.234 1.152-1.322
Table 4. Prognostic value of serum cholesterol in multivariate regression analysis models.
Model (equation) auROC (95% CI) Included variables Odds ratio (95% CI) P
Model A:Bilirubin, creatinine,
INR, cholesterol 0.905 (0.859-0.950) Bil 1.01 1.005-1.016 < 0.0001
[(0.01xbil) + (0.653 x INR) +
(0.01 x creat) – (0.664 x chol) -3.129] Creat 1.01 1.005-1.015 < 0.0001
Chol 0.515 0.309-0.857 0.011
INR 1.921 0.622–5.931 0.256
Model B:MELD, albumin, cholesterol 0.884 (0.83-0.939) MELD 1.209 1.125-1.3 < 0.0001 [(0.19xMELD) –(0.06xalb) –
(0.617xchol)-1.923] chol 0.54 0.331-0.88 0.013
alb 0.942 0.867-1.023 0.156
Model C:MELD, cholesterol. 0.88 (0.827-0.934) MELD 1.227 1.144-1.315 < 0.0001
[(0.204xMELD) – (0.66xchol)-3.661] chol 0.517 0.319-0.837 0.007
Creat: serum creatinine. bil: total bilirubin. alb: serum albumin. chol: total serum cholesterol.
Sensitivity
1.0
0.8
0.6
0.4
0.2
0.0
0.0 0.2 0.4 0.6 0.8 1.0
1-Specificity Model A Model B Model C MELD
performed better than chance in mortality prediction for 2 months (-2 log likelihood 115.840, for model A and 126.261 for model B and 128.278 for model C vs.
190.598 for null model; P < 0.0001). In all three mo-dels, serum cholesterol was found to be significant and independent mortality predictor. The strongest mortality predictor based on bootstrapping analysis (variable appearing significant in the most of the bootstrapping samples) in our cohort was MELD score (appearing in 100% of bootstrap samples), fol-lowed by total bilirubin (99.8% of samples) and crea-tinine (99.4% of samples). Cholesterol was the fourth strongest mortality predictor (appearing in nearly 80% of bootstrap samples). Albumin and INR were not identified as an independent predictor of mortality, but, because of their correlations with other model components (INR with total bilirubin R 0.574, P < 0.001; albumin with MELD R -0.432, P < 0.001) were deemed redundant. Addition of serum cholesterol in the model with total bilirubin, creatinine and INR increased the prediction accuracy by 4% when compared by auROC analysis, complete model A attained auROC 0.905. Model B achieved auROC 0.865, adding cholesterol improved its accuracy by almost 2%, and model C had auROC 0.88 and cholesterol added 3% to the accuracy of predictions (Figure 2).
We have tried to identify cut-off values with corresponding sensitivity, specificity, positive predictive value and negative predictive value for the presented models and for cholesterol separately that could be used in clinical praxis (Table 5). For comparison we also present these values for TG, but note that this parameter was not found to be a sig-nificant mortality predictor. Cut-off values for cho-lesterol and triglycerides were selected to be easily clinically recognizable. We present three different cut-off value for serum cholesterol with diffe-rent sensitivity and specificity values that could be
useful in different clinical circumstances. For pre-diction models A, B and C values with highest sensi-tivity and specificity were used as cut-off values.
DISCUSSION
Decreased serum levels of lipoproteins in cirrhotic patients were repeatedly observed in experimental5 as well as in clinical studies. There are even morta-lity data concerning hypocholesterolemia and dysli-pidemia in liver cirrhosis available.6,7 Presented results confirm that cirrhotics have lower serum levels of total cholesterol and these results were documented on a large cohort of patients.
First evidence of prognostic importance of serum cholesterol was published by D‘Arienzo in 1998. Authors of this paper demonstrated on 34 cirrhotic patients with advanced liver failure (Child-Pugh C) that there was a statistically significant 75% difference in survival between patients with total serum cholesterol over 125 mg/dL and patients with total serum cholesterol under 125 mg/dL.8
The situation changes if cholesterol is perceived in the context of other mortality predictors. Presen-ted results of multivariate regression analysis suggest that serum cholesterol is a significant and independent mortality predictor beside bilirubin, creatinine and even MELD score. Surprisingly, serum albumin and INR were not found to be signi-ficant independent mortality predictors probably due to presented correlations. This means that serum levels of total cholesterol can be used to improve the predictive accuracy of MELD score. Addition of cholesterol improved accuracy of predictions based only on bilirubin, creatinine and albumin by 4%.
Odds ratio of serum cholesterol, as determined by regression analysis, could also quantify the effect of this parameter on determination of survival proba-bility. Odds ratio derived from presented data
Table 5. Cut-off values of prediction models and cholesterol with corresponding sensitivity, specificity, positive and negative prediction values.
Cut-off PPV (%) NPV (%) Sensitivity (%) Specificity (%) Accuracy (%)
Cholesterol 3 mmol/L 27.3 90.1 79 47.7 53.9
2.5 mmol/L 33.8 88.9 65.8 68 67.5
2 mmol/L 40 86.6 47.4 82.4 75.4
Triglycerides (ns) 1 mmol/L 79.6 19.4 51 47.3 50.3
Model A -1.4213 57.7 94.2 79 85.6 84.3
Model B -1.5371 50.8 96 86.8 79.1 80.6
Model C -1.8307 45.3 96.6 89.5 73.2 76.4
ranges from 0.437 in univariate analysis to 0.515 and 0.54 in multivariate analysis (model A and mo-del B). Survival probability therefore rises by approximately 50% when serum cholesterol rises by 1 unit. Jiang, et al. published results of a study on 198 patients with cirrhosis designed specifically to assess predictive value of total cholesterol, triglyceri-des, LDL and HDL cholesterol. Out of these four parameters only total cholesterol and MELD score were found to be independent predictors of mortality. Unfortunately total cholesterol level in this study was not used as a scale variable, but as ordinal variable with two categories (≤ 2.8 mmol/L and > 2.8 mmol/L).9 Llovet, et al. tried to identify prognostic factors in 64 cirrhotic patients with spontaneous bacterial peritonitis. Authors reported that serum cholesterol was one of seven independent prognostic factors associated with hospital mortality with hazard ratio 0.46.6
The decrease of serum cholesterol in liver cirrho-sis is likely caused by a plethora of pathogenetic mechanisms. Moreover, routinely measured total serum cholesterol is a mix of lipoprotein particles that contain apolipoproteins, triglycerides and free fatty acids beside cholesterol molecule itself. There-fore the serum level of total cholesterol is dependent on metabolism of all these molecules. In presented study, serum levels of cholesterol and triglycerides were determined after an overnight fasting. In this postabsorptive period is liver the main place for free fatty acids and cholesterol synthesis.10,11 Liver cir-rhosis causes reduced effectivity of energy proces-sing as well as reduced synthesis of apolipoproteins.
Apolipoproteins, one of the basic components of lipoprotein particles, are created mainly in the liver and small intestine, but liver is the most important producer after fasting.12 Liver synthetic functions are generally reduced in liver cirrhosis but Imbert-Bis-muth, et al. demonstrated that liver fibrosis progres-sion specifically decreases the synthetic capacity for apolipoprotein A1, the main component of HDL par-ticles.13 This apolipoproteins is also a cofactor for lecithin:cholesterol acyl transferase which is respon-sible for cholesterol esterification.11 Apolipoprotein B-100 is the main protein component of LDL particles which is produced in the liver and its serum levels are also decreased in chronic liver disease.14
Contrary to serum cholesterol, serum triglyceri-des did not have any prognostic information in our cohort of patients. There was no difference in the mean levels of triglycerides in patients who survived and who died. Triglycerides were not found to be significant predictors of mortality in univariate
regression. In a paper presented by Jiang, et al. this parameter also has not been found relevant to the mortality of patients.9 This could be caused by variety of reasons. We could only speculate that ca-tabolism caused by liver failure could cause mobiliza-tion of fat reserves which could subsequently cause elevation of serum triglycerides. This also means that triglyceride levels are influenced to a large degree by fat reserves, but unfortunately we have no data regar-ding energetic and substrate metabolism as well as fat distribution and reserves in our cohort. Positive correlation of triglycerides with serum bilirubin could point out that in liver failure the absorption capacity of hepatocytes for triglycerides could be impaired.
Individual fractions of total cholesterol were not determined in our study, but their predictive value could be interesting. Habib, et al. demonstrated on a cohort of 413 patients that HDL cholesterol has pre-dictive value for mortality on liver cirrhosis patients that is even higher that predictive value of total cholesterol. The authors propose that this result is caused by relative highest content of apolipoproteins in HDL particles.15 This result was unfortunately not confirmed by subsequent study.9 The discrepan-cy might be caused by the fact that the cohort in the study by Habib, et al. consisted of 98% males. The-refore significant bias was introduced because of dif-ferent distribution and metabolism of fat between sexes. Moreover authors themselves admit that it is difficult, in the presence of liver cirrhosis, to deter-mine the LDL level by Friedewald formula.
Data obtained in this study suggest that total serum cholesterol has significant prognostic infor-mation in liver cirrhosis. This inforinfor-mation is inde-pendent on the levels of other established predictors –INR, bilirubin, albumin, creatinine or MELD score. Total serum cholesterol is cheap and routine-ly measured parameter that could help in the deci-sions regarding therapy of patients with advanced liver cirrhosis.
REFERENCES
1. Krahenbuhl L, Lang C, Ludes S, Seiler C, Schafer M, Zim-mermann A, Krahenbuhl S. Reduced hepatic glycogen sto-res in patients with liver cirrhosis. Liver Int 2003; 23: 101-9.
2. Vogt J. Gluconeogenesis in patients with impaired liver function. Zeitschrift fur Ernahrungswissenschaft 1997; 36: 364-7.
3. Wang TY, Newby LK, Chen AY. Hypercholesterolemia para-dox in relation to mortality in acute coronary syndrome.
Clinical Cardiology 2009; 32: E22-E28.
5. Cicognani C, Malavolti M, Morselli-Labate AM, Zamboni L, Sama C, Barbara L. Serum lipid and lipoprotein patterns in patients with liver cirrhosis and chronic active hepatitis. Archives of internal medicine. 1997; 157: 792-6.
6. Llovet JM, Planas R, Morillas R, Quer JC, Cabre E, Boix J, Humbert P, et al. Short-term prognosis of cirrhotics with spontaneous bacterial peritonitis: multivariate study. Am J Gastroenterol 1993; 88: 388-92.
7. Milani A, Marra L, Siciliano M, Rossi L. Prognostic signifi-cance of clinical and laboratory parameters in liver cirrho-sis. A multivariate statistical approach.
Hepato-gastroenterology 1985; 32: 270-2.
8. D’Arienzo A, Manguso F, Scaglione G, Vicinanza G, Benna-to R, Mazzacca G. Prognostic value of progressive de-crease in serum cholesterol in predicting survival in Child-Pugh C viral cirrhosis. Scand J Gastroenterol 1998; 33: 1213-8.
9. Jiang M, Liu F, Xiong WJ. Combined MELD and blood lipid level in evaluating the prognosis of decompensated cirrho-sis. World J Gastroenterol 2010; 16: 1397-401.
10. Charlton-Menys V, Durrington PN. Human cholesterol me-tabolism and therapeutic molecules. Experimental physio-logy 2008; 93: 27-42.
11. Davidson M, Jacobson TA. How Statins Work: The Develo-pment of Cardiovascular Disease and Its Treatment With 3-Hydroxy-3-Methylglutaryl Coenzyme A Reductase Inhi-bitors. Medscape. (Serial online) 2001 13.4.2011. (Cited 13.4.2011). Available from: http://www.medscape.org/ viewprogram/608
12. Malmendier CL, Delcroix C, Lontie JF. Kinetics of a hete-rogeneous population of particles in low density lipopro-tein apolipoprolipopro-tein B. Atherosclerosis 1989; 80: 91-100. 13. Imbert-Bismut F, Ratziu V, Pieroni L, Charlotte F,
Benha-mou Y, Poynard T. Biochemical markers of liver fibrosis in patients with hepatitis C virus infection: a prospective study. Lancet 2001; 357: 1069-75.
14. Shah SS, Desai HG. Apolipoprotein deficiency and chro-nic liver disease. J Assoc Physicians India 2001; 49: 274-8.
15. Habib A, Mihas AA, Abou-Assi SG. High-density lipoprotein cholesterol as an indicator of liver function and prognosis in noncholestatic cirrhotics. Clin Gastroenterol Hepatol
2005; 3: 286-91.
16. Fernández Pérez FJ, Pallarés Manrique H, Cabello Ramírez M. Zieve’s syndrome. A case report. Rev Esp Enferm Dig