Serum natremia affects health-related quality of life in
patients with liver cirrhosis: a prospective, single centre study
Ewa Wunsch,* Grzegorz Naprawa,† Dorota Koziarska,‡ Malgorzata Milkiewicz,§ Przemyslaw Nowacki,‡ Piotr Milkiewicz*,||
* Liver Research Laboratories, Pomeranian Medical University, Szczecin, Poland.
† Department for Internal Medicine, A. Sokolowski Hospital, Szczecin, Poland. ‡ Department of Neurology, Pomeranian Medical University, Szczecin, Poland. § Medical Biology Laboratory, Pomeranian Medical University, Szczecin, Poland.
|| Liver Unit, Department of General Surgery and Liver Transplantation, Warsaw Medical University, Warsaw, Poland.
Correspondence and reprint request: Ewa Wunsch, M.D.
Liver Unit, Pomeranian Medical University, Al. Powstancow Wlkp. 72, 70-111, Szczecin, Poland.
Tel./Fax: +48 91 8139435 E-mail: [email protected]
Manuscript received: August 22, 2012. Manuscript accepted: October 09, 2012.
INTRODUCTION
Various factors such as ascites, overt hepatic en-cephalopathy (HE) or anemia may impair daily func-tioning of patients with liver cirrhosis,1 however the effects of serum electrolytes or minimal HE, com-monly seen in patients with end-stage liver disease on health-related quality of life (HRQoL) have not yet been fully established.
ABSTRACT
Introduction. Hyponatremia is associated with high mortality and predicts hepatic encephalopathy but its
effect on health-related quality of life remains to be established. Material and methods. In this study we prospectively analyzed the relationship between hyponatremia, clinical features and quality of life in a co-hort of 116 patients with cirrhosis. Chronic Liver Disease Questionnaire and Medical Outcomes Study 36-Item Short Form Health Survey were performed to assess quality of life. Evaluation of hepatic encephalopathy included West-Haven criteria, Psychometric Hepatic Encephalopathy Score and Critical Flicker Frequency analysis. Severity of liver disease was assessed with Child–Pugh score and MELD. Univaria-te and multivariaUnivaria-te analysis were implemenUnivaria-ted to evaluaUnivaria-te the influence of analyzed factors on quality of life. Results. Multivariate analysis has identified serum natremia, Psychometric Hepatic Encephalopathy Score, Critical Flicker Frequency and severity of liver disease measured with MELD and Child-Pugh score as independent factors affecting quality of life in patients with cirrhosis. West Heaven criteria failed to show the relationship with quality of life in analyzed subjects. Serum kalemia showed correlation with neither quality of life, hepatic encephalopathy nor severity of the disease. Conclusion. In patients with cirrhosis serum natremia along with severity of liver disease and hepatic encephalopathy exerts a significant effect on patients’ quality of life.
Key words. Severity of liver disease. Chronic Liver Disease Questionnaire. Medical Outcomes Study 36-Item Short
Form Health Survey. Serum natremia. Hepatic encephalopathy.
Hyponatremia is a serious complication of liver cirrhosis.2,3 It is associated with a high morbidity and mortality both before and post transplanta-tion.4-8 The main underlying pathology leading to hyponatremia in patients with advanced liver cirr-hosis is an impaired solute-free water clearance cau-sed by circulatory dysfunction and abnormal non-osmotic hypersecretion of vasopressin.9 It results in renal retention of water that is out of proportion to the retention of sodium, producing expanded extracellular fluid volume with ascites and edema. This pathogenic pathway expresses a strong relationship with the development of hepatorenal syndrome which is one of the most dreadful complication of cirrhosis.10
transplantation. This referred also to the values at the upper limit of a still normal range.11 Literature on the effect of natremia and kalemia on HRQoL in liver cirrhosis is extremely scanty.12,13
Although overt HE is a well known factor affect-ing HRQoL, the effect of minimal HE on patients HRQL remains controversial.14-16
In order to address these issues we analyzed the effect of several clinically important factors on HRQL in patients with liver cirrhosis.
MATERIAL AND METHODS
Patients
One hundred thirty four consecutive patients with liver cirrhosis treated at our institution were prospectively assessed for this study. Cirrhosis was confirmed with liver biopsy and/or typical presenta-tion on imaging studies. Child–Pugh score and MELD were used in the assessment of the severity of liver disease. Exclusion criteria comprised factors impairing the neuropsychological examination, such as consumption of psychotropic drugs, active alco-hol misuse, vision disturbance, other than liver disease severe medical problems influencing HRQoL (such as decompensated diabetes mellitus, renal in-sufficiency requiring dialyses, malignancy, heart fa-ilure ≥ NYHA II, rheumatoid arthritis or asthma) and inability to complete the questionnaires. As eig-hteen patients met the exclusion criteria 116 sub-jects were eventually included into the project.
Assessment of HRQoL
Chronic Liver Disease Questionnaire (CLDQ) and the Medical Outcomes Study 36-Item Short Form Health Survey (SF-36) were performed in all pa-tients. The CLDQ, a disease-specific measure of HRQoL, evaluates the impact of chronic liver disea-se on the patient’s daily living.17 It consists of 29 items grouped into 6 domains (abdominal symptoms, systemic symptoms, fatigue, activity, emotional functions and worry). The scores for the six do-mains and the CLDQ summary score are calculated, with the results presented on a 7-point Likert scale, with higher scores indicating better HRQoL.
SF-36 is a generic HRQoL tool, that has been widely used and validated in various conditions.18 It contains 36 items grouped into domains of physical health (physical functioning, role limitation-physical, bodily pain and general health) and mental health (vitality, social functioning, role limitation-emotional
and mental health). Each item is scored between 0 and 100 points, with higher scores indicating bet-ter HRQoL. Points represent the percentage of total possible score achieved. The scores from those items are then averaged together, for a calculation of a fi-nal score within each of the eight health domains measured. Two summary scores, physical component and mental component are obtained. A license was obtained for the use of the SF-36 questionnaire in this study.
Evaluation of HE
The evaluation of HE included West Haven cri-teria,19 psychometric and neurophysiological as-sessment based on two recently recommended methods: the Psychometric Hepatic Encephalopa-thy Score (PHES) and critical flicker frequency (CFF).20-23
PHES, a battery of 5 paper–pencil tests (num-ber connection test-A, num(num-ber connection test-B, the digit symbol test, the line tracing test and the serial dotting test) is a sensitive, valid and reliable neuropsychological tool for the quantifi-cation of minimal HE.23-25 Because of the influence of the ethnicity on PHES previously defined Polish normative data have been used to evaluate obtained data.15 According to our standardization the summary PHES score was calculated as the sum of six subtest and ranged between + 16 and - 18 points. The abnormal cut-off value of the mean PHES sum was set at - 5 points. A detailed description of PHES scoring system is presented elsewhere.15
CFF has been used for a measurement of a broad variety of neurophysiological qualities associated with function of cerebral cortex.26 It has been re-cently found to be an objective, reproducible and sensitive diagnostic tool for the assessment of mini-mal HE.21,27-29 CFF values were estimated using a validated analyzer (HEPAtonorm Analyzer®; Lab Automation Network, Tübingen, Germany). All pa-tients completed the tests after an appropriate ex-planation and demonstration. According to data obtained by Kircheis, et al. CFF mean values < 39 Hz was considered abnormal.30 Minimal HE was diagnosed when at least one of two above tests was abnormal.
Ethics
was approved by the appropriate ethics committee of Pomeranian Medical University and conforms to the ethical guidelines of the 1975 Declaration of Helsinki (6th revision, 2008).
Statistics
Patient measures are reported as means ± stan-dard deviation (SD). Data were analyzed using Stat-View-5 Software (SAS Institute, Cary, NC, US) and included χ2, χ2 with Yates correction, Fisher’s exact and ANOVA analysis. Categorical data were compa-red using Levene’s test for equality of variances, and both pooled-variances and separate-variances t-tests for equality of means. Correlation-coefficient analysis was performed with Spearman test. Independent pre-dictive factors of Mental and Physical components of SF-36 and CLDQ summary score were identified
by forward stepwise regression method. A p value < 0.05 was considered statistically significant.
RESULTS
Out of the 116 analyzed patients 68 (58.6 %) were males and 48 (41.4%) females, aged 18-84 years (52.3 ± 11.9 years). Demographic and clinical data on in-cluded subjects are shown in table 1. Neither age nor alcoholic etiology of cirrhosis influenced HRQoL in analyzed patients, however women showed impaired quality of life on SF-36 when compared to men (p < 0.05 for Physical Component, p < 0.01 for Mental Component). These data are shown in tables 2-4.
Severity of liver disease
Severity of liver disease correlated with poor qua-lity of life measured with:
Table 1. Demographic, clinical and biochemical data of cirrho-tic patients.
Demografic data Study group (n = 116)
Age (years, mean ± SD, range) 52.3 ± 11.9 (18-84) Gender (male/female) 68 (58.6%)/48 (41.4%) Etiology of liver cirrhosis
Alcoholic 47 (40.5%) Viral hepatitis 21 (18.1%) Autoimmune 24 (20.7%)
Other 20 (17.2%)
Mixed 4 (3.5%)
Child-Pugh class
A 55 (47.4%)
B 44 (37.9%)
C 17 (14.7%)
MELD (score, mean ± SD, range) 13.4 ± 5.7 (6-40) Ascites (yes/no) 37 (31.9%)/79 (68.1%) Previous overt HE (yes/no) 62 (53.4%)/54(46.6%) Na (mmol/L, mean ± SD, range) 136.2 ± 4.4
(118.0-145.0) K (mmol/L, mean ± SD, range) 4.3 ± 0.6
(2.6-6.2) Creatinine (mg/dL, mean ± SD, range) 0.8 ± 0.6 (0.3-5.9) INR (mean, ± SD range) 1.35 ± 0.3
(1.0-2.4) Albumin (g/L, mean ± SD, range) 3.5 ± 0.6 (2.3-5.0) Bilirubin (mg/dL, mean ± SD, range) 4.3 ± 6.5 (0.2-43.0)
MELD: Model of end-stage liver disease. INR: international ratio.
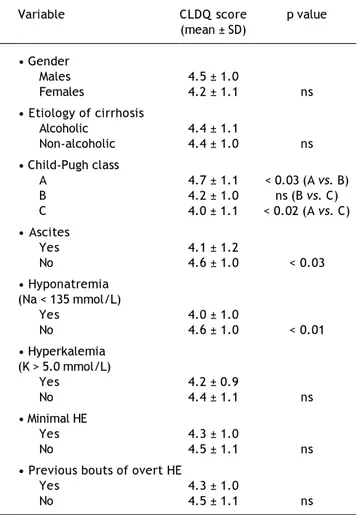
Table 2. Relationship between CLDQ score and analyzed factors.
Variable CLDQ score p value (mean ± SD)
• Gender
Males 4.5 ± 1.0
Females 4.2 ± 1.1 ns • Etiology of cirrhosis
Alcoholic 4.4 ± 1.1
Non-alcoholic 4.4 ± 1.0 ns • Child-Pugh class
A 4.7 ± 1.1 < 0.03 (A vs. B) B 4.2 ± 1.0 ns (B vs. C) C 4.0 ± 1.1 < 0.02 (A vs. C) • Ascites
Yes 4.1 ± 1.2
No 4.6 ± 1.0 < 0.03 • Hyponatremia
(Na < 135 mmol/L)
Yes 4.0 ± 1.0
No 4.6 ± 1.0 < 0.01 • Hyperkalemia
(K > 5.0 mmol/L)
Yes 4.2 ± 0.9
No 4.4 ± 1.1 ns
• Minimal HE
Yes 4.3 ± 1.0
No 4.5 ± 1.1 ns
• Previous bouts of overt HE
Yes 4.3 ± 1.0
No 4.5 ± 1.1 ns
• CLDQ (p < 0.05, CI95% = -0.392 - -0.042 for Child-Pugh classification and p < 0.01, CI95% = -0.410 - -0.061 for MELD).
• Physical Component of SF-36 (p < 0.001, CI95% = -0.498 - -0.173 for Child-Pugh classification and p < 0.0001, CI95% = -0.514 - -0.192 for MELD). • Mental Component of SF-36 (p < 0.05, CI95% =
-0.407 - -0.054 for Child-Pugh classification and p < 0.01, CI95% = -0.457 - -0.114 for MELD).
Also patients with ascites showed impaired daily functioning in all scales used (Tables 2-4). In the multivariate analysis severity of liver disease was an independent factor affecting Physical Component of SF-36 (Table 5), but not Mental Component of SF-36 and CLDQ score (data not shown).
Table 3. Relationship between Physical component of SF-36 score and analyzed factors.
Variable Physical component p value (mean ± SD
• Gender
Males 54.7 ± 21.4
Females 46.2 ± 22.7 < 0.05
• Etiology of cirrhosis
Alcoholic 50.9 ± 23.5
Non-alcoholic 51.5 ± 21.5 ns
• Child-Pugh class
A 59.7 ± 19.2 < 0.005 (A vs. B) B 46.5 ± 22.4 ns (B vs. C) C 37.6 ± 21.3 < 0.0005 (A vs. C) • Ascites
Yes 43.5 ± 22.3
No 56.5 ± 22.3 < 0.005
• Hyponatremia (Na < 135 mmol/L)
Yes 42.4 ± 23.0
No 55.9 ± 20.5 < 0.002
• Hyperkalemia (K > 5.0 mmol/L)
Yes 50.1 ± 19.7
No 51.5 ± 22.7 ns
• Minimal HE
Yes 48.1 ± 22.5
No 54.6 ± 21.2 ns
• Previous bouts of overt HE
Yes 45.8 ± 22.9
No 56.1 ± 20.7 < 0.02
HE: hepatic encephalopathy.
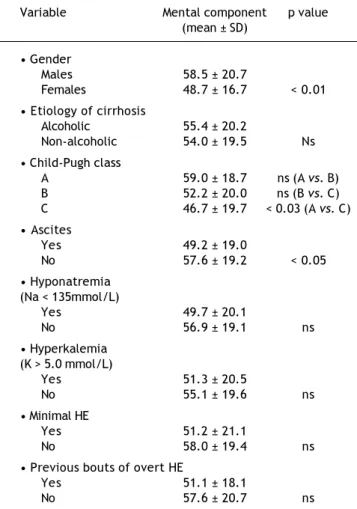
Table 4. Relationship between Mental component of SF-36 score and analyzed factors.
Variable Mental component p value (mean ± SD)
• Gender
Males 58.5 ± 20.7
Females 48.7 ± 16.7 < 0.01 • Etiology of cirrhosis
Alcoholic 55.4 ± 20.2
Non-alcoholic 54.0 ± 19.5 Ns • Child-Pugh class
A 59.0 ± 18.7 ns (A vs. B) B 52.2 ± 20.0 ns (B vs. C) C 46.7 ± 19.7 < 0.03 (A vs. C) • Ascites
Yes 49.2 ± 19.0
No 57.6 ± 19.2 < 0.05 • Hyponatremia
(Na < 135mmol/L)
Yes 49.7 ± 20.1
No 56.9 ± 19.1 ns • Hyperkalemia
(K > 5.0 mmol/L)
Yes 51.3 ± 20.5
No 55.1 ± 19.6 ns • Minimal HE
Yes 51.2 ± 21.1
No 58.0 ± 19.4 ns • Previous bouts of overt HE
Yes 51.1 ± 18.1
No 57.6 ± 20.7 ns
HE: hepatic encephalopathy.
Hepatic encephalopathy
According to West Haven criteria 23 (20%) patients had symptoms of overt HE-17 (14.8%) in stage 1 and 6 (5.2%) in stage 2. Thirty two (28%) subjects fulfilled criteria for minimal HE diagnosis, thus 61 (52%) patients with cirrhosis were conside-red not to have HE.
function-Figure 1. Correlations of CFF values in analyzed patients with: A. CLDQ score. B. Physical component of SF-36. C. Men-tal Component of SF-36.
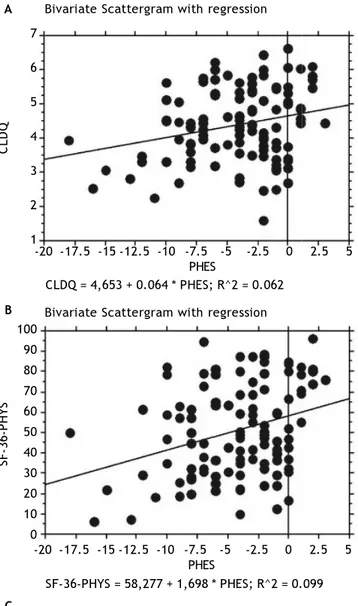
Figure 2. Correlations of PHES values in analyzed patients with: A. CLDQ score. B. Physical component of SF-36. C. Men-tal Component of SF-36.
A A
B B
C C
Bivariate Scattergram with regression
7
6
5
4
3
2
1
CLDQ
30 35 40 45 50 55 60 CFF
CLDQ = 1,859 + 0.06 * CFF; R^2 = 0.07
100 90 80 70 60 50 40 30 20 10 0
SF-36-PHYS
30 35 40 45 50 55 60 CFF
Bivariate Scattergram with regression
Bivariate Scattergram with regression SF-36 – PHYS = -6,161 + 1.36 * CFF; R^2 = 0.082
30 35 40 45 50 55 60 CFF
SF-36 mental = 8,186 + 1,096 * CFF; R^2 = 0.065 110
100 90 80 70 60 50 40 30 20 10
SF-36 mental
Bivariate Scattergram with regression
7
6
5
4
3
2
1
CLDQ
-20 -17.5 -15 -12.5 -10 -7.5 -5 -2.5 0 2.5 5 PHES
CLDQ = 4,653 + 0.064 * PHES; R^2 = 0.062
100 90 80 70 60 50 40 30 20 10 0
SF-36-PHYS
Bivariate Scattergram with regression
Bivariate Scattergram with regression
SF-36-PHYS = 58,277 + 1,698 * PHES; R^2 = 0.099
SF-36-Mental = 59,602 + 1,271 * PHES; R^2 = 0.066 110
100 90 80 70 60 50 40 30 20 10
-20 -17.5 -15 -12.5 -10 -7.5 -5 -2.5 0 2.5 5 PHES
-20 -17.5 -15 -12.5 -10 -7.5 -5 -2.5 0 2.5 5 PHES
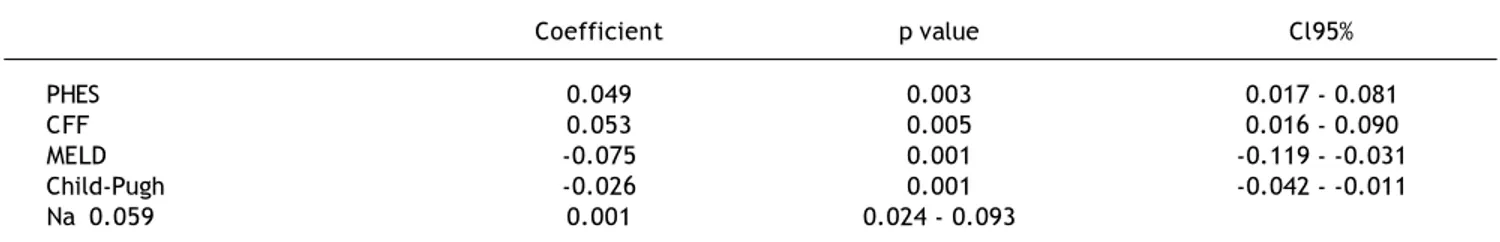
Table 5. Multivariate analysis of factors associated with Physical Component of SF-36 in analyzed patients.
Coefficient p value Cl95%
PHES 0.049 0.003 0.017 - 0.081
CFF 0.053 0.005 0.016 - 0.090
MELD -0.075 0.001 -0.119 - -0.031
Child-Pugh -0.026 0.001 -0.042 - -0.011
Na 0.059 0.001 0.024 - 0.093
PHES: Psychometric Hepatic Encephalopathy Score. CFF: Critical Flicker Frequency. MELD: model of end-stage liver disease. Table 6. Correlation between HRQoL parameters and obtained values of neurophysiological tests.
PHES CFF
Correlation p value 95% CI Correlation p value 95% CI
CLDQ 0.250 < 0.01 0.069-0.415 0.265 < 0.005 0.084-0.430 SF-36 Physical 0.314 < 0.001 0.138-0.471 0.286 < 0.01 0.106-0.448 SF-36 Mental 0.258 < 0.01 0.075-0.424 0.255 < 0.01 0.070-0.423
PHES: Psychometric Hepatic Encephalopathy Score. CFF: Critical Flicker Frequency. CLDQ: Chronic Liver Disease Questionnaire.
ing in regards of Physical Component of SF-36 (Ta-ble 5), but not in Mental Component of SF-36 and CLDQ Score (data not shown).
Serum natremia
Mean serum natremia was 136.2 mmol/l (range between 118.0 and 145.0 mmol/L). Seventy seven (66%) patients had normal serum sodium concentra-tion (≥ 135 mmol/L) and 39 (34%) were hyponatre-mic (Na < 135 mmol/L). Serum natremia levels showed a significant positive correlation with HR-QoL in CLDQ (p < 0.05, CI95% = 0.015-0.371) and both summary scores of SF-36 (p < 0.001, CI95% = 0.154-0.485 for Physical Component and p < 0.05, CI95% = 0.010-0.371 for Mental Component). Patients with normal serum natremia (Na ≥ 135 mmol/L) had a significantly better HRQoL when compared to hyponatremic patients (Na < 135 mmol/L) on CLDQ (p < 0.01) and Physical Component of SF-36 (p < 0.002) (Tables 2-4).
In the multivariate analysis serum natremia was an independent factor impaired HRQoL in Physical Component of SF-36 (Table 5), but not in Mental Component of SF-36 and CLDQ Score (data not shown).
Serum kalemia
Mean serum kalemia was 4.3 mmol/L (range bet-ween 2.6 and 6.2 mmol/L). Ninty two (79.3%) subject had normal serum kalemia (K ≥ 3.5 and
≤ 5.0 mmol/L), 17 (14.7%) – had hyperkalemia
(K > 5.0 mmol/L) and 7 (6.0%) - hypokalemia (K < 3.5 mmol/L).
Serum kalemia showed correlation with neither qua-lity of life (Tables 2-4), HE nor severity of the disease.
DISCUSSION
In this prospective project we applied two diffe-rent HRQoL questionnaires (generic and specific for chronic liver diseases) to assess the influence of se-veral cirrhosis-related complications on life’s quali-ty in patients with liver cirrhosis. We found a significant correlation, both in univariate and mul-tivariate analysis between serum natremia and HR-QoL. Literature data on the influence of natremia on HRQoL are limited. In a study published in an abstract form Ginès, et al. showed the negative im-pact of hyponatremia on HRQoL measured with SF-36.12 More recently Sola, et al., in a large group of patients with cirrhosis and ascites investigated seve-ral factors related to HRQoL, again measured with SF-36. They found that low serum sodium concen-tration is a major factor affecting daily functioning in these patients.13 Our study supports Sola, et al. observations. We found that reduced serum sodium concentration, but > 130 mmoL/L is an important negative predictor of quality of life in patients with liver cirrhosis.
serum sodium between 130 and 134 mmol/L should be considered as hyponatremic9 and they may present clinical consequences of hyponatremia like patients with serum sodium below 130 mmol/L.32
Serum kalemia has not yet been studied in the context of HRQoL in patients with cirrhosis. Recent, multicentre study showed that pre-trans-plant values of potassium not only above 5 mmol/L but also still remaining within a normal range (4.5-5.0 mmol/L) are negative predictors of survi-val in liver transplant recipients.11 We saw no relationship between serum potassium and analy-zed factors emphasizing a significantly more important role of serum sodium in the setting of chronic liver disease.
Another clinically important observation of our study is that minimal HE did not impair HRQoL in analyzed patients. This finding confirms our previous observation,15,33 which is opposite to other studies.14,34
However neuropsychological tools like PHES and CFF, both used in our study for diagnosis of mini-mal HE, correlated with HRQoL parameters in who-le study group (i.e. in patients without and with HE -minimal or overt). Both methods are sensitive and objective in detecting alteration of neuropsychologi-cal performance in patients with minimal and low grade overt HE. PHES is a psychometric battery re-cently recommended for detection of minimal HE.22,23,35 It provides the sensitive and valid evalua-tion of attenevalua-tion, visuo-spatial orientaevalua-tion, visual construction and motor skills i.e. neurocognitive func-tion, that are altered very early in course of natural history of HE.36 CFF has been proven to detect a broad spectrum of neurophysiological alterations typi-cal for early stages of HE, ranging from visual signal processing in retina (measure of retinal gliopathy) to cortical function and vigilance (general arousal).29
In contrast to neuropsychological tools, we found that West Haven criteria in patients with overt HE did not correspond with HRQoL. This novel obser-vation can be explained by the huge variability of neuropsychiatric abnormalities seen in the course of HE. West Haven classification (based on mental status changes) may remain subjective and not sensitive enough to detect subtle cognitive impairment seen in low-grade HE.37
Therefore our data also support the usefulness of neurophysiological tools in the evaluation of clinical relevance of low grade HE. If our findings are con-firmed by other studies the role of West Haven clas-sification in the assessment of HRQoL in an early HE may be questioned.
CONCLUSION
In this prospective study on a cohort of patients with liver cirrhosis we found that serum natremia along with indices of the severity of liver disease exerts a significant effect on patients’ HRQoL.
ABBREVIATIONS
• CFF: critical flicker frequency.
• CLDQ: Chronic Liver Disease Questionnaire.
• HE: hepatic encephalopathy.
• HRQoL: health-related quality of life.
• MELD: model of end-stage liver disease.
• PHES: Psychometric Hepatic Encephalopathy
Score.
• SF-36: Medical Outcomes Study 36-Item Short
Form Health Survey.
DECLARATION OF FUNDING SOURCES
The authors declare no conflict of interest and that there is no pertinent financial arrangement.
REFERENCES
1. Les I, Doval E, Flavia M, Jacas C, Cardenas G, Esteban R, Guardia J, et al. Quality of life in cirrhosis is related to po-tentially treatable factors. Eur J Gastroenterol Hepatol
2010; 22: 221-7.
2. Eisenmenger WJ, Blondheim SH, Bongiovanni AM, Kunkel HG. Electrolyte studies on patients with cirrhosis of the li-ver. J Clin Invest 1950; 29: 1491-9.
3. Brandman D, Biggins SW, Hameed B, Roberts JP, Terrault NA. Pretransplant severe hepatic encephalopathy, peri-transplant sodium and post-liver peri-transplantation morbidity and mortality. Liver Int 2012; 32: 158-64.
4. Dawwas MF, Lewsey JD, Neuberger JM, Gimson AE. The im-pact of serum sodium concentration on mortality after li-ver transplantation: a cohort multicenter study. Liver Transpl 2007; 13: 1115-24.
5. Heuman DM, Abou-Assi SG, Habib A, Williams LM, Stravitz RT, Sanyal AJ, Fisher RA, et al. Persistent ascites and low serum sodium identify patients with cirrhosis and low MELD scores who are at high risk for early death. Hepato-logy 2004; 40: 802-10.
6. Londono MC, Guevara M, Rimola A, Navasa M, Taura P, Mas A, Garcia-Valdecasas JC, et al. Hyponatremia impairs early posttransplantation outcome in patients with cirrhosis undergoing liver transplantation. Gastroenterology 2006; 130: 1135-43.
7. Londono MC, Cardenas A, Guevara M, Quinto L, de Las HD, Navasa M, Rimola A, et al. MELD score and serum sodium in the prediction of survival of patients with cirrhosis awai-ting liver transplantation. Gut 2007; 56: 1283-90.
9. Gines P, Guevara M. Hyponatremia in cirrhosis: pathoge-nesis, clinical significance, and management. Hepatology
2008; 48: 1002-10.
10. Gines A, Escorsell A, Gines P, Salo J, Jimenez W, Inglada L, Navasa M, et al. Incidence, predictive factors, and prog-nosis of the hepatorenal syndrome in cirrhosis with asci-tes. Gastroenterology 1993; 105: 229-36.
11. Dawwas MF, Lewsey JD, Watson CJ, Gimson AE. The im-pact of serum potassium concentration on mortality after liver transplantation: a cohort multicenter study. Trans-plantation 2009; 88: 402-10.
12. Gines P, Wong F, Smajda Lew E, Diamand F. Hyponatremia is a major determinant of impaired health-related quality of life in cirrhosis with ascites. Hepatology 2007; 46: 567A [abstract].
13. Sola E, Watson H, Graupera I, Turon F, Barreto R, Rodri-guez E, et al. Factors related to quality of life in patients with cirrhosis and ascites: Relevance of serum sodium concentration and leg edema. J Hepatol 2012. Doi:http:// dx.doi.org/10.1016/j.jhep.2012.07.020
14. Schomerus H. Quality of life in cirrhotics with minimal he-patic encephalopathy. Metab Brain Dis 2001; 16: 37-41. 15. Wunsch E, Szymanik B, Post M, Marlicz W, Mydlowska M,
Milkiewicz P. Minimal hepatic encephalopathy does not im-pair health-related quality of life in patients with cirrho-sis: a prospective study. Liver Int 2011; 31: 980-4. 16. Moscucci F, Nardelli S, Pentassuglio I, Pasquale C, Ridola L,
Merli M, Riggio O. Previous overt hepatic encephalopathy rather than minimal hepatic encephalopathy impairs health-related quality of life in cirrhotic patients. Liver Int 2011; 31: 1505-10.
17. Younossi ZM, Guyatt G, Kiwi M, Boparai N, King D. Develo-pment of a disease specific questionnaire to measure health related quality of life in patients with chronic liver disease.
Gut 1999; 45: 295-300.
18. Ware JE Jr., Sherbourne CD. The MOS 36-item short-form health survey (SF-36). I. Conceptual framework and item selection. Med Care 1992; 30: 473-83.
19. Conn HO, Leevy CM, Vlahcevic ZR, Rodgers JB, Maddrey WC, Seeff L, Levy LL. Comparison of lactulose and neomy-cin in the treatment of chronic portal-systemic encepha-lopathy. A double blind controlled trial. Gastroenterology
1977; 72: 573-83.
20. Ferenci P, Lockwood A, Mullen K, Tarter R, Weissenborn K, Blei AT. Hepatic encephalopathy-definition, nomenclature, diagnosis, and quantification: final report of the working party at the 11th World Congresses of Gastroenterology, Vienna, 1998. Hepatology 2002; 35: 716-21.
21. Romero-Gomez M. Critical flicker frequency: it is time to break down barriers surrounding minimal hepatic ence-phalopathy. J Hepatol 2007; 47: 10-1.
22. Weissenborn K. Minimal hepatic encephalopathy: a perma-nent source of discussion. Hepatology 2002; 35: 494-6.
23. Randolph C, Hilsabeck R, Kato A, Kharbanda P, Li YY, Ma-pelli D, Ravdin LD, et al. Neuropsychological assessment of hepatic encephalopathy: ISHEN practice guidelines. Liver Int 2009; 29: 629-35.
24. Weissenborn K, Ennen JC, Schomerus H, Ruckert N, Hec-ker H. Neuropsychological characterization of hepatic en-cephalopathy. J Hepatol 2001; 34: 768-73.
25. Amodio P, Campagna F, Olianas S, Iannizzi P, Mapelli D, Penzo M, Angeli P, et al. Detection of minimal hepatic en-cephalopathy: normalization and optimization of the Psy-chometric Hepatic Encephalopathy Score. A neuropsychological and quantified EEG study. J Hepatol
2008; 49: 346-53.
26. Curran S, Wattis J. Critical flicker fusion threshold: a potentially useful measure for the early detection of Alzheimer’s disease. Hum Psychopharmacol 2000; 15: 103-12.
27. Kircheis G, Wettstein M, Timmermann L, Schnitzler A, Haussinger D. Critical flicker frequency for quantification of low-grade hepatic encephalopathy. Hepatology 2002; 35: 357-66.
28. Romero-Gomez M, Cordoba J, Jover R, del Olmo JA, Rami-rez M, Rey R, de ME, et al. Value of the critical flicker fre-quency in patients with minimal hepatic encephalopathy.
Hepatology 2007; 45: 879-85.
29. Sharma P, Sharma BC, Puri V, Sarin SK. Critical flicker fre-quency: diagnostic tool for minimal hepatic encephalopa-thy. J Hepatol 2007; 47: 67-73.
30. Kircheis G, Wettstein M, Timmermann L, Schnitzler A, Haussinger D. Critical flicker frequency for quantification of low-grade hepatic encephalopathy. Hepatology 2002; 35: 357-66.
31. Gines P, Berl T, Bernardi M, Bichet DG, Hamon G, Ji-menez W, Liard JF, et al. Hyponatremia in cirrhosis: from pathogenesis to treatment. Hepatology 1998; 28: 851-64.
32. Angeli P, Wong F, Watson H, Gines P. Hyponatremia in ci-rrhosis: Results of a patient population survey. Hepatolo-gy 2006; 44: 1535-42.
33. Prakash RK, Mullen KD. Is poor quality of life always pre-sent with minimal hepatic encephalopathy? Liver Int 2011; 31: 908-10.
34. Groeneweg M. Subclinical hepatic encephalopathy impairs daily functioning. Hepatology 1998; 28: 45-9.
35. Weissenborn K: PHES: one label, different goods?! J Hepa-tol 2008; 49: 308-312.
36. Weissenborn K, Heidenreich S, Ennen J, Ruckert N, Hec-ker H. Attention deficits in minimal hepatic encephalopa-thy. Metab Brain Dis 2001; 16: 13-9.