CRACK DETECTION BY SPATIO-TEMPORAL GRADIENT ANALYSIS OF
THE ACOUSTIC SURFACE WAVE FIELD
PACS REFERENCE: 43.35.Zc
Teramoto, Kenbu
Department of Mechanical Engineering, Saga University 1- Honjo, Saga-shi, SAGA,
8408502, JAPAN Tel: +81-952-28-8622 FAX: +81-952-28-8587 E-mail: [email protected]
ABSTRACT
This paper presents a crack characterization method by spatio-temporal gradient analysis over the surface elastic wave field. The surface ultrasound wave that propagates in the direction of the layer is a potential candidate of non-destructive evaluation. The proposed method has an ability to classify the surface acoustic wave field through the rank of the covariance matrix defined over the 4-dimentional vector space which is spanned by following components: a vertical displacement, its vertical velocity, and a pair of shear strains. The determinant of the covariance matrix, therefore, is proposed as the index of homogeneity of the object surface.
INTRODUCTION
PROBLEM FORMULATION
Wave Fields on Non-Absorbing Plate In Vacuum
Considering single sound source at the origin on the plate of thickness 2h, density ρ , longitudinal velocity CL, and shear velocity CT, the general displacements normal to the plate
are given by the combination of the following symmetric and anti-symmetric forms:
(1)
(2)
where ω is the circular frequency, k is the wave number vector and r is the coordinate on the surface of the plate. The wave numbers for the normal direction, satisfy the following relations:
(3) Solving the above equations of motion under the stress free surface boundary conditions, the symmetric and anti-symmetric of Lamb waves satisfy the following dispersion equations respectively:
(4)
Description of Spatio-temporal Gradient Field
Let the normal displacement, f(r,t), be denoted by the sum of a symmetric wave usz(r,t) and
an anti-symmetric waveuaz(r,t) as:
(5)
Consequently, the temporal and spatial derivatives at the point r can be denoted as follows:
(6) Here the four coefficients, ξx, ξy, τx, and τy are respectively given by:
(7)
Index of Homogeneity
For determination of the linear dependency among the above four time varying signals, a short duration (=t0)correlation matrix is introduced as follows:
(8) where, the time varying four dimensional vector f is denoted as:
(9)
When no clack exists on the plate surface, unique sound source causes the linear dependency between two vectors, among four components. Thereupon, the following equation is satisfied:
(10)
The normalized valueQ1 is newly defined, therefore, as the index of homogeneity:
(11)
In the crack-free case, Q1becomes unity all over the object surface. On the other hand, when
the incident wave is scattered by cracks, Q1decreases to zero.
NUMERICAL EXPERIMENTS
Discrete Models
The finite-difference time-domain (FDTD) method was first introduced for the study of electromagnetic scattering problems (Yee, 1966). In acoustics, the FDTD method has been developed to study a wide variety of problems (Botteldooren, 1994, 1995). By employing finite differential equations to approximate the derivatives and offsetting the stress and the particle evaluation points, both temporally and spatially, the acoustical wave field in solid can be solved. In the isotropic material, the following differential equations govern the particle motion and momentum (Graff, 1991):
(12)
Here the particle velocity vector is v, the densityρ, and the stress vector in the material T that can be defined as:
(13)
(14)
The differential equations for the above equations can be approximated as following discrete formulas:
(15)
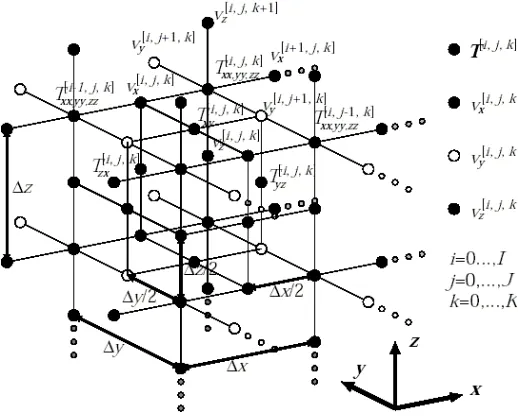
[image:4.596.168.427.421.630.2]Here ∆x, ∆y, ∆z, and ∆t are the spatial and temporal step sizes, respectively. The superscript indicates the spatial location, and the argument indicates the time step. For brevity, the spatial offset between the stress and velocity nodes is suppressed in the index of the discrete forms. Geometry of nodes for stress and particle velocity is shown in Fig.1.
Fig. 1 Geometry of nodes for stress and particle velocity adopted in FDTD simulation.
Consider a three-dimensional computational domain, in which the tapping source is a velocity node at the center of the object surface. Being assumed to be stress-free boundary except the source node, (I/2,J/2,0)
. The all surfaces of the object satisfy the stress-free
Table 1 Parameters of Simulated Object (carbon steel)
Size sampling interval Mass density ρ 7.84[ 3kg/m3]
10
Length 64.0[mm] ∆x 0.25[mm] Elastic modulusC11
277[GPa] Width 64.0[mm] ∆y 0.25[mm]
C12 111[GPa] Height 2.0[mm] ∆z 0.25[mm]
C44 82.9[GPa] ∆t 1.0[ns]
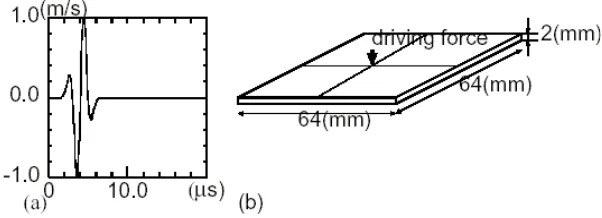
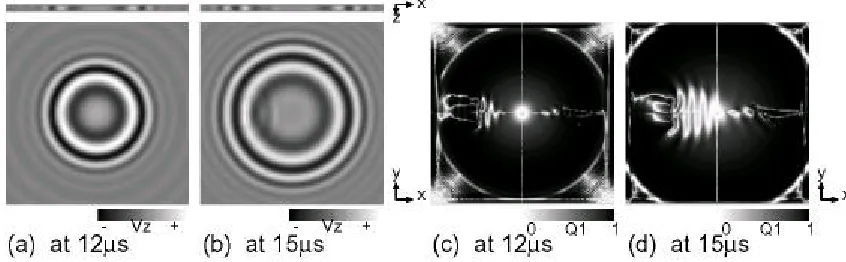
The plot of particle velocity at the source node and the geometry of specimen are shown in Fig.2 (a) and (b) respectively. Fig.3 (a) and (b) show the vertical component of the particle velocity on the object surface. The corresponding indices of surface homogeneity are plotted in (c) and (d) respectively. The major wave fronts yield the phase velocity to be 460m/s, which corresponds to the first anti-symmetric mode, A0 , of Lamb wave velocity. The index of homogeneity increases to unity, because the linear dependency is maintained almost all over the surface.
Fig. 2 (a) Particle speed at the source node, (b) geometry of the specimen
Reflection by Crack
Numerical experiments are conducted to assess the performance of the proposed index of homogeneity. A crack considered in this study is illustrated in Fig.4 (a) and stress free boundary conditions adjacent to the crack are introduced into the FDTD simulation as shown in (b). The snapshots of the vertical component of the particle velocity and the corresponding index of homogeneity are shown in Fig.5(a)(b) and (c)(d) respectively. The comparison between the corresponding pair of figures clarifies the effectiveness of the index of homogeneity. The bright areas in the index of homogeneity, (c) and (d), arise from the overlaps of the incident wave and the reflected wave by the cracks. As a consequence of the fact, the proposed index can detect the existence of the cracks on the surface.
CONCLUSIONS
This paper proposes an index homogeneity that is independent of frequency and phase velocity and presents simple digital signal processing algorithm that characterizing the wave field where incident and scattered waves overlap each other.
[image:5.596.148.449.327.436.2]proposed index of homogeneity becomes unity only when the surface is perfect, without crack or any fault. The numerical experimental results through FDTD method were conducted with following conclusions. The first is to propose the index of homogeneity that aims to detect the existence of cracks; the second is that the reflected wave fronts by cracks are segregated from the rest of the wave field with introducing the index of homogeneity.
Fig. 3 Vertical particle velocity of the crack-free (perfect) surface: (a)(b), and corresponding index of homogeneity: (c)(d).
Fig. 4 (a) Cracked specimen, (b) stress-free boundary conditions.
[image:6.596.89.510.158.286.2] [image:6.596.167.428.348.450.2] [image:6.596.83.506.517.648.2]