ENVIRONMENTAL MANAGEMENT IN AGRICULTURE BASED ON WATER AND CLIMATE CHANGE ASSESSMENTS : TOOLS FOR DECISIONS
MAKING BY LIFE CYCLE APPROACH.
Maria José Amores Barrero
Dipòsit Legal: T 1552-2014
ADVERTIMENT. L'accés als continguts d'aquesta tesi doctoral i la seva utilització ha de respectar els drets de la persona autora. Pot ser utilitzada per a consulta o estudi personal, així com en activitats o materials d'investigació i docència en els termes establerts a l'art. 32 del Text Refós de la Llei de Propietat Intel·lectual (RDL 1/1996). Per altres utilitzacions es requereix l'autorització prèvia i expressa de la persona autora. En qualsevol cas, en la utilització dels seus continguts caldrà indicar de forma clara el nom i cognoms de la persona autora i el títol de la tesi doctoral. No s'autoritza la seva reproducció o altres formes d'explotació efectuades amb finalitats de lucre ni la seva comunicació pública des d'un lloc aliè al servei TDX. Tampoc s'autoritza la presentació del seu contingut en una finestra o marc aliè a TDX (framing). Aquesta reserva de drets afecta tant als continguts de la tesi com als seus resums i índexs.
ADVERTENCIA. El acceso a los contenidos de esta tesis doctoral y su utilización debe respetar los derechos de la persona autora. Puede ser utilizada para consulta o estudio personal, así como en actividades o materiales de investigación y docencia en los términos establecidos en el art. 32 del Texto Refundido de la Ley de Propiedad Intelectual (RDL 1/1996). Para otros usos se requiere la autorización previa y expresa de la persona autora. En cualquier caso, en la utilización de sus contenidos se deberá indicar de forma clara el nombre y apellidos de la persona autora y el título de la tesis doctoral. No se autoriza su reproducción u otras formas de explotación efectuadas con fines lucrativos ni su comunicación pública desde un sitio ajeno al servicio TDR. Tampoco se autoriza la presentación de su contenido en una ventana o marco ajeno a TDR (framing). Esta reserva de derechos afecta tanto al contenido de la tesis como a sus resúmenes e índices.
María José Amores Barrero
ENVIRONMENTAL MANAGEMENT IN AGRICULTURE
BASED ON WATER AND CLIMATE CHANGE
ASSESSMENTS: TOOLS FOR DECISION MAKING BY LIFE
CYCLE APPROACH
DOCTORAL THESIS
Supervised by:
Dr. Francesc Castells Piqué
Dr. Assumpció Antón Vallejo
Department of Chemical Engineering
Environmental Analysis and Management Group
Tarragona
Department of Chemical Engineering
Avda. Països Catalans, 26 Campus Sesceslades 43007 Tarragona Tel. 977 55 96 44 Fax. 977 55 96 21
Certificate
The present thesis entitled “Environmental management in agriculture based
on water and climate change assessments: tools for decision making by life
cycle approach” was carried out by María José Amores Barrero at
Environmental Management Group in Department of Chemical Engineering at
the Universitat Rovira i Virgili (URV) under the supervision of Prof. Dr.
Francesc Castells Piqué from the Department of Chemical Engineering at the
URV and Dr. Assumpció Antón Vallejo, from the Environmental Horticulture
Unit at the Institute of Agriculture and Food Research and Technology (IRTA)
and the Department of Chemical Engineering at the Universitat Rovira i Virgili
(URV). This doctoral thesis is submitted in fulfillment of the requirements for
the International Mention of the PhD in Chemical, Environmental and Process
Engineering.
Tarragona, April 29th of 2013
Supervisor of doctoral thesis Co-supervisor of doctoral thesis
A Hugo y a mi familia
A Hugo y a mi familia
A Hugo y a mi familia
A Hugo y a mi familia
.
Be the changes that you wish to see in the world.
Be the changes that you wish to see in the world.
Be the changes that you wish to see in the world.
Be the changes that you wish to see in the world.
IX
Acknowledgements
Aquesta tesis doctoral ha sigut possible gràcies al suport econòmic rebut pels
següents projectes: projecte 2010VALOR00008 Model de l’Ús Sostenible de
l’Aigua a l’Agricultura (MUSA) per l’AGAUR (Generalitat de Catalunya);
projecte SOSTAQUA (TT07001C) “Evaluación de la sostenibilidad del ciclo del
agua en España i projecte del Plan nacional CTQ2009-14420-C02-01 “Técnicas
estocásticas y deterministas de evaluación del impacto ambiental basadas en
simulación de procesos y análisis de ciclo de vida”, ambdós pel Ministeri de
Ciència i Innovació. A més a més, la beca BE1-385 finançada per l’Agència
d’Ajuts Universitaris de Recerca m’ha permès dur a terme l’estada de recerca a
l’Eidgenössische Technische Hochschule (ETH) de Zürich (Suïssa) i participar
en el marc del projecte europeu “Life Cycle Impact Assessment Methods for
Improved Sustainability Characterisation of Technologies” (LC-IMPACT,
Contract No. 243827).
Durant aquests darrers 2 anys i mig, el Departament d’Enginyeria Química de
la Universitat Rovira i Virgili m’ha donat l’oportunitat de fer recerca en el camp
de l’Anàlisis de Cicle de Vida, la gestió de l’ús de l’aigua i la sostenibilitat a
l’agricultura. Gràcies a tot el personal del DEQ, secretaria, professors i
conserges. A Laureano Jiménez per donar-me l’oportunitat de col·laborar amb
el seu grup i en especial a Gonzalo Guillén, per tot el seu suport durant el
doctorat, consells i ajuda en l’elaboració d’articles.
M’agradaria expressar la meva gratitud als meus supervisors de tesis, en
Francesc Castells i l’Assumpció Antón, sense els quals no hagués estat possible
l’elaboració d’aquesta tesis doctoral. Francesc, gràcies per confiar en mí des del
primer moment en què ens vam conèixer, per haver fet que cada dia hagi pogut
aportar un granet de sorra al meu bagatge científic i per la seva calma i saber fer
bé les coses en cada moment, gràcies mestre! A tú Assum, “la meva mare
científica” per tota la teva constància, treball i suport durant aquest camí de
X
veure els problemes de colors quan jo ho veia tot fosc, per enriquir-me amb el
teu interés per la ciència i la recerca…Gràcies de tot cor!
Me gustaría agradecer también a la actual directora del AGA, Marta
Schuhmacher, por darme la oportunidad de trabajar en el grupo, que sin duda
ha hecho que mi incorporación en el mundo laboral sea más llevadera. Gracias
Marta, por las conversaciones, consejos y por transmitirnos siempre el
sentimiento de superación y crecimiento profesional…y por los buenos
momentos en las barbacoas del Albíol!
Aquest camí sens dubte ha sigut molt més fàcil perquè des del primer dia he
gaudit del bon rotllo dels meus companys del Lab 213…gràcies per fer-me
sentir que venir a treballar sigui un gust, pel bon ambient i companyerisme que
sempre heu tingut amb l’Amores. A la Neus per ser la meva companya de
reflexions i de batalles i per tenir sempre un moment per escoltar-me quan més
ho he necessitat; al Quim perquè sempre ha tingut un moment per dedicar-me,
pel seu humor que sense dubte ens ha fet passar molt bones estones i…perquè
ningú m’ha dit amb tant d’esma “¡Qué mona va esta chica siempre!”; a la
Montse Mari per la seva bondat i paciència; a la Montse Marquès perquè tot i
haver arribat la darrera al grup AGA hem creat un vincle molt fort de
confidències i ha sabut guanyar-se un lloc al meu cor; al Francesc Fàbregas per
recordar-me que cada dia s’ha de trobar un moment de calma per dedicar-te’l a
tú mateix i per obligar-me a baixar a fer els cafés en la recta final d’aquesta tesi;
a la فاطمہ /Fatima/ per la seva bona integració al grup i per fer-nos conèixer la
gent maca del Pakistan; al /Eskinder/ per la seva calma i
converses sobre ACV donant-nos suport mutu en aquesta darrera fase de la
tesis i al वकास/Vikas/ pel seu suport i ajuda en aquest darrer any. A l’adoptada
del grup AGA, la Pepa, per tots els bons moments que hem compartit i perquè
sempre que et necessito et puc trobar. A tota la gent que al llarg del meu camí
ha anat passant pel grup AGA: Jorgelina, gracias por facilitar mis inicios en
XI
Brasil m’emporto moments i vivències molt bonics; a la Montse Meneses per
l’ajuda en el projecte Sostaqua; al Renatto per la seva alegria i manera de ser
que feia que el laboratori fos una festa; a la Isabela por todos los buenos
consejos y ayuda recibida; a l’Oda per la seva ajuda amb l’ArcGis i bones
estones fent el café, a la Ju i Ana Paula de Brasil; a la Maria Margallo de
Santander; al Fernando d’Argentina pel seu don d’explicació i la seva amabilitat
i a la gent de Reus del laboratori de Toxicologia i Tecnatox.
Al Juan y a la cafetería Sunset por hacerme recordar en los desayunos el “arte”
de mi Andalucía. Al Jordi Sierra, per la seva preocupació i la seva bondat; a
l’Ester per les trobades entretingudes en congressos i celebracions; a la Montse
Núñez perquè qui m’havia de dir el dia de la presentació de la teva tesis que era
l’inici d’una gran amistat, gràcies per tota l’ajuda durant l’execució de la tesis i
per totes les experiències que compartirem; a la Marta Torrellas i Marta Seda
per la generositat i bon tracte durant les meves visites a l’IRTA i a la Julia
Martínez per les bones estones a Saint Malo.
Moltes gràcies per tota l’ajuda agronòmica per part del Centre d’Assessoria
LabFerrer. A tú FrancescF per la teva mà dreta per fer les coses i per donar-me
suport científic, a l’Orene Cabot per tota l’ajuda des del primer moment i les
explicacions agronòmiques rebudes; a l’Albert Duaigües per la teva energia i
inquietud per sempre buscar iniciatives i per les bones estones; al Toni
Baltiérrez per la seva aportació al projecte i la seva coordialitat. A tots vosaltres
gràcies per fer el projecte MUSA un projecte exemplar.
Gracias Luis Reyes, por ser siempre un buen consejero, por recordarme que hay
que luchar cada día por lo que uno quiere y por hacerme encontrar la unión
alma-cuerpo mediante el Reiki.
Ein besonderer Dank geht an Stefanie Hellweg von der Eidgenössischen
Technischen Hochschule (ETH) in Zürich dafür, dass ich die Möglichkeit
erhielt, einen Teil meiner Doktorarbeit in Ihrem Institut zu absolvieren. Speziell
möchte ich mich bei Ronnie Juraske, Francesca Verones, Catherine Raptis,
XII
und Danielle Tendall für die tolle Zeit in der Arbeitsgruppe bedanken. I would
like to thank to Ralph Rosenbaum from the Technical University of Denmark
for the external revision of the thesis and for taking part of the committee in the
defense of the present dissertation. Asimismo, a Almudena Hospido por formar
parte del tribunal de evaluación de la presente tesis doctoral.
M’agradaria donar les gràcies als meus amics, per la comprensió i per
complementar la meva vida: a la Núria Quince per la preparació a oposicions
juntes al 2011, per totes les converses substancioses i perquè al final la vida ens
somriu; a la MªJoséS per la seva ajuda informàtica i bones estones viscudes; a
les meves balaguerines preferides: Laura, Anna, Malva, Vanessa, Marta i Ada.
A la meva gent de Tarragona: Maria, Èlia, Jessi, Lidia, Núria, Ester, Christian i
Juanlu, i de Barcelona: Ester, Roger, Alba, Xavi, Vane i Joan; a mi familia
política…Filo, Jose Mª, Isabel, Jose, Charlene y Ana Laura, por vuestra estima y
apoyo.
Mi eterna gratitud es para mi familia. Papi y mami, las mejores personas que
conozco que con vuestro trabajo, amor y enseñanza habéis hecho de mí la
persona que soy hoy; tatas, Yolanda y Raquel, por consentir siempre a vuestra
“peque”, por todos los consejos y por ser las mejores confidentes; David gracias
por haber hecho de hermano mayor aconsejándome, dándome fuerza siempre y
por acompañarme el primer día a la universidad; Raúl gracias por los buenos
momentos vividos y por los buenos ratos en Cazorla; David, Alba y Axel la
alegría de la casa! y para el pequeño Marc que viene de camino. A todos
vosotros gracias por vuestro continuo soporte aún en la distancia.
Y para acabar… agradecer a la persona más especial que acompaña mi día a
día, gracias por haber aparecido en mi vida y caminar junto a mí…a ti Hugo,
por tu continuo amor y paciencia…te quiero.
No quisiera dejarme a nadie pero sois muchos los que en algún momento habéis estado vinculados a mi vida estos dos años y medio de tesis.
XIII
Contents
Figures XIX
Tables XXV
List of acronyms, abbreviations and notation XXIX
Glossary XXXIII
Summary, Resumen, Resum XXXVII
Preface XLVII
Structure of the thesis LIII
PART I. INTRODUCTION AND FRAMEWORK
1. Introduction 1
1.1. Agriculture and Climate Change 4
1.2. Water in agriculture 8
1.3. Life cycle approach in agriculture assessment 13
1.4. Decision making and communication to farmers 15
1.5. State of the art of water and climate change standards,
protocols and methods
18
1.6. Motivation of the dissertation 25
1.7. Objectives of the dissertation 27
2. Material and Methods 29
2.1. Methodological approaches overview 32
2.2. Life Cycle Assessment tool 35
2.3. Combining LCA with other tools 45
2.3.1. Environmental Risk Assessment and Life Cycle
Assessment
45
2.3.2. Integration of Geographic Information Systems into LCA 52
2.3.3. LCA uncertainties by Monte Carlo Simulation in
environmental models
XIV
PART II. PROBLEM STATEMENT: WATER MANAGEMENT AND CLIMATE CHANGE IN AGRICULTURE
3. Comparing different methods to perform an environmental
assessment of freshwater use in agriculture from Ebro Basin
61
Abstract 63
3.1. Introduction 64
3.2. Methods 68
3.2.1. Experimental fields 68
3.2.2. Life cycle inventory 70
3.2.3. Midpoint and endpoint impact categories 73
3.2.4. Assessments of different Spanish watersheds 77
3.3. Results and discussion 78
3.3.1. Part I: Application of methods in the reference case
study
78
3.3.2. Part II: Spanish watersheds comparison 84
3.4. Conclusions 94
Appendix A3 96
4. Life-Cycle Assessment of fuel ethanol from sugarcane in
Argentina
105
Abstract 107
4.1. Introduction 108
4.2. Methods 112
4.2.1. Overview 112
4.2.2. System description and inventory data 115
4.3. Results and discussion 127
4.3.1. Life Cycle Impact Assessment (LCIA) of the reference
case
127
4.3.2. Sensitivity analysis 131
XV
PART III. DECISION MAKING TOOL IN AGRICULTURE
5. Farm-gate environmental assessment indices based on the water
footprint and life cycle approach
143
Abstract 145
5.1. Introduction 147
5.2. Methods 151
5.2.1. Case Studies 151
5.2.2. System boundary 152
5.2.3. Calculation of water footprint assessment 152
5.2.4. Calculation of global warming potential 157
5.2.5. Calculation of agronomical assessment 157
5.3. Results and discussion 159
5.3.1. On-farm recorded data of the growing season and LCA
inventory for period 2010-2012
159
5.3.2. Results of water footprint assessment 160
5.3.3. Results of global warming potential 163
5.3.4. Agronomic assessment 166
5.4. Conclusions 167
6. The eFoodPrint® calculator: accounting and assessing on-farm
environmental sustainability indices in irrigated agriculture
169
Abstract 171
6.1. Introduction 172
6.2. State of the art 174
6.3. The efoodprint® calculator 177
6.3.1. The conceptual blocks 177
6.3.2. Scope of eFoodPrint® 179
6.3.3. Structure of the software 186
6.3.4. Example of the output reports 198
XVI
PART IV. SCIENTIFIC DEVELOPMENT AND APPLICATION OF WATER USE IN AGRICULTURE
7. Biodiversity impacts from salinity increase in a coastal wetland 205
Abstract 207
7.1. Introduction 208
7.2. Materials and Methods 210
7.2.1. Description of the wetland Albufera de Adra 210
7.2.2. Developing the Characterization Factor 212
7.3. Results and discussion 221
7.3.1. Fate factor 221
7.3.2. Effect Factor 223
7.3.3.Characterization Factor 225
7.3.4. Impact Score 226
7.4. Application in LCA studies 227
7.5. Outlook
Appendix A7
230
231
8. Environmental assessment of urban water cycle on Mediterranean
conditions by LCA approach
237
Abstract 239
8.1. Introduction 240
8.2 Description of an Urban Water Cycle in the Mediterranean
area
243
8.2.1. Scenario I: Urban Water Cycle 243
8.2.2. Scenario II: Reclaimed water 246
8.2.3. Scenario III: Drought scenario 247
8.3. Material and methods 249
8.3.1. Life Cycle Assessment 249
8.3.2. Definition of Goal and Scope 249
XVII
8.3.4. Impact Assessment at midpoint level 253
8.4. Results and discussion 254
8.4.1. Scenario I 254
8.4.2. Scenario II: Reclaimed water 256
8.4.3. Scenario III: Drought Scenario 259
8.4.4. Comparative Scenarios Analysis 262
8.5. Conclusions 265
Appendix A8 267
PART V. UNCERTAINTY ANALYSIS
9. Framework for decision-making under probabilistic uncertainties
in LCA studies
271
Abstract 273
9.1. Introduction 274
9.1.1. Motivating example 276
9.2. Methods 277
9.2.1. Proposed methodology 279
9.3. Results and discussion 287
9.3.1. Case study: Motivating example revised 287
9.4. Conclusions 291
Appendix A9 293
PART VI. GENERAL CONCLUSIONS AND FUTURE RESEARCH
10. Conclusions 299
10.1. Overall conclusions 301
10.2. Specific conclusions 302
11. Outlook 309
XIX
Figures
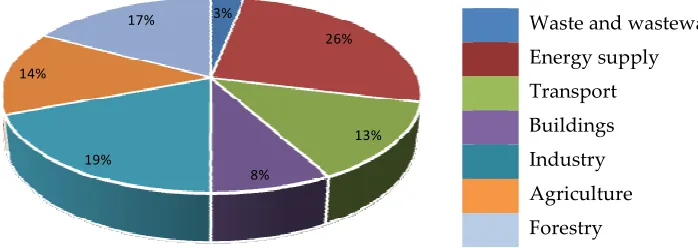
Figure 1.1 Distribution of global GHG emissions by sector 2004. 4
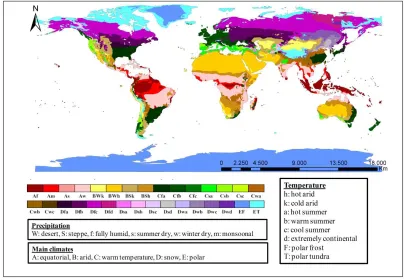
Figure 1.2 World map of the Köppen-Geiger climate classification. 7
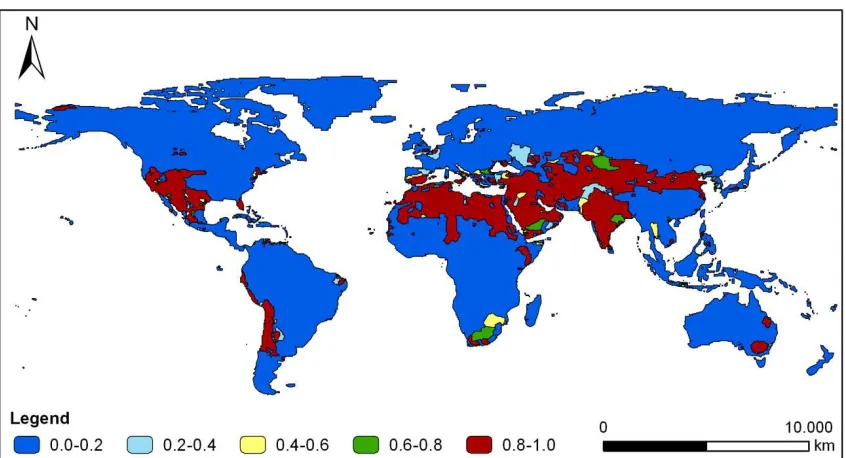
Figure 1.3 World’s Water Stress Index. 11
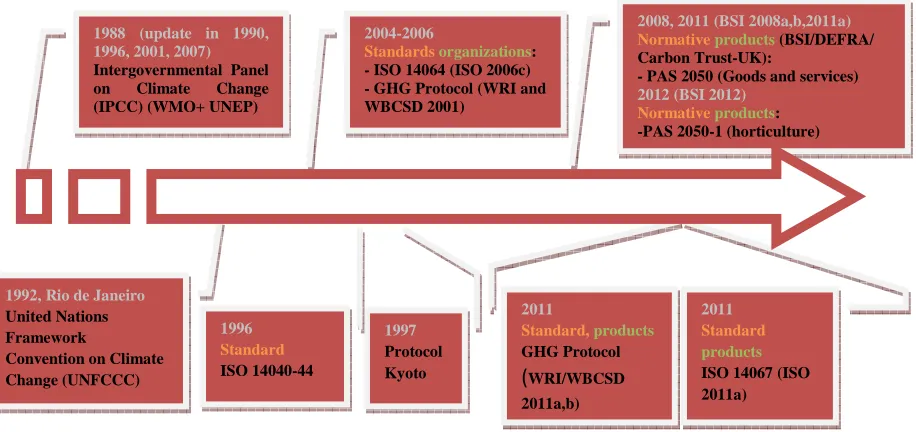
Figure 1.4 Several climate change /carbon footprint standards, protocols
and normative developed from 1992 to 2012.
19
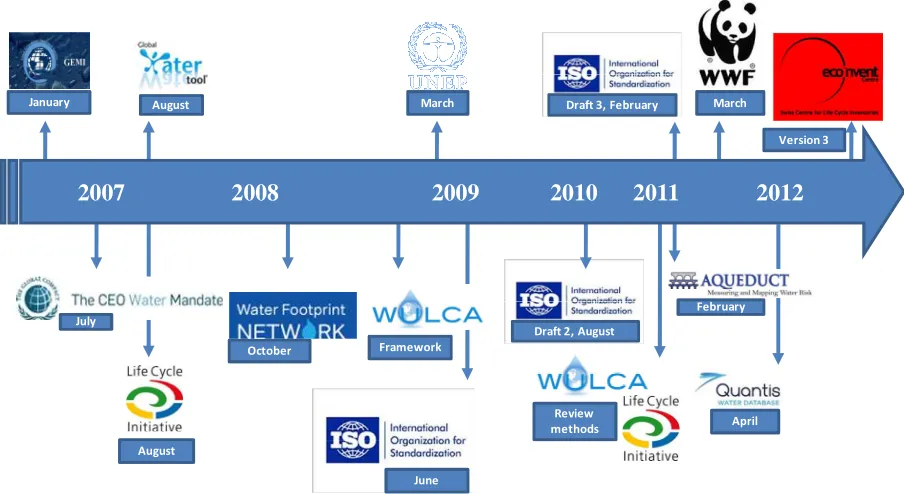
Figure 1.5 Several water footprint standards, database and normative
developed from 1992 to 2012.
22
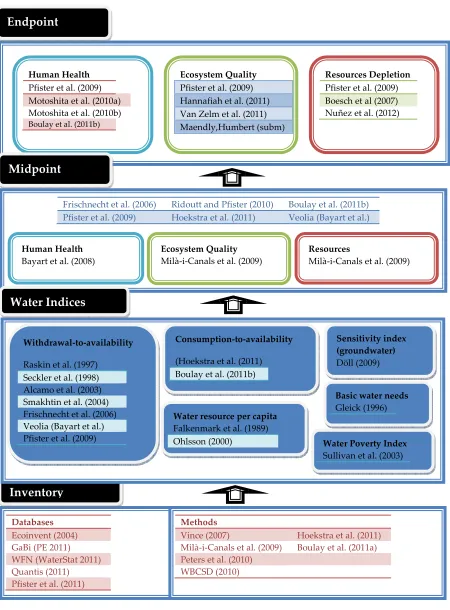
Figure 1.6 Available freshwater use inventory and impact assessment
methods with classification for the three areas of protection.
24
Figure 2.1 Conceptually related methods in environmental management. 32
Figure 2.2 Map structure of methodologies applied in this dissertation. 34
Figure 2.3 Phases of LCA according to ISO 14040 (2006a). 36
Figure 2.4 Environmental mechanism and schematic steps of the LCIA
framework.
42
Figure 2.5 Schematic illustration of the definition of midpoint and
endpoint levels.
43
Figure 2.6 Risk analysis structure. 45
Figure 2.7 Key factors to obtain a Characterization factor: fate, exposure,
response and consequence.
48
Figure 2.8 Framework and underlying methodological steps for
calculating risk based characterization factors for toxicological
effects in LCA.
49
Figure 2.9 Potentially Affected Fraction of species (PAF) curve vs
concentration.
51
[image:19.595.80.555.59.785.2]Figure 2.10 Geographical dimension of category impacts. 54
Figure 3.1 Precipitation, evapotranspiration and irrigation (l·m-2) data for
grape, nectarine and corn farms.
XX
Figure 3.2 Water consumption expressed as blue water per kg of crop
production (grape, nectarine, corn) (m3kg-1).
88
Figure 3.3 Midpoint impacts in Spain for grape, nectarine and corn using
the WSIs of Pfister, Milà i Canals and Smakhtin: a) Impact for
grape b) Impact for nectarine c) Impact for corn using the
model by Pfister et al. (2009); c) Impact for grape d) Impact for
nectarine e) Impact for corn using the model by Smakhtin et al.
(2004).
90
Figure 3.4 Damage to the natural environment at the endpoint level:
ecosystem quality for grape, nectarine and corn in Spain.
91
Figure 3.5 Environmental indicator of water consumption in different
watersheds for a) grape, b) nectarine and c) corn.
93
Figure 4.1 Productive system used in Argentina to produce ethanol from
sugarcane.
110
Figure 4.2 Schematic of the three pathways considered in the reference
case.
116
Figure 4.3 System diagrams for ethanol production from different
production pathways.
119
Figure 4.4 Relative contribution of environmental impacts categories for
each pathway.
132
Figure 5.1 Flowchart from cradle-to-farm-gate-to wholesale. 152
Figure 5.2 Relative contribution of GWP impact for different stages from
farm-gate-to-wholesale.
165
Figure 6.1 Diagram of the eFoodPrint®. 180
Figure 6.2 Cover slide. 181
Figure 6.3 Registration form or login to acess to the eFoodPrint®. 182
Figure 6.4 The Home page of eFoodPrint®. 182
XXI
Figure 6.6 Crop data inventory in campaign data in order to assess the
water evaluation.
184
Figure 6.7 Irrigation inventory in campaign data in order to assess the
water evaluation.
185
Figure 6.8 Water balance inventory in campaign data in order to assess the
evaluation.
185
Figure 6.9 Soil inventory in campaign data in order to assess the water
evaluation.
186
Figure 6.10 Energy inventory in campaign data in order to assess the water
evaluation.
186
Figure 6.11 Harvest inventory in campaign data in order to assess the water
evaluation.
187
Figure 6.12 Water questionnaire in order to assess the water evaluation. 187
Figure 6.13 Global G.A.P. questionnaire in order to assess the water
evaluation.
188
Figure 6.14 Starting carbon assessmentin the eFoodPrint® home page. 188
Figure 6.15 Crop data inventory to evaluate the carbon dioxide emissions
during whole life-cycle.
189
Figure 6.16. Diesel and energy inventory in farm tasks to evaluate the
carbon dioxide emissions during whole life-cycle.
190
Figure 6.17. Fertilization inventory in farm to evaluate the carbon dioxide
emissions during whole life-cycle.
191
Figure 6.18. Treatment inventory (pesticides, insecticides and fungicides) in
farm tasks to evaluate the carbon dioxide emissions during
whole life-cycle.
192
Figure 6.19. Transport and packaging to evaluate the carbon dioxide
emissions during whole life-cycle.
193
XXII
Figure 6.21. Numerical results in order to assess the water evaluation. 195
Figure 6.22. Graphical results from the carbon dioxide emissions during
whole life-cycle.
196
Figure 6.23. Numerical results from the carbon dioxide emissions during
whole life-cycle.
197
Figure 6.24. Report of water footprint. 199
Figure 6.25. Report of carbon footprint. 200
Figure 7.0. Greenhouses close to Albufera de Adra wetland in Adra
(Almería-Spain).
214
Figure 7.1. Albufera de Adra (Spain) composed by the larger, coastal
Nueva Lagoon and inland Honda Lagoon enclosed in the blue
circle. The red line delimits the agricultural area of the study
which consists of 899.2 ha21 of greenhouses area (white areas).
The main economic activity in that area is protected
horticulture.
211
Figure 7.2. Species Sensitivity Distribution (SSD) for salinity for 18 species
native to Nueva Lagoon. The grey arrows indicate the salinity
in 1983 (2.6 g·l-1), 2003 (4.5 g·l-1) and 2008 (6.5 g·l-1).
224
Figure A7.1. Salinity concentration-response curves for species in Albufera
de Adra.
233
Figure 8.1 Urban water cycle in Mediterranean area. 245
Figure 8.2 Urban water cycle with reclaimed water (scenario II) and
seawater reverse osmosis (scenario III).
248
Figure A8.1 Water line in Potable Water Treatment Plant. 267
Figure A8.2 Water line in Wastewater Treatment Plant. 268
Figure 9.1. LCA alternatives assessed in the face of uncertainties in LCI
data.
276
XXIII
Figure 9.3. Cumulative probability curves. 283
Figure 9.4. Calculation of RAR values: a) Right rotation b) Left rotation 286
Figure 9.5. Environmental profile of case study: a) shows the interval of
impacts, b) displays the associated cumulative probability
curves.
XXV
Tables
Table 2.1 Required specifications to determine the purpose and scope of the
study.
37
Table 2.2 Environmental impact categories considered during the
dissertation.
41
Table 3.1 Crop characteristics, climate and irrigation conditions during
2011 for the three crops assessed: grape, nectarine and corn.
70
Table 3.2 Water consumption calculated as a blue and green water
footprint and yields for crops provided for two campaigns (2010
and 2011) and average reference values.
72
Table 3.3 Impact score using different Water Stress Index as
characterization factors and results for case study crops: grape,
nectarine and corn in the Ebro Basin during campaign 2011.
76
Table 3.4 Total surface area and water availability of Spanish watersheds,
percentage of watershed land use for grape, nectarine and corn
acreages and their respective yields.
86
Table 3.5 Blue water consumption (m3 per kg of product) for grape,
nectarine and corn among the different watersheds in Spain.
87
Table 3.6 Results for crops studied and the different Spanish watersheds
applying the water stress index by Pfister et al. (2009) and
Smakhtin et al. (2004) as characterization factors.
89
Table A3.1 Climatic parameters of three crops studied by week: a) grape, b)
nectarine, c) corn.
96
Table A3.2 Production, surface, yield and blue water footprint of Spanish
provinces: a) grape, b) nectarine, c) corn.
99
Table A3.3 Impacts at endpoint level of natural Environment (Ecosystem
quality).
103
XXVI
(reference flow: 1 kg sugarcane harvested).
Table 4.2 Summary of the inventory data for subsystem Milling yearly
(reference flow: 1 kg sugarcane juice).
121
Table 4.3 Summary of the inventory data for sugar production to molasses
(T1) and honey (T2) (reference flow: 1 kg molasses or honey).
123
Table 4.4 Summary of the inventory data for ethanol production from;
molasses distillery (T3), honey distillery (T4) and cane juice
distillery (T5) yearly (reference flow: 1 kg ethanol).
125
Table 4.5 Impact categories in different subsystems to produce ethanol for
each Pathway (FU = 1 kg of ethanol).
128
Table 4.6 Global Warming Potential (kg CO2 eq) for the three pathways, in
Case study 1 (FU = 1 kg ethanol).
134
Table 4.7 Global Warming Potential (kg CO2eq) in pathways 1 and 2
considering economic allocation versus mass allocation in
subsystem Sugar Production.
135
Table 4.8 Global Warming Potential (kg CO2 eq) in pathways 1 and 2 taking
into account economic allocation in the reference case versus
economic allocation with modified sugar price ±10%.
136
Table 4.9 Global Warming Potential (kg CO2eq) in pathways 1 and 2
considering calorific value allocation versus mass allocation in
subsystem Sugar Production.
138
Table 5.1 The main agronomic characteristics from 2010 to 2012 growing
season located in Ebro Basin.
151
Table 5.2 Crop characteristics for grape and nectarine and climatic
parameters during campaigns 2010 to 2012 in studied farms
located in Ebro Basin.
156
Table 5.3 Data obtained directly from the farm managers’ records for each
Management Unit (FMU), including the Life cycle inventory of
XXVII
three crops (FU= kg of produced crop).
Table 5.4 Results of water footprints, blue (real and theoretical); green, total
and impact assessment during the campaigns 2010 to 2012 for
grape and nectarine in located farms of Ebro basin.
163
Table 5.5 Emissions of Global Warming Potential by crop production for
different percentages.
164
Table 5.6 Water indices focus on agronomical sustainability of water use
and irrigation scheduling management.
166
Table 7.1 Constant parameters in Nueva Lagoon for the years 1983, 2003
and 2008. Climatic parameters were provided by Adra weather
station and water bodies, salinities and morphometric
characteristics by existing literature.
214
Table 7.2 Unknown variables in Nueva Lagoon for the years 1983, 2003 and
2008. The values of the variables are obtained by solving the
equation system of Equation 7.3 to Equation 7.8 with GAMS.
222
Table 7.3 Characteristics and impact scores for the 8 main crops in the area of study: greenhouse area (GHArea), crop evapotranspiration
(ETcrop), impact score per area (IS1,per area) and its assigned
percentage (IS1,%), crop’s yield (Yc) and Impact Score per tonne
(IS2,tonne) .
226
Table 7.4 Endpoint Impacts (species·yr·kg-1) according to the ReCiPe
methodology and the contribution of each category to the total
ecosystem quality impact. No data was available for green beans
and watermelon, and thus these crops are neglected in this
comparison.
228
Table A7.1 EC50’s from species in Albufera de Adra. 232
Table A7.2 Sensitivity scenarios for the Nueva lagoon of Albufera de Adra.
Parameters which were varied are the salinity (CN) in the wetland
XXVIII
in 2003 and 2008, the number of wet (Y) and dry (X) months, as
well as the amounts of precipitation (PN) and evapotranspiration
(ETN) on the Nueva lagoon.
Table 8.1 Inventory Analysis of Urban Water Cycle. 251
Table 8.2 Scenario I: Environmental impacts and contribution in different
stages of Urban Water Cycle in Mediterranean area.
254
Table 8.3 Scenario II: Environmental impacts and contribution in different
stages of Urban Water Cycle with reclaimed water application.
258
Table 8.4 Scenario III: Environmental impacts and contribution in different
stages of Urban Water Cycle with reclaimed water application
and desalination.
261
Table 8.5 Quantitative comparison from Scenarios I, II and III. 264
Table 8.6 Qualitative comparison of Scenarios I, II and III. 265
Table 9.1 ξ and Ø for each GHG emissions. 288
Table 9.2 Risk metrics criteria. 294
Table A9.1 Indicator’s definitions of Pedigree Matrix. 293
Table A9.2 Pedigree matrix with 5 quality indicators for environmental data used to assess the quality of the data sources.
294
Table A9.3 Uncertainty factors (variances of the underlying normal distributions) used to convert the data quality indicators of the pedigree matrix in Table A9.2 into additional uncertainty.
XXIX
List of acronyms, abbreviations and notation
ADP Abiotic Depletion Potential
AGA Anàlisis de Gestió Ambiental
AGIN Accumulated Gross Irrigation Needed
ANIN Accumulated Net Irrigation Needed
AP Acidification Potential
ARD Adra River Delta
AReff Accumulated Effective Rainfall
BOD Biological Oxygen Demand
C Carbon
Ca Calcium
CGW Salinity of the fresh groundwater
CN Salinity in Nueva
CSea Salinity in the Mediterranean Sea
CAT Water Consortium of Tarragona
CE Electrical Conductivity of irrigation
CED Cumulative Energy Demand
CF Carbon Footprint
Cf Characterization Factor
CFC Chlorofluorocarbons
Cl2 Chlorine
CML Institute of Environmental Sciences (Leiden)
CO2,eq Carbon dioxide equivalent emissions
COD Chemical Oxygen Demand
CWU Consumptive Water Use
DALY Disability Adjusted Life Years
DAR Depletion of Abiotic Resources
DCB Dichlorbenzene
DI Deficit of Irrigation
EC50 50% Effective Concentration
EDF Ecosystem Damage Factor
EESC Equivalent Effective Stratospheric Chlorine
EF Effect Factor
EP Eutrophication Potential
EQ Ecosystem Quality
eq Equivalent
ET0 Evapotranspiration Potential
ETc Crop Evapotranspiration
ETN Evapotranspiration from Nueva
ETX Nueva Evapotranspiration in wet months
XXX
ETP Ecotoxicity Potential
EUE Energy Use Efficiency
EUPHOROS Efficient Use of Inputs in Protected HORticulture Research project
EV Expected value
EWR Environmental Water Requirements
FAO Food and Agricultural Organization of the United Nations
Fd Flow diagram
FD Freshwater Depletion
FeCl3 Ferric chloride
FEI Freshwater Ecosystem Impact
FF Fate Factor
FGW Fresh groundwater
FGWx Fresh groundwater in wet months
FGWy Fresh groundwater in dry months
FMU Farm Management Unit
FU Functional Unit
FWAET Freshwater Aquatic Ecotoxicity
GHArea Greenhouse area
GHG Greenhouse Gas Emissions
GIS Geographic Information System
GWo,y Groundwater outflow from Nueva Lagoon in the dry months
GWo,x Groundwater outflow from Nueva Lagoon in the wet months
GWP Global Warming Potential
HC50 50% Hazardous Concentration
HCl Hydrochloric acid
HDF Human Damage Factor
HH Human Health
HT Human Toxicity
I Irrigation
ILCD International Reference Life Cycle Data System
IPCC Intergovernmental Panel on Climate Change
IRTA Institute of Agriculture and Food Research and Technology
IS Impact Score
ISO International Organization for Standardization
IWC Irrigation Water Cost
Kc Crop Coefficient
KMnO4 Potassium permanganate
LCA Life Cycle Assessment
LCI Life Cycle Inventory
LCIA Life Cycle Impact Assessment
LCT Life Cycle Thinking
LF Leaching Fraction
XXXI
MAE Marine Aquatic Ecotoxicity
MAGRAMA Spanish Ministry of Agriculture, Food and the Environment’s
MCS Monte Carlo Simulation
Mg Magnesium
NaOH Sodium hydroxide
NaClO Sodium hypochlorite
NH3 Ammonia
N2O Dinitrogen monoxide
NO3- Nitrogen oxides
NOEC No-Observed-Effect Concentration
NPP Net Primary Production
NPV Net Present Value
O3 Ozone
ODP Ozone Depletion Potential
OECD Organisation for Economic Co-operation and Development
P Precipitation
PAF Potentially Affected Fraction of species
PDF Potential Disappeared Fraction of species
PEC Predicted Environmental Concentration
PNEC Predicted No-Effect Concentration
PHO Photochemical Oxidation potential
P2O5 Phosphate
PO4-3 Phosphate equivalent emissions
PWTP Potable Water Treatment Plant
R Rainfall
RAR Risk Area Ratio
RC Reference Case
RD Resources Depletion
Sbeq Antimony equivalent emissions
SETAC Society of Environmental Toxicology and Chemistry
SIA Integrated Water Information database
SIGPAC Geographic Information System of Spanish farms
SGWY Sea Groundwater infiltration into Nueva Lagoon in dry months
SGWX Sea Groundwater infiltration into Nueva Lagoon in wet months
Si Silicon
SO2,eq Sulfur dioxide equivalent emissions
SSD Species Sensitivity Distribution
SWRO Seawater Reverse Osmosis
TET Terrestrial Ecotoxicity
UNEP United Nations Environmental Program
UP Upside Potential
UV Ultra Violet
XXXII
VaR Value at Risk
VN Volumen Nueva
WA Freshwater Availability
WAE Water application efficiency of the irrigation system
WC Worst Case
WF Water Footprint
WFb Blue Water Footprint
WFg Green Water Footprint
WFgy Grey Water Footprint
WFIA Water Footprint Impact Assessment
WFN Water Footprint Network
WR Renewable Water reserves
WSI Water Stress Index
WTA Withdrawal-to-Availavility
WU Water use
WUE Water Use Efficiency
WWTP Wastewater Treatment Plant
X Wet months
Y Dry months
y Yield
YLD Years Lived Disabled
YLL Years of Life Lost
yc Salinity concentration-response
yr Year
XXXIII
Glossary
Effect factor Ecotoxicological effect factor (exposure-response) is the
change in PAF of species that experience an increase in
stress for a change in contaminant exposure above a
predefined effect level.
eFoodPrint® Is a web-based calculator (www.efoodprint.com) whose
goal is to account and assess on-farm environmental
sustainability indicators in irrigated agriculture based on the
three defined approaches (Agronomical, Water assessment
and Global Warming Assessment) enabling to generate
simple reports with the results of the analysis.
Fate factor The fate of a chemical in the environment, hence ecosystem
exposure (the fate factor, F), reflects the fraction of an
emission that is transferred to water and the duration of the
exposure (quantity x duration).
Global Warming
Potential
It is a relative measure of how much heat a greenhouse gas
traps in the atmosphere and compares the amount of heat
trapped by a certain mass of the gas in question to the
amount of heat trapped by a similar mass of carbon dioxide.
It is calculated over a specific time interval, commonly 20,
100 or 500 years.
Groundwater Water drawn from beneath the surface of the earth, such as
from an aquifer.
Potable Water
Treatment Plant
It treats water, groundwater or surface water, and produce
potable water for public/human consumption. Normally its
water line is based on pre-oxidation (pre-chlorination),
physicochemical stage (coagulation/flocculation) and final
XXXIV
Reclaimed Water The reclamation of water from tertiary treatment of
wastewater treatment plant can be referred to as either
direct or indirect non-potable reuse (e.g. agriculture,
gardens).
Risk metrics Techniques borrowed from financial risk management to
analyze the probability curves associated with each assessed
alternative. Value at Risk (VaR), Upside Potential (UP), Risk
Area Ratio (RAR), and Worst Case (WC) are risk metrics to
support risk-related decisions and properly manage the
associated risk.
Seawater Reverse
Osmosis
The desalination technologies consist of reducing the saline
concentration of water to convert it into suitable water to be
consumed by humans. Reverse osmosis membranes
basically let water pass through semipermeable and
ion-specific membranes to desalt seawater.
Species Sensitivity
Distribution
It is an ecotoxicological tool that is useful for the derivation
of environmental quality criteria and ecological risk
assessment. It can help in the calculation of ecotoxicological
effect factors (impact level).
Surface water A water body on the earth’s surface (e.g., a river, lake, or
estuary) or water storage on the surface (e.g., cistern) where
off-stream water is the source.
Statistical
Uncertainty
Uncertainty concerns the absence of knowledge and the
robustness of the data/facts on which knowledge is
constructed and formulated. Statistical uncertainties can be
described using probabilistic functions and can be handled
in practice by means of two types of methods: quantitative,
XXXV
methods, like the Pedigree matrix.
Water consumption
or consumptive use
The off-stream use of water, where water release or return
does not occur.
Water depletion Withdrawal from a water source that is not replenished or
recharged at approximately the same or greater rate than
overall human withdrawal.
Water Footprint It is defined as the volume of freshwater used to produce
the product over the full supply-chain, which looks not only
at the direct water use of a consumer or producer, but also
at its indirect water use. It also distinguishes the volumes of
water consumed by different ‘water-colors’ (green, blue and
grey) depending on the type of water sourced and polluted.
Water-to-Availability
It represents the ratio between withdrawals for different
users (WU) and annual freshwater availability (WA).
Water Stress Index It indicates the portion of consumptive water use that
deprives other users of freshwater. It ranges from 0.01 to 1
with 1 meaning a serious water stress in a basin.
Water use Off-stream use where the water is released or returned to
the original river basin, such as that portion of domestic,
commercial, or industrial waters returned to a municipal
sewer discharged to the original basin.
Wastewater
Treatment Plant
It is a plant that "cleans" wastewater and rainwater. Made
up of a succession of treatments (pre-, primary, secondary
and tertiary) in which water is progressively rid of the
pollutants it contains, the plant ultimately discharges clean
but not drinking water into the natural environment. The
XXXVII
Summary
The irrigated world area has been increased dramatically from the mid of 20th
century. The rapid population growth and the resulting demand for food are
the main drivers behind.Freshwater use and its consumption have emerged as
areas of high environmental concern. Although agricultural lands represent
only 12% of the world’s land area, roughly 70% of water withdrawn from
aquifers, streams and lakes are for irrigated agriculture.
Climate change is a truly global problem around the world and the contribution
from the agricultural sector is significantly high. However, quite less attention
has been given as it is not yet a subject in the international climate mitigation
action such as Kyoto Protocol. Fossil fuels and mainly nitrogen fertilizers used
in farming activities are the main contributors to GreenHouse Gas (GHG)
emissions from the sector. Therefore, it is vital that the current climate change
mitigation needs to consider the importance of the sector towards reducing the
global carbon footprint.
Consequently, the environmental impacts from the use of water by agricultural
activities and their relative contribution to GHG emissions should be properly
addressed. During the last decade, several comprehensive impact assessment
methods associated with freshwater use and climate change have been
developed to improve water management and mitigate the Global Warming
Potential (GWP). Life Cycle Assessment (LCA) methodology aims to measure
and assess the environmentally relevant emissions and resources consumed,
over the entire life cycle of a product or service (ISO 14040-14044). This
analytical tool is increasingly applied and required by industry, authorities and
consumers to make sustainability-based decisions. However, more
XXXVIII
systems as well. Unlike GWP which is assessed as global environmental impact
category, the environmental impact of water can be different worldwide since it
depends on the spatio-temporal variabilities. Hence, water impact
methodologies in LCA are under development.
The present thesis aims mainly to assess the environmental performance of
different agricultural systems through the application of LCA and other
complementary methods. Two main environmental impacts were considered:
Global Warming and Water Footprint. The objective is to provide farmers with
methodological and practical decision- making tools to help them to practice in
sustainable agriculture.
To provide clear guidance on the water consumption assessment, a first study
was developed comparing three different local farms in Ebro basin (Spain). The
spatio-temporal variability of the water resource was considered while
performing an environmental assessment of freshwater use in agriculture. The
Geographic Information System (GIS) have also been implemented as
complementary tool for the case study located in Ebro Basin [Chapter 3]. In
addition, a second study was carried out aiming at selecting the most
environmental pathway for bioethanol production from molasses, honey and
sugarcane in a case study located in Tucumán (Argentina) [Chapter 4]. LCA is
applied as a methodological tool and different allocation rules such as
economic, weight and calorific power were implemented to assess the different
pathways to produce bioethanol and to identify the sensibility of the results.
With the objective to guide farmers in better water management and reduce
climate change associated with practices, a farm-to-gate environmental
assessment indices based on the water footprint and GWP approach have been
outlined [Chapter 5]. As a result of these water indices and the related Life
Cycle Inventory (LCI), a farm-to-gate environmental decision tool
(eFoodPrint®) has been developed and implemented [Chapter 6]. Two parallel
XXXIX
[Chapter 7] deals with the study of environmental impacts, with special
attention to biodiversity, from salinity increase due to irrigation in a coastal
wetland. A new characterization factor (Cf) has been developed. The Cf is
defined as the change in potential affected fraction of species due to a change in
salinity. In the second application, it has been considered the reuse of water
from urban wastewater treatment plants. After a tertiary treatment this
reclaimed water can be used in agriculture. In spite of the increasing values of
carbon footprint by the energy consumption used in the tertiary treatment,
reclaimed water is considered convenient in drought situations [Chapter 8].
LCA calculations are affected by different types of uncertainties, so the selection
of the best option is far from being a straightforward task. A rigorous approach
to aid practitioners in the selection of alternatives when the LCA analysis is
affected by several sources of uncertainty is required for decision makers.
Dealing with the best LCA choice when we have different alternatives, a
framework for decision-making under probabilistic uncertainties in LCA has
been developed using risk metrics [Chapter 9].
Among other important follow-up lines of research, future work should focus
on calculating the uncertainties of the developed methods, proposing general
characterization factors which can be applied in different areas with similar
XL
Resumen
La superficie mundial de regadío ha aumentado drásticamente desde la
segunda mitad del siglo XX. El acelerado crecimiento de la población y la
consecuente demanda de alimentos, son los principales conductores de ello. El
uso de agua dulce y su consumo se han convertido en áreas de interés
ambiental. Aunque las tierras agrícolas representan sólo el 12% de la superficie
terrestre del mundo, aproximadamente el 70% del agua extraída de los
acuíferos, ríos y lagos se utiliza para la agricultura de regadío.
El cambio climático es un conocido problema global en todo el mundo y la
contribución del sector agrícola es significativamente alta. No obstante, no se ha
prestado la atención necesaria en este sector ya que no ha sido sujeto todavía a
las acciones internacionales como el Protocolo de Kyoto para la mitigación del
cambio climático. Los combustibles fósiles y principalmente los fertilizantes
nitrogenados utilizados en las actividades agrícolas son los principales
contribuyentes en las emisiones de Gases de Efecto Invernadero (GEI) del
sector. Por lo tanto, hay una necesidad vital en la mitigación del cambio
climático para que se considere la importancia de este sector hacia una
reducción de la huella de carbono global.
Consiguientemente, los impactos ambientales procedentes del uso del agua
debido a las actividades agrícolas y su relativa contribución en la emisión de
GEI deben ser tratados adecuadamente. Durante la última década, varios
métodos globales de evaluación de impacto asociados con el uso de agua dulce
y el cambio climático han sido desarrollados para mejorar la gestión del agua y
mitigar el Potencial del Calentamiento Global (PCG). La metodología de
Análisis del Ciclo de Vida (ACV) tiene como objetivo medir y evaluar las
emisiones de relevancia ambiental y de los recursos consumidos, durante todo
el ciclo de vida de un producto o servicio (ISO 14040 a 14044). Esta herramienta
XLI
autoridades y los consumidores para la toma de decisiones sostenibles. Sin
embargo, hay una necesidad de emprender más desarrollos para adaptar dicha
herramienta en sistemas agrícolas. Al contrario de lo que sucede con el PCG que
se evalúa como una categoría de impacto global, el impacto ambiental relativo
al agua puede ser diferente en todo el mundo ya que depende de las
variabilidades espacio-temporal. Por lo tanto, las metodologías de impacto para
el agua en ACV están en vías de desarrollo.
La presente tesis tiene como objetivo principal evaluar el perfil ambiental de los
diferentes sistemas agrícolas a través de la aplicación del ACV y otras
herramientas complementarias. Principalmente, se consideraron dos impactos
ambientales: el Calentamiento Global y la Huella Hídrica. El objetivo es
proporcionar a los agricultores herramientas metodológicas y prácticas para la
toma de decisiones y poder así practicar una agricultura sostenible.
Para proporcionar una clara orientación sobre la evaluación del consumo de
agua, un primer estudio se desarrolló comparando tres fincas diferentes
localizadas en la Cuenca del Ebro (España). Se tuvo en cuenta la variabilidad
espacio-temporal de los recursos hídricos para llevar a cabo una evaluación
ambiental del uso de agua dulce en la agricultura. Se empleó el Sistema de
Información Geográfica (SIG) como herramienta complementaria en el caso del
estudio localizado en la cuenca del Ebro [Capítulo 3]. Un segundo estudio se
llevó a cabo para seleccionar mediante ACV la vía más ambiental para producir
bioetanol a partir de melaza, miel y caña de azúcar mediante un caso de estudio
ubicado en Tucumán (Argentina) [Capítulo 4]. El ACV es aplicado como una
herramienta metodológica y diferentes reglas de asignación como por ejemplo
económica, másica, calorífica fueron implementadas para analizar diferentes
vías de producción de bioetanol e identificar la sensibilidad de los resultados.
Con el objetivo de orientar a los agricultores en mejorar la gestión del agua y la
reducción del cambio climático asociadas en las prácticas agrícolas, se han
XLII
huella hídrica y el potencial de calentamiento global [Capítulo 5]. Como
resultado de estos índices de agua y el consiguiente Inventario de Ciclo de Vida
(ICV), se ha desarrollado e implementado una herramienta ambiental
(eFoodPrint®) [Capítulo 6]. Adicionalmente, se han añadido dos aplicaciones
paralelas relacionadas con la gestión del agua en la agricultura. El [Capítulo 7]
se ocupa del estudio de impacto ambiental, con especial atención en la
biodiversidad, a partir del aumento de la salinidad a causa del uso de agua para
riego en un humedal costero, desarrollado un nuevo factor de caracterización
(Fc). El Fc se define como la fracción de especies potencialmente afectada
debido a un cambio en la salinidad. En la segunda aplicación, se ha considerado
la reutilización de aguas residuales urbanas procedentes de depuradoras.
Después de un tratamiento terciario esta agua recuperada se puede reutilizar en
la agricultura. A pesar del incremento de la huella de carbono por el consumo
de energía utilizada en el tratamiento terciario, se considera conveniente la
reutilización de agua en situaciones de escasez hídrica [Capítulo 8]. Cualquier
cálculo en ACV se ve afectado por diferentes tipos de incertidumbres, por lo
que la selección de la mejor opción está lejos de ser una tarea sencilla. Así pues,
los actores involucrados requieren una estrategia rigurosa en la selección de
alternativas cuando un ACV es afectado por varias fuentes de incertidumbre.
Para tratar la mejor opción de ACV cuando se tienen diferentes alternativas, se
ha desarrollado un planteamiento para la toma de decisiones bajo
incertidumbre probabilística en ACV utilizando métricas de riesgo [Capítulo 9].
Entre otras líneas de investigación importantes, se plantea un trabajo futuro que
debe centrarse en el cálculo de las incertidumbres de los métodos desarrollados,
en la propuesta de factores de caracterización generales que se puedan aplicar
en diferentes áreas con condiciones similares y en la optimización de los ciclos
XLIII
Resum
La superfície mundial de regadiu ha augmentat dràsticament durant la segona
meitat del segle XX. L’accelerat creixement de la població i la conseqüent
demanda d'aliments són els principals conductors. L'ús d'aigua dolça i el seu
consum s'han convertit en àrees d'interès ambiental. Encara que les terres
agrícoles representen només el 12% de la superfície terrestre del món,
aproximadament el 70% de l'aigua extreta dels aqüífers, rius i llacs s'utilitza per
a l'agricultura de regadiu.
El canvi climàtic és un conegut problema global a tot el món i la contribució del
sector agrícola és significativament alta. No obstant això, no s'ha prestat
l’atenció necessària en aquest sector ja que no ha sigut subjecte encara a les
accions internacionals com el Protocol de Kyoto per a la mitigació del canvi
climàtic. Els combustibles fòssils i principalment els fertilitzants nitrogenats
utilitzats en les activitats agrícoles són els principals contribuents en les
emissions de Gasos d'Efecte Hivernacle (GEH) del sector. Per tant, hi ha una
necessitat vital en la mitigació del canvi climàtic perquè es consideri la
importància d’aquest sector cap a una reducció de la petjada de carboni global.
Conseqüentment, els impactes ambientals procedents de l'ús de l'aigua a causa
de les activitats agrícoles i la seva relativa contribució en l'emissió de GEH han
de ser tractats adequadament. Durant l'última dècada, diversos mètodes globals
d'avaluació d'impacte associats amb l'ús d'aigua dolça i el canvi climàtic han
estat desenvolupats per millorar la gestió de l'aigua i mitigar el Potencial
d'Escalfament Global (PEG). La metodologia d'Anàlisi del Cicle de Vida (ACV)
té com a objectiu mesurar i avaluar les emissions de rellevància ambiental i dels
recursos consumits, durant tot el cicle de vida d'un producte o servei (ISO 14040
a 14044). Aquesta eina analítica s'aplica cada vegada més i és requerida també
per la indústria, les autoritats i els consumidors per a la presa de decisions
XLIV
desenvolupaments per adaptar aquesta eina als sistemes agrícoles. Al contrari
del que succeeix amb el PEG que s'avalua com una categoria d'impacte global,
l'impacte ambiental relatiu a l'aigua pot ser diferent a tot el món ja que depèn
de les variabilitats espai-temporal. Per tant, les metodologies d'impacte per a
l'aigua en ACV estan en vies de desenvolupament.
La present tesi té com a objectiu principal avaluar el perfil ambiental dels
diferents sistemes agrícoles a través de l'aplicació de l’ACV i altres eines
complementàries. Principalment, es van considerar dos impactes ambientals:
l'escalfament global i la petjada hídrica. L'objectiu és proporcionar als
agricultors eines metodològiques i pràctiques per a la presa de decisions i poder
així practicar una agricultura sostenible.
Per proporcionar una clara orientació sobre l'avaluació del consum d'aigua, un
primer estudi es va desenvolupar comparant tres finques diferents localitzades
en la Conca de l'Ebre (Espanya). Es va tenir en compte la variabilitat
espai-temporal dels recursos hídrics per dur a terme una avaluació ambiental de l'ús
d'aigua dolça en l'agricultura. Es va emprar el Sistema d'Informació Geogràfica
(SIG) com a eina complementària en el cas de l'estudi localitzat en la conca de
l'Ebre [Capítol 3]. Un segon estudi es va dur a terme per seleccionar mitjançant
ACV la via més ambiental per produir bioetanol a partir de melassa, mel i suc
de canya de sucre mitjançant un cas d'estudi localitzat al Tucumán (Argentina)
[Capítol 4]. L’ACV és aplicat com una eina metodològica i diferents regles
d'assignació com per exemple econòmica, màssica, calorífica van ser
implementades per analitzar diferents vies de producció de bioetanol i
identificar la sensibilitat dels resultats. Amb l'objectiu d'orientar als agricultors
a millorar la gestió de l'aigua i la reducció del canvi climàtic associades en les
pràctiques agrícoles, s'han proposat índexs ambientals a nivell de finca en base
a la metodologia de la petjada hídrica i el potencial d'escalfament global
XLV
Cicle de Vida (ICV), s'ha desenvolupat i implementat una eina ambiental
(eFoodPrint®) [Capítol 6]. Addicionalment, s'han afegit dues aplicacions
paral·leles i relacionades amb la gestió de l'aigua en l'agricultura. El [Capítol 7]
s'ocupa de l'estudi d'impacte ambiental, amb especial atenció en la
biodiversitat, a partir de l'augment de la salinitat a causa de l'ús d'aigua per a
reg en un aiguamoll coster desenvolupant un nou factor de caracterització (Fc).
El Fc es defineix com la fracció d'espècies potencialment afectada a causa d'un
canvi en la salinitat. En la segona aplicació, s'ha considerat la reutilització
d'aigües residuals urbanes procedents de depuradores. Després d'un
tractament terciari aquesta aigua recuperada es pot reutilitzar en l'agricultura.
Malgrat l'increment de la petjada de carboni pel consum d'energia utilitzat en el
tractament terciari, es considera convenient la reutilització d'aigua en situacions
d'escassetat hídrica [Capítol 8]. Qualsevol càlcul en ACV es veu afectat per
diferents tipus d'incerteses, per la qual cosa la selecció de la millor opció està
lluny de ser una tasca senzilla. Així doncs, els actors involucrats requereixen
una estratègia rigorosa en la selecció d'alternatives quan una ACV és afectada
per diverses fonts d'incertesa. Per tractar la millor opció d’ACV quan es tenen
diferents alternatives, s'ha desenvolupat un plantejament per a la presa de
decisions sota incertesa probabilística en ACV utilitzant mètriques de risc
[Capítol 9].
Entre altres línies de recerca importants, es planteja un treball futur que ha de
centrar-se en el càlcul de les incerteses dels mètodes desenvolupats, en la
proposta de factors de caracterització generals que es puguin aplicar en
diferents àrees amb condicions similars i en l'optimització dels cicles de vida
XLVII
Preface
This thesis belongs to the Chemical Engineering, Environmental and Process
PhD programme of the Universitat Rovira i Virgili in Tarragona (Spain). The
work was carried out within the research group on Environmental Analysis and
Management (AGA) at the Department of Chemical Engineering from January
2011 to March 2013.
The thesis wants to provide a methodology and water indices for agriculture
through an environmental tool in order to improve the water management and
mitigate the climate change from farm practices. Therefore, it aims to contribute
to the methodological development of LCA providing a new method to
evaluate the environmental impacts associated with salinity on biodiversity in a
coastal wetland. A framework for decision-making under uncertainties in LCA
and a proposal solution to reuse reclaimed water from Urban Water Cycle have
been also addressed in the present dissertation.
The thesis is essentially based on the following papers, which have either been
published or accepted or are under review in international peer-reviewed
journals:
• M.Amores, A.Antón, F.Castells. “Comparing different methods to perform an environmental assessment of freshwater use in agriculture
from Ebro Basin”. International Journal of Life Cycle Assessment. (Last
review from March 2013).
• M.Amores, F. Mele, L.Jimenez, F.Castells. “Life Cycle Assessment of fuel ethanol from sugarcane in Argentina". International Journal of Life Cycle
XLVIII
• M.Amores, F.Verones, C.Raptis, R.Juraske, S.Pfister, F.Stoessel, A.Antón, F.Castells, S.Hellweg. “Biodiversity impacts from salinity increase in a
coastal wetland”. Environmental Science and Technology,
dx.doi.org/10.1021/es3045423.
• M. Amores, A.Antón, F.Ferrer, O.Cabot, A.Baltiérrez, A.Duaigües, F. Castells. “Farm-gate environmental assessment indices based on the water footprint and life cycle approach”. Journal of Cleaner Production. (Submitted in March 2013).
• M.Amores, G.Guillén., F.Castells “Framework for decision-making under probabilistic uncertainties in LCA studies”. International Journal of Life Cycle Assessment. (Last review from January, 2013).
• M.Amores, M.Meneses, J.Pasqualino, A.Antón, F.Castells. “Environmental assessment of urban water cycle on Mediterranean
conditions by LCA approach”. Journal of Cleaner Production, 43: 84-92.
And the registered Software:
• Universitat Rovira i Virgili (M.Amores, F.Castells), Centre d’Assessoria Dr LabFerrer (F.Ferrer, O.Cabot, T. Baltiérrez) and Oleia S.L.
(A.Duaigües) (2013): registered with the number T-0164-2012 in Registre
Propietat Intel·lectual de Catalunya. December 18th, 2012. Registered
Software “Model d’Ús Sostenible de l’Aigua a l’Agricultura” eFoodPrint®
[in Spanish, Catalan and English].
In addition, the work included in the thesis was presented in several oral
communications and posters in national and international conferences:
• M.Amores, M.Meneses, J.Pasqualino, F.Castells. Análisis de Ciclo de Vida de l’Estació de Tractament d’Aigua Potable de l’Ampolla. En el
marc del Projecte Sostaqua. Antiga Audiència de Tarragona, April 15,


![[4] [3] [2] [1]](data:image/gif;base64,R0lGODlhAQABAIAAAP///wAAACH5BAEAAAAALAAAAAABAAEAAAICRAEAOw==)