!"# $
%#
&
# ' (#
%&
) '& #
Beyond the Mincer Equation: The Internal Rate of Return to Higher Education in Colombia⊕⊕⊕⊕
Andrés Felipe García-Suaza♠
Juan Carlos Guataquí♠
José Alberto Guerra♠
Darío Maldonado♣
Abstract
In order to present an estimation of the Internal Rate of Return (IRR) to higher
education in Colombia we take advantage of the methodological approach provided by
Heckman, Lochner and Todd (2005). Trying to overcome the criticism that surrounds
interpretations of the education coefficient of Mincer equations as being the rate of
return to investments in education we develop a more structured approach of estimation,
which controls for selection bias, includes more accurate measures of labor income and
the role of education costs and income taxes. Our results implied a lower rate of return
than the ones found in the Colombian literature and show that the Internal Rate of
Return for higher education in Colombia lies somewhere between 0.074 and 0.128. The
results vary according to the year analyzed and individual’s gender. This last result
reinforces considerations regarding gender discrimination in the Colombian labor
market.
JEL classification: I28, J11, J31,
Keywords: Education returns, Mincer Equation, Internal Rate of Return, Colombia
⊕ Las opiniones aquí expresadas son responsabilidad de los autores y por lo tanto no deben ser
interpretadas como propias de la Facultad de Economía ni de la Universidad del Rosario.
♠ Department of Economics, Universidad del Rosario. E-mails: [email protected], [email protected], [email protected].
Introduction
The determinants of wages have been a main concern of the literature on labor
economics and on the economics of education since the seminal works of Pareto (1896)
and all through the research of Roy (1951), Mincer (1974) and Becker (1964). The
Mincer equation has been estimated for different countries, specifications, periods, and
data sets. Different econometric techniques have been used in order to avoid selection
biases. Concerns for the determinants of wages have been driven by policy
considerations. Indeed education and labor market policies depend strongly on whether
education (either by additional years of schooling or by completing specific degrees) is
a profitable investment and on whether wage differences can be explained by individual
characteristics.
Colombia has not been an exception. As in many countries, the returns to education
have raised here an enormous interest among scholars and policy makers. A big share of
the literature has addressed the returns to education and how these returns behave
among individuals with different characteristics. From the Public Economics point of
view, an additional issue deals with the possibility of uneven education returns related
with features which are not related with the labor productivity of individuals. Scholars
in Colombia have also used sophisticated techniques in order to estimate the
coefficients of the Mincer equation in such a way that the estimation could avoid the
various biases generated in estimations of determinants of earnings. Nevertheless, most
studies in Colombia have forgone the fundamental issue of the accurate interpretation of
the coefficients of the Mincer equation and to evaluate whether the Mincer specification
really captures the shape of the returns to education in Colombia or not. Thereby, on
this paper our purpose is to use a methodology proposed by Heckman, Lochner and
Todd (2005, HLT from now onwards) in order to provide for the first time an accurate
estimation of the value of the Internal Rate of Return of Education in Colombia.
The literature related with estimations of the determinants of wages/earnings in
Colombia can be divided in two different waves, and this time gap is mostly due to data
availability. The first wave was composed by the papers of Schultz (1968), Selowsky
(1968) and Kugler and Reyes (1975). The second wave started with Tenjo (1993a,
1993b), Perfetti (1996), Ribero and Meza (1997), Velásquez (2001), and then evolves to
Tenjo and Bernat (2002), Arias and Chaves (2002), Zárate (2003), Nuñez and Sánchez
and Gamboa (2007), just to mention the most well-known references. The papers in the
first wave were concerned with the effect of education levels over wages and used the
OLS technique. The papers in the second wave introduced different considerations on
estimating the determinants of earnings: the biases that the OLS techniques introduce in
the Mincer equation coefficients, possible interactions of individual characteristics (i.e.
gender, economic sector or geographic criteria) and education level, or non-linear forms
of the relation between the log of income and education.
It must be said that, as argued by HLT for international studies, most Colombian studies
have not been careful enough in the way they approach their estimations or in the way
they interpret their results. Strictly, the coefficient that accompanies the level of
education in the Mincer equation is the Wage Growth Rate with respect to Education
(GRE)1. This is a radical departure point. Most papers have argued that this coefficient
(usually measured as years spent at school) is the Internal Rate of Return (IRR) to
education. It must be remarked that this identity (IRR being GRE) only holds under
very restrictive assumptions. They are i) the linearity of the (log of) wage in schooling,
ii) parallelism: restriction that log earnings - experience profiles are parallel across
schooling levels (i.e. multiplicative separability between schooling and experience
components of earnings), iii) length of working life does not depend on the schooling
levels, and iv) absence of income taxes, and financial and psychological costs of
education. Although most studies correctly estimate the rate of growth of labor income
with respect to education level, if their estimation does not hold for these assumptions,
their interpretation becomes difficult.
It is paramount to understand the implications of these concepts. GRE can only be
analyzed as the IRR if the four previous assumptions are satisfied, which does not
happen to be the standard, empirical case. This identity becomes even more difficult to
hold when we have to analyze variability over time. Indeed, GRE is one component of
IRR, but this last concept implies more determinants. GRE can be taken as an
expression of the way education has an influence over labor income, but it falls short of
being the accurate expression of the way a financial project devoted to invest in
education can be evaluated. Paraphrasing, GRE is a component of IRR, but an accurate
IRR has to include more information and variables in order to be judged as radical
criteria for education investment decisions.
1
This paper reconsiders the estimation of wage determinants by using the HLT approach
to accurately calculate the IRR in Colombia, using data from the Household Surveys
(Encuesta de Hogares) for the years 2001 to 2005. Following HLT we need to consider
not only the information from the household surveys but we also need to include
information about the costs of education and of the tax system in Colombia. The
information of household surveys in Colombia do not provide information about costs
of education or tax payments at the individual level; our approach uses average tuition
fees and potential income tax payments to solve this issue. Furthermore, for our purpose
we also require to consider more flexible wage equations that allow for non-linearities
of (the log of) wage in education.
In order to approach our research framework, let’s consider the following landscape. An
individual of 16 years old has finished high school. Based on purely economic factors
(leaving aside any consideration of utility costs or benefits of education) why should
this individual acquire additional education? Our assumption, as in most of the literature
on the subject, is that this individual will attend university if the IRR associated to the
university degree is higher than its discount rate. Thereby, in order to appropriately
study this problem, one needs to calculate accurately the IRR.
Our results show that the Internal Rate of Return for higher education in Colombia lies
somewhere between 0.074 and 0.128. The results vary according to the year analyzed
and individual’s gender. This last result reinforces considerations regarding gender
discrimination in the Colombian labor market.
2. The Internal Rate of Return to Education
Mincer’s earnings model is one of the cornerstones of labor economics (see Grossbard,
2006). It has been mainly used to analyze the effect of investment in different forms of
human capital and to decompose the effect of different socioeconomic features over
earnings. Two recent literature reviews (Lemieux, 2003; Heckman et al., 2003)
provided critical overviews of the studies that have used this famous equation and their
methodological evolution. Both papers recognize its power as a statistical instrument
quite capable to predict wages. However, Heckman et al. argue that there are better
specifications for the functional form, which may yield more accurate predictions of
wages. More important than the specific functional form that is used to estimate
included in the equations. If these coefficients have an important economic meaning,
the specification should stick to specifications that illustrate those meanings. However
if, as argued by HLT, the coefficients of the Mincer equation do not have an important
economic meaning: one could resort to different specifications and use the Mincer
equation as a tool to predict wages; these predictions can be used for economic analysis.
Introducing our considerations, the seminal, most known Mincer equation can be
expressed as follows:
(
)
[
wi s,x]
0 ssi 0xi 1xi2 i.Ln =α +ρ +β +β +ε (1)
Where w
(
s,x)
represents wage, s represents years of education, x stands forexperience (measured in years) and ε is the error term. Many authors have interpreted
s
ρ as the Internal Rate of Return to Education (IRR). This stems from the original idea
of Mincer (1974, chapter 1) where this function was presented for the first time.
Nonetheless, Mincer was already aware of the assumptions required to portrait this
parameter as the IRR. In particular he points out that ρs can be only be seen as the IRR
if the log of wages is linear in education, all individuals face labor market lives of the
same length, there are no psychological or economic costs of education and there are no
income taxes. If any of these assumptions fails to hold, one has to interpret ρs simply as
the rate of growth of wage with respect to education. If ρs only stands this way, it
cannot be seen as the main parameter guiding decisions about additional education by
rational individuals.
If the stated assumptions fail, this may arise from two specific reasons. They must be
taken account in order to approach an alternative way to circumvent the situation and
provide an accurate estimation of the IRR of education. The first is related to the
functional form chosen by Mincer. The second is the need to include additional
information in the computation of the IRR of education. In our analysis we will address
both issues. Regarding the first problem we will follow HLT and use extended
parametric forms of the Mincer equation as well as a non parametric estimations. These
different education levels and these estimations are used to calculate the IRR of
education using traditional algebraic techniques. Regarding the second problem we
include in our statistical analysis additional information to capture the effect of income
taxes on wages and the effect of direct economic costs of education on the decision to
attend university.
3. Data
Our exercises use data from three different sources. First we use Colombian Household
surveys for the years 2001 to 2005. This data bases give information about wages,
education level, and age (which we use as proxy for experience). We will restrict our
analysis to data from the 13 main cities in Colombia and we will only use urban data;
these restrictions allow us to be confident that reported wage corresponds to returns to
human capital rather than to returns to other types of capital. An alternative exercise
was developed using the specific information contained on the 2003 Quality of Life
Standards Survey (ECV) regarding technical education as compared with formal
education.
As Colombian household surveys do not include information about the tuition fees that
current workers actually paid when they attended college, we use information collected
in 2006 by economic magazine La Nota Económica, which comprises the tuition fee for
most private and public universities in Colombia by undergraduate program of study.
This is our second data source. Finally, using the income tax tables according to yearly
wage, we calculate the amount of taxes that should be paid by each worker and its wage
level. We also include other contributions made by employers and employees as part of
perceived wage (more details on this calculation are included in the appendix).
4. Estimation Method and Results
Our goal is to have an accurate estimate of the IRR of higher education in Colombia.
Under the assumptions of constant labor supply, risk neutrality and neutrality to
consumption inequality over time, the Internal Rate of Return of finishing higher
education versus obtaining only secondary education degree is given by equation (2):
( )
(
)
(
)
( )
(
)
(
1 ~)
.1 ~ 1 1 ~ 1 1 ~ 1 1 0
0 = =
This equation equates the present value of net returns of university education (left
side) with the present value of the net benefits of high school education (right
hand-side). In this equation Ye
( )
x represents the yearly wage of an individual with educationlevel e and x years of experience, according to the Mincer estimation; Ce is per year
tuition fee associated to an education levele. Following this,se represents the number
of years need to finish education level e and Te represents the retirement age of an
individual with e education level, t represents the year and r~ represents the IRR. This
equation is used to find the value of r~ that solves the equation. If the r~ that solves this
equation is higher than the discount rate of the individual it is worth for her to attend
higher education; otherwise she would rather stop education at high school level. Since
in equilibrium the discount rate must be equal to the economy's interest rate, ~ can be r
seen as a measure of the profitability of education.
As we are unable to argue that r~ is equal to the coefficient that accompanies education
in the simple Mincer equation, we use a two-stage procedure. In the first stage we
estimate wages. In the second stage, using estimated yearly wages of individuals with
different education profiles we will compute the IRR as the result of the equation (2).
For the estimation of the wage equations we take three different approaches. First we
use the traditional Mincer equation where the relation between wage and education is
linear. Second, in order to consider possible non linearities of wage in education and
hours of work (HLT argue that this may be the case) we use a modified Mincer equation
in which we also include reported hours worked during the month, gender, and splines
for education level. We estimate this equation using simple OLS and correcting for
selection bias using the traditional method of Heckman (1979). The selection equation
we use estimates the probability of not having zero income in the period in which the
estimation is done; those individuals with zero income are either unemployed ones or
individuals who have decided not to participate in the labor market (Co et al., 2002).
The underlying assumption behind the estimation when selection bias is included is that
when individuals compute their expected wage they consider the possibility of either
being unemployed or of not to participate in the labor market at all; when selection bias
is not considered to compute expected wages, individuals actually would be dismissing
Mincer equation. Through a non-parametric estimation of earnings we relax the Mincer
restrictions and we do not impose any additional assumption, other than continuity on
the relationship between earnings and experience. On this sense, wage is estimated as a
function of experience for each schooling level, separated by gender
All estimations were made using reported wages (before tax wages, for our purposes)
and we compute after tax wages applying to those the income taxes that should be paid
according to the Colombian tax code2. To this after tax wage we have added the
expected employer’s contribution to worker’s pension. Since we are using theoretical
tax payments our results may understate the IRR perceived by individuals. As we have
argued, we are not interested in the particular results (determinants) that may arise from
the estimation of the wage equations. The interested reader can find these results on the
tables at the end of the article. Graphs with the results of the non-parametric estimations
are also included in the appendix.
We concentrate now on the IRR that arises from our exercises. Using estimated wages
for each year of experience and for the two education levels concerned (high school and
undergraduate university), and tuition fees obtained from the data base constructed by
La Nota Económica we use traditional algebraic procedures to compute r~ by using
equation (2).
We calculate the IRR for college education for those individuals who happened to
posses this degree and were included in the Colombian Households Surveys applied
between 2001 and 2005; we compute the IRR for each year and we also do it using a
pooled regression for the period as a whole. This last exercise allows us to eliminate the
economic cycle effects and to concentrate on the structural features through which the
Colombian labor market rewards investments on higher education.
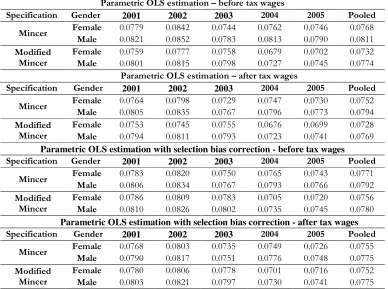
Table 1 shows the results of the IRR calculated using parametric estimations of the
wage equation. From this table we can outline the following issues: a structural gender
discrimination pattern, as the IRR for males is higher than for females (although this
difference is never higher than 0.0044. Second, the IRR happens to be quite stable over
time. Third, the impact of taxes on the IRR is very low; maybe this is a result of failures
2
on the design of the Colombian tax code. Fourth, the IRR is effectively affected by the
way wages are estimated. Finally, something similar happens with the difference
between the estimates when using the OLS equations or the ones that correct for
[image:10.612.113.501.187.476.2]self-selection.
Table 1: IRR - Parametric OLS estimation - Household Survey Data
2001 2002 2003
2001 2002 2003
Parametric OLS estimation with selection bias correction - before tax wages
2001 2002 2003
Parametric OLS estimation with selection bias correction - after tax wages
2001 2002 2003
Source: Authors’ estimations.
Table 2 shows the IRR as computed from non parametric estimates of the wage
equation. Here, the gender gap holds as well and the IRR stays stable over time as well.
One remarkable fact here is that the IRR (non parametric techniques approach one)
happens to be higher than the one we obtained from using wages estimated from
parametric estimation. By comparing the non parametric estimation with the modified
version of the Mincer equation we get an idea of the importance of the bias when
separability of earnings in schooling and experience is assumed (i.e. parallelism). This
[image:10.612.136.470.691.717.2]difference is of the order of 0.04.
Table 2: IRR - Non parametric estimation - Household Survey data
!
Source: Authors’ estimations.
An alternative exercise is shown in Tables 3 and 4, which have been made taking
advantage of some specific information contained in the 2003 Quality of Life Standards
Survey (ECV). As on this survey individuals are requested to provide specific
information about technical (non-formal) education we can compare the IRR obtained
by individuals with technical training as compared with those ones who have formal,
academic, high-school and bachelor degrees. As for all the remaining estimations, these
ones happen to show a discriminatory gender gap as for all the education levels, the
male IRR happens to be higher than the female one. On terms of education policy, it is
important to emphasize that technical education has become an interesting option that
[image:11.612.173.438.396.716.2]the Colombian labor market seems to be rewarding increasingly.
Table 3: IRR - Parametric estimation - Quality of Life Survey Data " #
$ Specification %
& ' ' $ ( ) '
)
& ' '
$ ( * $ +
) '
) $ (
* $ +
" #
$ Specification %
& ' ' $ ( ) '
& ' '
) ' $ (
* $ +
Source: Authors’ estimations.
Table 4: IRR - Non-parametric estimation - before tax wages - Quality of Life Survey Data
,
-" # $
& ' ' $ ( ) '
& ' ' $ ( * $ +
) ' $ (
* $ +
,
-" # $
& ' ' $ ( ) '
& ' ' $ ( * $ +
) ' $ (
* $ +
Source: Authors’ estimations.
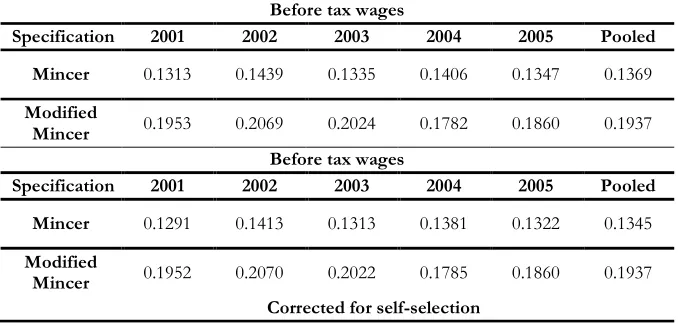
Finally, we can use the results from Tables 1 and 2 and compare them with the results
presented on Table 5. From this comparison it is clear the quantitative differential effect
generated by wrongly interpreting the GRE as the IRR, and perhaps thereby overstating
the returns of education. The comparison shows that the IRR is quite lower than the
GRE and reinforces the results obtained by HLT: the GRE overestimates returns to
education and is usually higher than the IRR.
Table 5: Growth rate of wages with respect to education - parametric OLS estimation - Household Survey Data
.
!
.
!
[image:12.612.193.413.172.364.2] [image:12.612.137.476.551.714.2]-!
Source: Authors’ estimations.
In order to evaluate the implications of the IRR that we have estimated we need to make
some specific comparisons, considering investment in higher education as a financial
project and its potential reward compared with any other financial investment. In order
to do so we took two different interest rates for Colombia and compared them with our
IRR estimates. The first rate was the DTF (Fixed Term Interest Rate), which is a fixed,
low risk kind of interest rate and is calculated as the weighted average of the interest
rate to be paid to fix-term (90 days) deposit certificates in Colombia, and we calculated
it to have a real average level of 5% for the last ten years. The second interest rate was
the natural interest rate for Colombia, which is 4%, according to Misas et al. (2006).
Clearly general university education is a high return investment in Colombia. Even the
lowest of our estimates of the IRR is higher than the Colombian DTF; the smallest
difference is of more than 1 percent point. However, our estimates of the IRR for
technical university education are not always higher than the Colombian DTF, nor than
the Colombian natural interest rate (see Table 4). This last conclusion shows the
importance of developing more research that links the specificity of technical education
in Colombia and the labor market for individuals with technical education to its returns.
6. Final remarks
Following methodological criticism to the recurrent interpretation of the education
coefficient of Mincer earning/wages equation as the Internal Rate or Return for
investments in education, we have addressed the issue of providing an accurate
estimation of the Internal Rate of Return to Higher Education in Colombia, by using the
method proposed by Heckman, Lochner and Todd (2005). Our results reinforce the idea
that an inaccurate interpretation of the GRE as the IRR actually overestimates the
potential returns of investments in education for Colombia.
We must point out that in order to obtain our estimates of the IRR we have made a
number of potentially restrictive assumptions, mainly related with behavior towards risk
assumptions. An additional topic which is worth exploring by using the HLT approach
is the impact that different financial mechanisms may have over the IRR.
For Colombia, as for many other countries, both theoretical and data availability issues
have guided the evolution of the application of the Mincer model. Data availability may
be the main factor to be taken account in order to explain the surge of two different
waves of studies (1970-80s vs. 1990s onwards). Due to wider, public availability of
data, theoretical issues have become the most dynamic force of recent innovations on
the literature. We have tried to provide a conclusive exercise by combining an
application of these theoretical issues and data strategy.
On Human Capital Theory sense, the Internal Rate of Return to Education can be seen
as a measure of the profitability of investment in education. According to our
estimations, higher education, both college and technical one, in Colombia, provides
positive returns, which, nonetheless, seem to posses a gender gap and a negative effect
of income taxes over returns of investment on education. We attribute this negative
effect to the specific design of the Colombian tax code, a hypothesis that obviously
References
Arias, Y., Chávez, A. 2002. "Cálculo de la Tasa Interna de Retorno de la
Educación en Colombia." Documento de Trabajo No. 2. Universidad Externado de
Colombia: Bogotá.
Barrero, A., Vélez, C., López, I., Rosales, R. y Mogollón D. 2004. “Evaluación
económica del componente educativo del programa familias en acción del Plan
Colombia”. Documento CEDE 2004-39. Universidad de Los Andes: Bogotá.
Becker, G. 1964. Human Capital: A Theoretical and Empirical Analysis with
Special Reference to Education. New York: NBER - Columbia University Press.
Co, C. Y., Gang, I. and M. Yun. 2002. "Self-Employment and Wage Earning:
Hungary during Transition." IZA Discussion Paper Series No. 572. Institute for the
Study of Labor.
Forero, N., Gamboa, L. 2007. "Cambios en los Retornos de la Educación en
Bogotá entre 1997 y 2003." Lecturas de Economía, 66.
Heckman, J. 1979. "Sample Selection Bias as a Specification Error."
Econometrica, 47:1.
Heckman, J., Lochner, L. and P. Todd. 2005. "Earnings Functions, Rates of
Return and Treatment Effects: The Mincer Equation and Beyond." NBER Working
Paper Series No. 11544. NBER.
Heckman, J., Lochner, L. and P. Todd. 2003. "Fifty Years of Mincer Earnings
Regressions." NBER Working Paper Series No. 9732. NBER.
Lemieux, T. 2006. ""The Mincer Equation" Thirty Years after Schooling,
Experience and Earnings," in Jacob Mincer: A Pioneer of Modern Labor Economics. S.
Grossbar ed: Springer.
Kugler, B., Reyes, A. 1975. "Educación y Mercado de Trabajo Urbano en
Colombia: Una Comparación entre Sectores Modernos y No Modernos." CCRP:
Bogotá.
Mincer, J. 1974. Schooling, Experience and Earnings: Columbia University
Press - NBER.
Mora, J. 2003. "Sheepskin Effects and Screening in Colombia." Colombian
Nuñez, J., Sánchez, F. 2003. "A Dynamic Analysis of Human Capital, Female
Work-Force Participation, Returns to Education and Changes in Household Structure in
Urban Colombia, 1976-1998." Colombian Economic Journal, 1.
Pareto, V. 1896. "La courbe de la répartition de la richesse." Recueil Publié par
la Faculté de Droit: Lausanne.
Perfetti, M. 1996. "Diferencias Salariales entre Hombres y Mujeres No
Asalariados durante el periodo 1984-1994." Planeación y Desarrollo, 27.
Prada, C. 2006. "¿Es Rentable la Decisión de Estudiar en Colombia?." Ensayos
de Política Económica, 51.
Ribero, R., Meza, C. 1997. "Ingresos Laborales de Hombres y Mujeres en
Colombia: 1976 - 1995." Archivos de Macroeconomía No. 62. Departamento Nacional
de Planeación: Bogotá.
Roy, A. D. 1952. "Some Thoughts on the Distribution of Earnings." Oxford
Economic Papers, 3:2.
Schultz, T. 1968. "Returns to Education in Bogota." RM5645. Rand Corporation
- AID.
Selowsky, M. 1968. "The Effect of Unemployment Labor-Market Segmentation
and the Returns to Educated: The Case of Colombia" Centre for International Affairs.
Harvard University: Boston.
Tenjo, J. 1993a. "Educación, habilidad, conocimientos e ingresos." Planeación y
Desarrollo, 24.
Tenjo, J. 1993b. "Evolución a la Inversión en Educación 1976 - 1989."
Planeación y Desarrollo, 24.
Tenjo, J., Bernat, L. 2002. "Evolución de las Diferencias Salariales entre
Hombres y Mujeres: Comparación de Seis Países Latinoamericanos."
Tenjo, J., Bernal, R. and L. Bernat. 2005. "Evolución de las Diferencias
Salariales entre Hombres y Mujeres: Comparación de Seis Países Latinoamericanos, Un
Intento de Interpretación." Documento CEDE No. 18. Universidad de los Andes:
Bogotá.
Zárate, H. 2003. "Cambios en la Estructura Salarial: Una Historia desde la
Regresión Cuantílica." Borradores de Economía No. 245. Banco de la República:
Bogotá.
Various. 2006. "Guía de las Mejores Universidades." La Nota Económica:
Velásquez, C. 2001. Análisis empírico de las diferencias salariales entre
Appendix: Non parametric estimation for Age Before-tax wage profiles using Locally Weighted Scatter-plot Smoothing (LOWESS)
2001 1 2 .5 1 3 1 3 .5 1 4 1 4 .5 lo g (B e fo re t a x w a g e s)
20 40 60
Age
Male-High School Male-University Female-High School Female-University
2002 1 2 .5 1 3 1 3 .5 1 4 1 4 .5 lo g (B e fo re t a x w a g e s)
20 40 60
Age
Male-High School Male-University Female-High School Female-University
2003 1 2 .5 1 3 1 3 .5 1 4 1 4 .5 lo g (B e fo re t a x w a g e s)
20 40 60
Age
Male-High School Male-University Female-High School Female-University
2004 1 2 .5 1 3 1 3 .5 1 4 1 4 .5 1 5 lo g (B e fo re t a x w a g e s)
20 40 60
Age
Male-High School Male-University Female-High School Female-University
2005 1 2 .5 1 3 1 3 .5 1 4 1 4 .5 lo g (B e fo re t a x w a g e s)
20 40 60
Age
Male-High School Male-University Female-High School Female-University
2001-2005 1 2 .5 1 3 1 3 .5 1 4 1 4 .5 lo g (B e fo re t a x w a g e s)
20 40 60
Age
Appendix: Non parametric estimation for Age After-tax wage profiles using Locally Weighted Scatter-plot Smoothing (LOWESS)
2001 1 2 .5 1 3 1 3 .5 1 4 1 4 .5 lo g (A ft e r ta x w a g e s )
20 40 60
Age
Male-High School Male-University Female-High School Female-University
2002 1 2 .5 1 3 1 3 .5 1 4 1 4 .5 lo g (A ft e r ta x w a g e s )
20 40 60
Age
Male-High School Male-University Female-High School Female-University
2003 1 2 .5 1 3 1 3 .5 1 4 1 4 .5 lo g (A ft e r ta x w a g e s )
20 40 60
Age
Male-High School Male-University Female-High School Female-University
2004 1 2 .5 1 3 1 3 .5 1 4 1 4 .5 1 5 lo g (A ft e r ta x w a g e s )
20 40 60
Age
Male-High School Male-University Female-High School Female-University
2005 1 2 .5 1 3 1 3 .5 1 4 1 4 .5 lo g (A ft e r ta x w a g e s )
20 40 60
Age
Male-High School Male-University Female-High School Female-University
2001-2005 1 2 .5 1 3 1 3 .5 1 4 1 4 .5 lo g (A ft e r ta x w a g e s )
20 40 60
Age