Genetic and molecular basis of reproductive efficiency in swine
224
0
0
Texto completo
(2)
(3) “It is a miracle that curiosity survives formal education.” -. Albert Einstein (1879-1955).
(4)
(5) A mis padres, por su incondicionalidad..
(6)
(7) El Dr. Armand Sánchez Bonastre, catedràtic del Departament de Ciència Animal i dels Aliments de la Universitat Autònoma de Barcelona,. CERTIFICA:. Que la Sarai Córdoba Terreros ha realitzat sota la seva direcció el treball de recerca “Genetic and molecular basis of reproductive efficiency in swine” per a obtenir el grau de Doctora per la Universitat Autònoma de Barcelona.. Que aquest treball s’ha dut a terme al Departament de Ciència Animal i dels Aliments de la Facultat de Veterinària de la Universitat Autònoma de Barcelona i a la unitat de Genètica Animal del Centre de Recerca en Agrigenòmica.. Bellaterra, a 9 d’Octubre de 2015. Dr. Armand Sánchez Bonastre.
(8)
(9) CONTENT SUMMARY/RESUM. ……………………………….………………………………………... 13. List of Tables. ………………………………………………………………………… 17. List of Figures. ………………………………………………………………………… 19. List of publications. ………………………………………………………………………… 21. Related publications by the author Abbreviations. ……………………………………………………… 22. ………………………………………………………………………… 23. 1. GENERAL INTRODUCTION 1.1. Pig production. …………………………………………………….. 29 …………………………………………………….. 29. 1.1.1. Improvement of pig production 1.2. Reproduction in swine. ………………………………….. 30. …………………………………………………….. 30. 1.2.1. Reproductive cycle of a sow. ………………………………….. 30. 1.2.1.1. Follicular phase. ………………………………….. 31. 1.2.1.2. Luteal phase. ………………………………….. 31. 1.2.1.3. Pregnancy establishment 1.3. Genetic basis of swine reproduction 1.3.1. Litter size. …………………………………. 33. ……………………………………………………… 34. 1.3.2. Reproductive QTLs. …………………………………………….. 35. 1.3.3. Candidate genes for litter size in pigs 1.4. Pig genomics. ………………………… 32. ………………………… 37. ……………………………………………………………….. 38. 1.4.1. Transcriptome profiling. …………………………………………….. 39. 1.4.1.1. High-throughput sequencing (RNA-sequencing) …… 1.4.2. Gene expression estimation. 39. …………………………………… 46. 1.4.2.1. Gene expression quantification by RT-qPCR. ……… 47. 1.4.2.2. MicroRNA expression quantification by RT-qPCR …… 49 1.5. Regulation of gene expression 1.5.1. MicroRNAs. ……………………………………………. 51. ……………………………………………………… 52. 1.5.1.1. MiRNA targeting. …………………………………… 53. 1.5.1.2. Functional validation of miRNA targeting. ……… 55.
(10) CONTENT 1.5.2. Regulation of miRNAs processing. …………………………. 56. 1.5.3. Role of miRNAs in reproduction …………………………………… 57 1.6. MEIBMAP intercross. ……………………………………………………… 57. 1.6.1. QTLs identified within the MEIBMAP project. ……………….. 59. 1.6.2. Candidate genes identified within the MEIBMAP project 2. OBJECTIVES. ……… 60. ………………………………………………………………………… 65. 3. ARTICLES AND STUDIES. ……………………………………………………………….. 69. 3.1. Endometrial transcriptome profiling studies 3.1.1.. Study I: Analysis of gene expression differences between extreme prolificacy phenotypes ………………………………………….………….. 69. 3.1.2.. Study II: Validation of reproduction-related candidate genes. ……… 87. 3.2. Gene expression regulation studies 3.2.1.. Study III: Determination of polymorphisms affecting the regulatory function of reproductive-related miRNAs. 3.2.2.. ………………………… 101. Study IV: Functional validation of the miRNA-mRNA interaction ……... 123. 4. GENERAL DISCUSSION. ………………………………………………………………. 143. 5. CONCLUSIONS. ………………………………………………………………………… 159. 6. REFERENCES. ………………………………………………………………………… 163. 7. ANNEXES. ………………………………………………………………………………….. 189. 8. AKNOWLEDGMENTS ……………………………………………………………………… 221.
(11) SUMMARY In recent years, transcriptome characterization has seen a remarkable rise, becoming a hot topic in genomic research either in human or animal genetics. In this last, advances in transcriptomics have addressed the goal to better understand those traits with higher economic impact. One of the most important species in livestock production are pigs. Reproductive traits such as prolificacy can directly impact porcine profitability, but large genetic variation and low heritability have been found regarding litter size among porcine breeds. This highlights the importance to perform expression profiling experiments in porcine breeds with extreme prolificacy phenotypes, to better understand those gene interactions and regulatory mechanisms affecting litter size in pigs. In this thesis, we provide a global view of the endometrial transcriptome of two porcine breeds that differ significantly in their prolificacy levels, giving a list of more than one hundred differentially expressed genes associated with critical steps of embryonic survival during sow’s gestation. These expression differences have been validated for 12 genes providing a list of new candidate genes that may play key role on the genetic architecture of prolificacy-related traits in pigs. We hypothesized that the observed differences in the expression level of these genes between Iberian x Meishan F2 sows with divergent prolificacy phenotypes might respond to a different expression pattern of microRNAs (miRNAs), known to function as posttranscriptional down-regulators of gene expression. To validate this hypothesis, we explored the endometrial miRNA expression profile by RNA-seq identifying 10 differentially expressed miRNAs. Expression levels appear to be similar after relative quantification, despite significant correlations were found between the expression of ssc-miR-92a and ssc-miR-133a and candidate genes MMP8, PTGS2, PTHLH and SCNN1G. We functionally characterized nine reproduction-related miRNAs identifying a total of 13 SNPs in their precursor sequences. To determine the effect of these variants in the reproductive efficiency of the pregnant sows, we performed an association study that revealed that the genotype for the variants in ssc-mir-27a, ssc-mir-29b-2 and ssc-mir-106a was determinant for the mature miRNA expression levels and the EBVs. Finally, a functional validation of the miRNA-mediated regulation of ADM, HTRA3, PTHLH and VEGFA upon they target miRNAs ssc-miR-181d-5p, ssc-miR-101-3p, ssc-miR-144 and ssc-miR-195-5p respectively, allowed us to find a direct relationship between these interactions and decreased levels of gene expression.. 13.
(12) RESUM En els darrers anys, la caracterització del transcriptoma s'ha convertit en un tema candent a la recerca genòmica, ja sigui en humans o en animals. En aquests últims, els avanços en transcriptòmica tenen com a principal objectiu entendre millor els caràcters amb major impacte econòmic. Una de les espècies més importants en la producció ramadera és la porcina. Els caràcters reproductius com la prolificitat poden afectar directament la seva rendibilitat, però la gran variabilitat genètica existent entre races porcines i la baixa heretabilitat d'aquest caràcter han fet de la seva selecció tot un repte. Això posa de manifest la importància d'estudiar les interaccions gèniques i els mecanismes de regulació que afecten el tamany final de la camada en aquesta espècie. En aquesta tesi, oferim una visió global del transcriptoma de l'endometri de dues races porcines que difereixen significativament en els seus nivells de prolificitat, donant una llista de més d'un centenar de gens diferencialment expressats la funció dels quals està associada amb etapes crítiques per a la supervivència embrionària durant la gestació. Aquestes diferències d'expressió han estat validades per 12 gens que constitueixen una llista de nous candidats a exercir un paper clau en l'arquitectura genètica de caràcters relacionats amb l'eficiència reproductiva en el porc. Donat que les microRNAs (miRNAs) són coneguts reguladors posttranscripcionals de l’expressió génica, vam pensar que les diferències observades en el nivell d'expressió d'aquests gens podia respondre a un patró d'expressió de microRNAs diferent. Per validar aquesta hipòtesi, es va analitzar el perfil d'expressió de miRNAs en l'endometri de truges gestants amb nivells de prolificidad divergents, identificant 10 miRNAs madurs diferencialment expressats. Tot i que després de la seva quantificació relativa els nivells d'aquests microRNAs van resultar ser similars, es van trobar correlacions significatives entre l'expressió dels miRNAs ssc-miR-92a i ssc-miR-133a i els gens candidats MMP8, PTGS2, PTHLH i SCNN1G. A més, es va dur a terme la caracterització funcional de nou miRNAs altament implicats en reproducció identificant un total de 13 polimorfismes (SNPs) a les seves seqüències precursores. Per determinar l'efecte d'aquestes variants en l'eficiència reproductiva de les truges, es va realitzar un estudi d'associació que va revelar que el genotip per a les variants identificades a la seqüència de ssc-mir-27a, ssc-mir-29b-2 i ssc-mir-106 era determinant tant per als nivells d'expressió del miRNA madur com per als valors d’EBV. Aquests resultats suggerien que les variants genètiques a la seqüència de miRNAs precursors. 14.
(13) RESUM juguen un paper clau en els caràcteres relacionades amb la reproducció porcina. Finalment, es va dur a terme la validació funcional de la regulació dels gens ADM, HTRA3, PTHLH i VEGFA per part dels seus microRNAs diana ssc-miR-181d-5p, ssc-miR-101-3p, ssc-miR-144 i sscmiR-195-5p respectivament, que ens va permetre establir una relació directa entre aquestes interaccions i una disminució en els seus nivells d'expressió.. 15.
(14)
(15) LIST OF TABLES INTRODUCTION. 2. Table 1.1. Heritability (h ) estimations for female reproductive traits. Table 1.2. Number of QTLs by pig trait class.. ……….….…… 34. ………………………………………..…... 36. Table 1.3. Summary of significantly (p < 0.01) associated QTL regions and some important genes within the regions for reproductive traits in maternal pig lines.. …………….…. 37. Table 1.4. Current available NGS platforms and their characteristic features. ……... 44. Table 1.5. Significant QTL for reproduction traits analyzed within the MEIBMAP project. ……………………………………………………………………………………………….…… 59 Table 1.6. Candidate genes analyzed within the MEIBMAP project.. ………………. 62. ARTICLES AND STUDIES. Study III: Determination of polymorphisms affecting the regulatory function of reproductive-related miRNAs. Table 1. Primers used for the SNP identification by Sanger sequencing. ………………. 117 Table 2. Primers used for the mature miRNAs expression validation by RT-qPCR. …… 118 Table 3. Identified variants in the sequence of the candidate microRNAs by Sanger sequencing …………………………………………………………………………………………………….. 119 Table 4. Association test results. …………………………………………………………….. 120. Study IV: Functional validation of the miRNA-mRNA interaction Table 1. Phenotypic records of the F2 Iberian × Meishan sows used in this study. ….… 128 Table 2. RNA-seq results for the selected genes. ………………………………………..… 129 Table 3. Primers and restriction enzyme sequences used for the 3’-UTRs cloning. ….. 130 Table 4. MiRNA targeting prediction performed by TargetScan and miRDB. ………...… 131. 17.
(16) LIST OF TABLES ANNEXES Study I: Analysis of gene expression differences between extreme prolificacy phenotypes Table S1. Differential expressed genes found in mRNA libraries between both extreme phenotypes. ……………………………………………………………………………………. 189. Table S2. Differentially expressed genes found uniquely expressed in one of the prolificacy groups in mRNA libraries. ……………………………………………………………………. 192. Table S3. QTL mapping results for those DEGs located within at least one QTL closely related with litter size. …………………………………………………………………………………. 194. Table S4. Differential expressed miRNAs found in small RNA libraries between both extreme phenotypes. …………………………………………………………………………………... 196. Table S5. TargetScan results showing DEG predicted as target mRNAs for our differentially expressed miRNAs. ……………………………………………………………………….... 197. Table S6. Candidate novel miRNAs predicted by miRDeep in H and L small RNA libraries. ………………………………………………………………………………………………….. 198. Study II: Validation of reproduction-related candidate genes Additional file 1. Phenotypic records of the F2 Iberian × Meishan sows used in this study. …………………………………………………………………………………………………… 199 Additional file 2. Predicted and validated expression results for the selected genes. …………………………………………………………………………………………………… 200 Additional file 3. Primers used for the genes RT-qPCR validation design.. ……… 202. Study III: Determination of polymorphisms affecting the regulatory function of reproductive-related miRNAs Supplementary Table 1. Phenotypic records of the extreme F2 Iberian × Meishan sows used in this study. ……………………………………………………………………………………. 203 Supplementary Table 2. Genotypes of the whole population for the identified SNPs. …………………………………………………………………………………………………….. 204 Supplementary Table 3. Association between the observed genotype for each variant and EBVs. ……………………………………………………………………………………………. 217 Supplementary Table 4. Mature miRNA expression analysis results. ………………….. 218. 18.
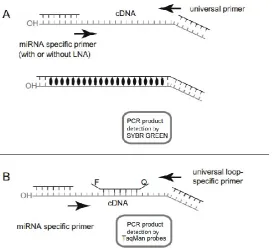
(17) LIST OF FIGURES INTRODUCTION Figure 1.1. World meat production by livestock animal from 1950-2010. ………………… 29 Figure 1.2. Endocrine mechanisms of the normal estrous cycle of a sow. ……................ 31 Figure 1.3. Transcript assembly and quantification by RNA-Seq reveals unannotated transcripts and isoform switching during cell differentiation. ……..………………………… 40 Figure 1.4. Basic principles from Illumina Solexa (a), Ion Torrent (b) and (c) SOLiD sequencing methodologies. …………………………………………………………………………………. 42 Figure 1.5. Overview of the RNA-seq analysis pipeline for detecting differential expression. …………………………………………………………………………………………………….. 45 Figure 1.6. RT-qPCR amplification plot. …………………………………………………….. 48 Figure 1.7. Alternative RT-qPCR methodologies to generate cDNA using stem-loop primers (A), linear miRNA-specific primers (B) or by enzymatic tailing using Poly(A) Polymerase (C) or T4 RNA Ligase (D). ……………………………………………………………………………. 50 Figure 1.8. Amplicon detection by using SYBR Green (A) or TaqMan probes (B). …….. 51 Figure 1.9. Biosynthesis of miRNAs. ………………………………………………………… 53 Figure 1.10. mRNA-target recognition by microRNAs in animals. ……………..………… 54 Figure 1.11. Mechanism to detect the impact of a miRNA on the regulation of a target mRNA by luciferase reporter assay. …………………………………………………………………. 56 Figure 1.12. Experimental Iberian x Meishan intercross (MEIBMAP). …………………… 58. ARTICLES AND STUDIES Study II: Validation of reproduction-related candidate genes Figure 1. QuantStudio™12K Flex real-time PCR gene expression results between high and low groups. ……………………………………………………………………………………… 100. 19.
(18) LIST OF FIGURES Study III: Determination of polymorphisms affecting the regulatory function of reproductive-related miRNAs Figure 1 (a-c). Association between the genotype for the identified variants and the EBVs of the pregnant sows. ………………………………………………………………………………120-21 Figure 2 (a-c). Mature miRNA expression results obtained by RT-qPCR. ………………. 122 Study IV: Functional validation of the miRNA-mRNA interaction Figure 1 (a-d). Luciferase reporter assay results.. ………………………………….…133. Figure 2 (a-d). Summary of the previous endometrial transcriptome analysis results. … 134. 20.
(19) LIST OF PUBLICATIONS Córdoba S., Balcells I., Castelló A., Ovilo C., Noguera J.L., Timoneda. O, Sánchez A. Endometrial gene expression profile from pregnant sows with extreme phenotypes for reproductive efficiency. Scientific Reports (5): doi:10.1038/srep14416. Córdoba-Terreros S., Balcells I., Castelló A., Ovilo C., Noguera J.L., Timoneda. O, Sánchez A. Genetic polymorphisms in miRNAs are associated with porcine extreme phenotypes for reproductive efficiency. Reproduction (under review). Córdoba-Terreros S., Balcells I., Castelló A., Ovilo C., Noguera J.L., Timoneda. O, Sánchez A. Key genes for litter size control show significant expression differences in the endometrium of pregnant sows with extreme phenotypes for reproductive efficiency. Animal Genetics (Submitted). Córdoba S., Dhorne-Pollet S., Castelló A., Balcells I., Ovilo C., Noguera J.L., Timoneda O., Sánchez A. Expression of candidate genes affecting porcine reproductive efficiency is regulated by microRNAs ssc-miR-101-3p, ssc-miR-144-3p and ssc-miR-195-5p. (Manuscript in preparation). 21.
(20) RELATED PUBLICATIONS BY THE AUTHOR Núñez-Hernández, Fernando; Pérez, Lester J; Muñoz, Marta; Vera, Gonzalo; Tomás, Anna et al. (2015) Identification of microRNAs in PCV2 subclinically infected pigs by high throughput sequencing. Veterinary research - vol. 46 (1) p. 18. Núñez-Hernández, Fernando; Pérez, Lester J; Vera, Gonzalo; Córdoba, Sarai; Segalés, Joaquim et al. (2015) Evaluation of the capability of the PCV2 genome to encode miRNAs: lack of viral miRNA expression in an experimental infection. Veterinary research - vol. 46 (1) p. 48. Oriol Timoneda, Fernando Núñez, Ingrid Balcells, Marta Muñoz, Anna Castelló, Gonzalo Vera, Lester J. Pérez, Raquel Egea, Gisela Mir, Sarai Córdoba, Rosa Rosell, Joaquim Segalés, Anna Tomàs, Armand Sánchez, José I. Núñez (2013) The role of viral and host microRNAs in the Aujeszky's. disease virus. during. the. infection. process. PLoS. ONE 9(1):. e86965.. doi:10.1371/journal.pone.0086965. Timoneda O, Balcells I, Córdoba S, Castelló A, Sánchez A (2012) Determination of Reference microRNAs. for. Relative. Quantification. e44413.doi:10.1371/journal.pone.0044413. 22. in. Porcine. Tissues.. PLoS. ONE. 7(9):.
(21) LIST OF ABBREVIATIONS ADM. Adrenomedullin. AFLP. Amplified fragment length polymorphism. BLUP. Best linear unbiased predictors. Bp. Base pair. cDNA. Complementary DNA. CES1. Carboxylesterase 1. CL. Corpora lutea. Ct. Threshold cycle. CV. Coefficient of variation. DD. Differential display. DE. Differential expression. DEG. Differentially expressed gene. DGCR8. DiGeorge Syndrome Critical Region 8. DNA. Deoxyribonucleic acid. dsDNA. Double stranded DNA. EBV. Estimated Breeding Value. ECM. Extracellular matrix. endo-siRNAs. Endogenous short interfering RNAs. EPOR. Erythropoietin receptor. eQTL. Expression quantitative trait loci. ESR. Estrogen receptor. ESTs. Expressed sequence tags. FAO. Food and Agriculture Organization of the United Nations. FC. Fold change. FDR. False discovery rate. FOXA. Forkhead transcription factor 2.. FSH. Follicle stimulating hormone. FSHβ. Follicular-stimulating hormone beta subunit. Fw. Forward. FXYD3. FXYD Domain Containing Ion Transport Regulator 3. 23.
(22) LIST OF ABBREVIATIONS. 24. GF. Growth factor. GL. Gestation length. GL. Gestation length. GnRH. Gonadotropin releasing hormone. GO. Gene ontology. H. High. Hsa. Homo sapiens. HT-NGS. High Troughput Next Generation Sequencing. HTS. High Troughput Sequencing. Ib. Iberian porcine breed. ILK-1β. Interleukin 1 β. IPA. Ingenuity Pathway Analysis. KASP. Kompetitive Allele Specific PCR. KLF5. Kruppel-like factor 5. KLK1. Tissue Kallikrein gene. L. Low. LH. Luteinizing Hormone. lncRNAs. Long non-coding RNAs. Log2. Logarithm base 2. MAGRAMA. Ministerio de Agricultura, Alimentación y Medio Ambiente. Me. Meishan porcine breed. miRISC. MicoRNA-mediated Silencing Complex. miRNA. Small non-coding RNA molecule, micro RNA. miRNA*. miRNA star. MMP8. Matrix metalloproteinase. mRNA. Messenger RNA. MUM. Mummified foetuses at birth. ncRNAs. Non-coding RNAs. NF. Number of fetuses. NGS. Next Generation Sequencing.
(23) LIST OF ABBREVIATIONS NSB. Number of Stillborn Piglets. Nt. Nucleotide. OR. Ovulation rate. OR. Odds Ratio. PAP. Poly A polymerase. PCR. Polymerase Chain Reaction. PGs. Prostaglandins. PION. Gamma-secretase activation protein. piRNAs. Piwi-protein-interacting RNAs. pre-miRNA. Precursor microRNA. pri-miRNA. Primary microRNA. PRL. Prolactin. PRLR. Prolactin receptor. PTGS2. prostaglandin G/H synthase or cyclooxygenase COX2). PTHLH. parathyroid hormone-like hormone. qPCR. Quantitative Polymerase Chain Reaction. QTL. Quantitative Trait Loci. RBPs. RNA Binding Proteins. RIN. RNA Integrity Number. RNA. Ribonucleic Acid. Rnase III. Ribonuclease III Enzyme. RNA-seq. RNA Sequencing. RPKM. Reads Per Kilobase of Exon Model Per Million Mapped Reads. RQ. Relative Quantity. Rrna. Ribosomal RNA. RT. Reverse Transcription. -RT. Minus Reverse Transcription. RT-qPCR. Reverse Transcriptase Real Time Quantitative Polymerase Chain Reaction. Rv. Reverse. SAGE. Serial Analysis of Gene Expression. 25.
(24) LIST OF ABBREVIATIONS. 26. SCNN1G. Sodium Channel, Non Voltage Gated 1 Gamma Subunit. SD. Standard deviation. SDCBP-2. Syndecan Binding Protein (Syntenin) 2. SE. Standard error. SGSC. Swine Genome Sequencing Consortium. SNP. Single Nucleotide Polymorphism. Ssc. Sus scrofa. SSCn. Sus scrofa Chromosome (where n corresponds to the chromosome number). TBA. Total number of piglets born alive. TF. Transcription factor. Tm. Melting Temperature. TN. Teat number. TNB. Total number of piglets born. TNF. Tumor necrosis factor. USDA. United States Department of Agriculture. VEP. Variant effect predictor.
(25) 1. GENERAL INTRODUCTION.
(26)
(27) GENERAL INTRODUCTION 1.1. PIG PRODUCTION The pig (Sus scrofa) constitutes economically one of the most important species in livestock. Porcine is the most widely eaten meat in the world accounting for over 36% of the world meat intake (FAO 2014) (Figure 1.1). Its production has increased every year representing an increment of a 4.38% since 2014 (MAGRAMA 2014), placing Spain at the 4th position among the 20 highest producing countries of porcine meat. This upward trend evidences the economic importance of this sector, especially in Catalonia which represents a 43.1% of the total meat produced in Spain with 1,551,166 tons produced in 2014 (IDESCAT 2015).. Figure 1.1. World meat production by livestock animal from 1950-2010 (FAO, 2014). Although pigs were one of the first species to be domesticated approximately 9000 years ago, development of pig production did not started until 1960 when the first group of exotic pig breeds (Large Whites, Tamworth and Berkshire) were imported by the Department of Livestock Development from the United Kingdom (Larson et al. 2010). Before the introduction of these exotic breeds farmers had to rely on the relatively slow growing of native pigs; however, imported pigs were soon used for breeding improvement and it was throughout the 1960s and 1970s when producers started to raise crossbred pigs as a source of income (Groenen et al. 2012).. 29.
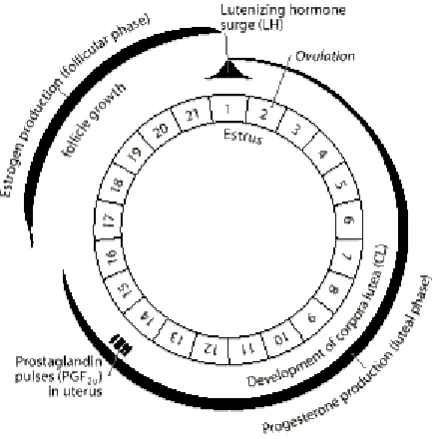
(28) Genetic and Molecular Basis of Reproductive Efficiency in Swine 1.1.1.. Improvement of pig production. The reproductive performance of a sow is one of the key factors affecting production profitability in pigs (Onteru et al. 2009). Thus, from an economic point of view, reproductive efficiency is one of the most important factors in livestock. To date, quantitative approaches used in animal breeding relied upon recording data from phenotypic traits of interest on a large number of individuals (Goddard & Hayes 2009). These records were analyzed with a wide set of statistical methods that allowed the identification and selection of superior individuals as the parents of the next generation (Hill 2014). This strategy became highly efficient when dealing with traits that present moderately or highly heritability; however, because of its complex genetic architecture, selection and improvement of reproductive-related traits has been rather challenging (Bidanel 1993). 1.2. REPRODUCTION IN SWINE Unlike other livestock species, the pig is a multiparous specie that gives birth to a large number of offspring at the same time (Bidanel 2015). Sows reach their sexual maturity at 5-7 months old, as a result of the interaction of internal (genotype, breed…) and external (nutrition, health, environment…) factors. From birth sows present all their primary follicles in both ovaries (approx. 400,000), but it is after puberty when the first fertile estrous cycle occurs (Hughes & Varley 1980). Their estrous cycle classifies this specie as a continuous polyestrous, which means that reproduction has no seasonality and regular cycles are repeated throughout the year, every 21 days except during pregnancy and lactation (WELLS 1946). 1.2.1.. Reproductive cycle of a sow. The sexual cycle of a sow spans a period of 18–24 days and it is regulated by changes in the levels of circulating hormones determined by the hypothalamic-pituitary-ovarian axis (Rydhmer 2000). The hypothalamus, located at the base of the brain, secretes the gonadotropin releasing hormone (GnRH) which regulates the anterior pituitary gland, modulating the blood levels of the follicle stimulating hormone (FSH) and the luteinizing hormone (LH) (Krzymowski & StefańczykKrzymowska 2008). These two hormones stimulate the production of the two ovarian hormones estrogen and progesterone, which in turn regulate the whole reproductive process. Sow’s. 30.
(29) GENERAL INTRODUCTION reproductive cycle consists of a follicular phase of 5–7 days and a luteal phase of 13–15 days (Figure 1.2).. Figure 1.2. Endocrine mechanisms of the normal estrous cycle of a sow (modified from Roy N. Kirkwood et al. 1997). 1.2.1.1. Follicular phase It comprises from the end of the luteal phase (day 16 of oestrus cycle) to the ovulation of the follicles. During this phase, small ovarian follicles develop into large, pre-ovulatory follicles (Rydhmer 2000). The number of oocytes released by both ovaries in an estrous (ovulation rate) is between 15 to 30 follicles, depending on age, nutritional status and other factors. Ovulation is spontaneous and occurs during the second half of the estrus, around 38-42 hours after its onset, and lasts around 1-6 hours (Johnson et al. 1999). This period is characterized by the secretion of estradiol and LH hormone, which are essential for the development of these follicles (Krzymowski & Stefańczyk-Krzymowska 2008). 1.2.1.2. Luteal phase Once an oocyte is released from a ruptured follicle, the remaining cells within the ruptured follicle continue to develop and form the corpus luteum (CL). The luteal phase appears with the development of several corpus luteum, collectively called corpora lutea. The corpora lutea secrete progesterone, which blocks the secretion of both, FSH and LH hormones (Bertoldo et. 31.
(30) Genetic and Molecular Basis of Reproductive Efficiency in Swine al. 2012). If there is no fertilization, and oocytes are not fertilized, the uterus starts to secrete prostaglandin that induces the regression of the corpora lutea (luteolysis) which end the secretion of progesterone. In absence of progesterone a new estrus cycle begins (Sun & Nagai 2003). If there is fertilization, the oocytes become viable embryos and attach to the uterus. At approximately day 11-12, the attached embryo secretes estradiol that redirects uterine prostaglandins from the vascular system to the lumen of the uterus blocking the regression of the corpora lutea. Then, there is a feedback to the corpora lutea that signals them to continue to produce progesterone preparing the uterus for pregnancy establishment (Rydhmer 2000). 1.2.1.3. Pregnancy establishment Pigs tend to produce large litters in a relatively short period of time. The establishment of pregnancy begins about 11-12 days after the beginning of oestrus and is a process that lasts an average of 114 days (3 months, 3 weeks and 3 days), although it can vary with each pregnancy (Bazer 2013). In pigs, this process comprises three main periods: post-conception period (days 1–10 of pregnancy), maternal recognition of pregnancy (days 11–13) and implantation (days 14–19): -. Pre and Post conception period. The post-conception period starts with fertilization and lasts until day 10 after oestrus. During this period, CL is developed. The main product of CL is progesterone, which induces the preparation of endometrium for implantation (Mathew et al. 2011). Moreover, it is thought that during this period uterine immune system is activated. After entering the female reproductive tract, gametes and other components of boar’s seminal plasma are recognized by the sows oviduct and the uterine horns (Kaczmarek et al. 2010). Components of boar semen induce the infiltration of leucocytes into the uterine lumen, clearing the uterus of redundant spermatozoa and microorganisms introduced at mating, thus promoting and regulating the local immune responses (O’Leary et al. 2004). It has been suggested that this interaction of the boar semen with the reproductive tract of the sow, may increase embryo survival and litter size.. 32.
(31) GENERAL INTRODUCTION -. Maternal recognition of pregnancy. Maternal recognition of pregnancy is the process in which embryo signals its presence in the uterus and the sow receives and accepts this signal (Bazer 2013). The pig conceptus (embryo and its associated extra-embryonic membranes) secretes abundant amounts of estrogens that act on the uterus and/or corpus luteum to ensure their maintenance for the progesterone production, the required hormone for pregnancy in most mammals (Mathew et al. 2011). -. Implantation period. Succeeding the embryonic signal for the maternal recognition of pregnancy, porcine embryos remain free-floating until days 13–14 of pregnancy, when they attach to the uterus. As the fetus reaches maturation and the conclusion of pregnancy is needed, the uterus secretes prostaglandin causing parturition (Dey et al. 2004). Recent transcriptomic analysis have revealed that several genes involved in developmental processes such as transporter activity, calcium ion binding, lipid metabolic processes, hormone activity, cell motility and apoptosis are differentially expressed between pregnant and cyclic pigs on day 14 after ovulation (Chen et al. 2014; Samborski et al. 2013; Østrup et al. 2010). Thus, indicating that dramatic changes take place during conceptus implantation. 1.3. GENETIC BASIS OF SWINE REPRODUCTION Although there is a wide diversity of reproductive strategies, basic principles involved in sexual reproduction are relatively conserved and well defined among mammals (Furnes & Schimenti 2007). However, the underlying molecular and genetic basis of each step involving these general processes still remains unknown. At first, genetic improvement of reproductive traits was mainly focused on phenotypic selection rather than using genotypic information (Spötter & Distl 2006a). As previously discussed, the use of these traditional selection methods has not been successful in most livestock species, due to the complex genetic basis and the low heritability (Bidanel 2015) that these traits present (Table 1.1).. 33.
(32) Genetic and Molecular Basis of Reproductive Efficiency in Swine 2. Table 1.1. Heritability (h ) estimations for female reproductive traits (Bidanel et al., 2011). 2. Trait. Mean h. Range. Age at puberty. 0.37. 0. Ovulation rate. 0.32. 0.10 - 0.59. Litter weight at birth. 0.24. 0. - 0.54. Prenatal survival rate. 0.15. 0. - 0.23. Total number of piglets born. 0.11. 0. - 0.76. Number of piglets born alive. 0.10. 0. - 0.66. Conception rate. 0.10. 0. - 0.29. Number of piglets weaned. 0.08. 0. - 0.10. Birth to weaning survival rate. 0.05. 0. - 0.13. - 0.73. These limitations have led to a growing interest in the identification of specific genes and genomic regions involved in the variability and regulation of reproductive traits. At present, researchers have focused in the identification of genes or genomic regions influencing reproductive phenotypes, trying to understand the genetic control of female reproduction in order to develop a more efficient selection of the candidates for reproductive efficiencies (Wilkie et al. 1999; Rohrer et al. 1999; Du et al. 2014; King et al. 2003). 1.3.1.. Litter size. Since the main objective of the pig industry has been to obtain the highest number of piglets weaned per unit time at the lowest cost, reproductive traits related with litter size and preweaning viability have become one of the most relevant traits from a genetic and economic point of view (Rothschild 1996). Improvements in litter size across the swine industry have occurred through different selection schemes such as phenotypic, family index, hyper-prolificbased selection or best linear unbiased prediction method (BLUP) (Spötter & Distl 2006a), which allows to estimate a breeding value (EBV) for each animal that directly correlates with its suitableness to be selected as a reproducer (Hill 2014). One of the main determinants of litter size is failure of the developing foetus to survive (Spötter & Distl 2006b). Despite it is difficult to determine the exact events and functions involved in pregnancy success or failure, the distinct components affecting this trait have yet been determined: ovulation rate, embryonic development, uterus capacity and particularly foetal survival and pre-weaning losses which are the most important component traits used in swine. 34.
(33) GENERAL INTRODUCTION breeding programmes (Rydhmer 2000) for their direct impact in the final litter of a sow. These losses can occur at each stage of development, but the main critical stages are early (days 10– 30 of gestation) and mid-gestation (days 50–70 of gestation), which represent around 20–30% and 10–15% of embryonic loss respectively (Spötter & Distl 2006b) and are primarily determined by the uterine capacity of the pregnant sows (Vallet & Freking 2007; Ford et al. 2001). In pigs, litter size is estimated through the total number of piglets born (TNB) and the number of piglets that born alive (NBA) per parity. Considering that the TNB is the sum of the NBA and the number of stillborn piglets (NSB), the final litter of a sow can be determined by this formula: TNB = NBA + NSB When performing the genetic study of reproductive traits, the success of the main stages involved in reproduction is estimated as diverse phenotypic records, which include endocrine measures (hormone levels), morphologic measures of reproductive organs (teat number, length and placement, uterine capacity and length), fertility related traits (fertilization rate, ovulation rate) and litter measures (embryo survival, counts of live, dead, mummified, weaned descendants) and other general reproductive traits as age at puberty or gestation length (Vanderhaeghe et al. 2013). The combination of all these phenotypic records with genotypic information would greatly improve the final litter of a sow (Distl 2007). 1.3.2.. Reproductive QTLs. Quantitative trait loci (QTL) are defined as genomic regions which contain one or more genes that affect the variation of a quantitative trait (Andersson 2001). Over the past years, advances in the porcine genetic linkage map have allowed the identification of thousands of quantitative trait loci (QTL) for a wide range of economically important phenotypes in pigs such as growth and body composition, carcass and meat quality, reproduction, and disease resistance (Cassady et al. 2001; de Koning et al. 2001; Rathje et al. 1997). Initially, most of the QTL experiments performed to determine those regions underlying relevant traits to the pig industry were carried out by using initial linkage maps based on recombination frequency. These early QTL scans used around 300 to 700 pigs, usually coming from an F 2 obtained by generally crossing European Wild Boar with a commercial breed or crossing the exotic Chinese Meishan. 35.
(34) Genetic and Molecular Basis of Reproductive Efficiency in Swine breed with a commercial breed (Rothschild et al. 2007; Campbell et al. 2003; Buske et al. 2006a). The first QTL discovered based on this methodology, was a major locus for fat deposition on porcine chromosome 4 (Andersson et al. 1994). Later on, researchers tend to originate these F2 families using phenotipically divergent commercial breeds or large commercial synthetic lines. But to enhance and improve current selection procedures, it is necessary to identify reliable markers. Rapidly evolving genomics technologies and the recent use of high-density single nucleotide polymorphism (SNP) panels to perform large scale SNP association analyses have extended beyond experimental intercrosses to outbred populations resulting in higher resolution QTL mapping and increasing the number of discovered QTLs and eQTL(Ernst & Steibel 2013). The number of mapped QTLs is still growing and most of the updated QTL mapping results are available through the well-developed QTL database called PigQTLdb (Hu et al. 2013). A summary of the current knowledge regarding porcine QTLs can be shown at Table 1.2. Table 1.2. Number of identified QTLs by pig trait class. (Extrected from PigQTLdb, release 27 August 2015; http://www.animalgenome.org/QTLdb/) Trait Class. Number of QTL. Meat & Carcass Quality. 7,277. Health. 2,061. Production. 1,424. Reproduction. 1,235. Exterior. 1,034. Because of the relevance of reproductive traits, large scale QTL and candidate gene studies have been conducted to discover potential markers that are actively incorporated by the pig industry in marker-assisted selection schemes. To date, the most significant QTLs associated with porcine reproductive traits that have been identified are: SSC3, SSC8, SSC9, SSC10 and SSC15 for ovulation rates (Rathje et al. 1997; Rohrer et al. 1996; Wilkie et al. 1999; Campbell et al. 2003), SSC7, SSC8, SSC12, SSC13, SSC14 and SSC17 for total number piglets born (de Koning et al. 2001; King et al. 2003; Noguera et al. 2009), SSC4 and SSC13 for number of stillborn (Wilkie et al. 1999; Cassady et al. 2001) and SSC8 for uterine capacity and prenatal survival (Rohrer et al. 1999; King et al. 2003). QTL discovery in pigs has advanced rapidly and currently several eQTL experiments are underway. Although in some cases there is a lack of. 36.
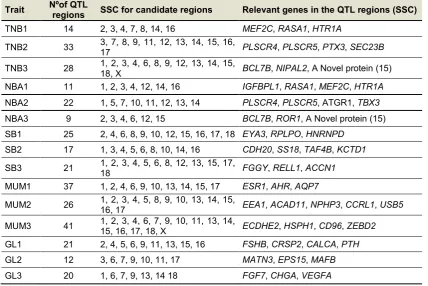
(35) GENERAL INTRODUCTION similar markers and slightly different trait definitions and measurements, these new methodologies will help to improve efficiency of pig production and in general, make pigs a more useful biomedical model (Rothschild et al. 2007). 1.3.3.. Candidate genes for litter size in pigs. The final goal of complex traits dissection is to identify the involved genes and to decipher their cellular roles and functions. Although more than six hundred QTLs for litter size have been identified, a limited number of useful genes have been found to have significant associations with reproductive traits (Buske et al. 2006b; Zhou et al. 2009). Despite some major candidate genes such as estrogen receptor (ESR), prolactin receptor (PRLR), follicular-stimulating hormone beta subunit (FSHβ), erythropoietin receptor (EPOR), osteopontin (OPN) and prolactin (PRL) have been identified to play a key role in sows’ reproductive efficiency (Hu et al. 2013) (Table 1.3), true causal genes responsible for this trait still remain scant due to the large disequilibrium linkage blocks present in the genome of livestock species(Rothschild 1996). Table 1.3. Summary of significantly associated QTL regions and some important genes within the regions for reproductive traits in maternal pig lines (modified from Onteru SK, et al. 2011). Trait. Nºof QTL regions. TNB1. 14. TNB2. 33. TNB3. 28. NBA1. 11. MEF2C, RASA1, HTR1A 2, 3, 4, 7, 8, 14, 16 3, 7, 8, 9, 11, 12, 13, 14, 15, 16, PLSCR4, PLSCR5, PTX3, SEC23B 17 1, 2, 3, 4, 6, 8, 9, 12, 13, 14, 15, BCL7B, NIPAL2, A Novel protein (15) 18, X IGFBPL1, RASA1, MEF2C, HTR1A 1, 2, 3, 4, 12, 14, 16. NBA2. 22. 1, 5, 7, 10, 11, 12, 13, 14. PLSCR4, PLSCR5, ATGR1, TBX3. NBA3. 9. 2, 3, 4, 6, 12, 15. BCL7B, ROR1, A Novel protein (15). SB1. 25. 2, 4, 6, 8, 9, 10, 12, 15, 16, 17, 18 EYA3, RPLPO, HNRNPD. SB2. 17. CDH20, SS18, TAF4B, KCTD1. SB3. 21. MUM1. 37. MUM2. 26. MUM3. 41. GL1. 21. 1, 3, 4, 5, 6, 8, 10, 14, 16 1, 2, 3, 4, 5, 6, 8, 12, 13, 15, 17, 18 1, 2, 4, 6, 9, 10, 13, 14, 15, 17 1, 2, 3, 4, 5, 8, 9, 10, 13, 14, 15, 16, 17 1, 2, 3, 4, 6, 7, 9, 10, 11, 13, 14, 15, 16, 17, 18, X 2, 4, 5, 6, 9, 11, 13, 15, 16. GL2. 12. 3, 6, 7, 9, 10, 11, 17. MATN3, EPS15, MAFB. GL3. 20. 1, 6, 7, 9, 13, 14 18. FGF7, CHGA, VEGFA. SSC for candidate regions. Relevant genes in the QTL regions (SSC). FGGY, RELL1, ACCN1 ESR1, AHR, AQP7 EEA1, ACAD11, NPHP3, CCRL1, USB5 ECDHE2, HSPH1, CD96, ZEBD2 FSHB, CRSP2, CALCA, PTH. TNB, total number born; NBA, number born alive; SB, number of stillborn; MUM, mummified foetuses at birth; GL, gestation length; 1, 2 and 3 represent parity 1, 2 and 3, respectively. 37.
(36) Genetic and Molecular Basis of Reproductive Efficiency in Swine. In order to perform a wider application across the different pig breeds and lines, these two functional genomic approaches have to be merged. 1.4. PIG GENOMICS Molecular genetics and genomics are the fields of biology that study the structure and function of genes and genomes at a molecular (nucleic acids) level. Since the first eukaryote genome was sequenced in 1997 (Mewes et al. 1997), and the first draft sequences of the human genome were published in 2001 (Cheung et al. 2001), the need to decipher the genetic basis of economically important production traits in pigs led to the development of several methodologies for retrieving structural and functional genome information: development of genetic markers (Davies et al. 1994; Coppieters et al. 1995; Groenen et al. 1995), establishment of genetic linkage (Archibald et al. 1995) and cytogenetic maps (Echard et al. 1992; Yerle et al. 1995) and identification of QTLs. In the early 1990s, the first coordinated efforts to understand the pig genome were initiated with the development of the international PiGMaP gene mapping project (Yerle et al. 1995; Archibald et al. 1995). Later on, the projects initiated by the USDA and the US agricultural universities made possible the publication of two significant linkage maps, the largest containing over 1,200 microsatellite markers. Since that, new gene markers such as microsatellites, amplified fragment length polymorphism (AFLPs), and single nucleotide polymorphisms (SNPs) have been continuously identified and mapped (Ernst & Steibel 2013). Although these approaches allowed a rapid and low-cost study of the genotypes of a large number of individuals, what greatly contributed to characterize pigs at the molecular level was the formation in 2003 of The Swine Genome Sequencing Consortium (SGSC) (Schook et al. 2005). This consortium was created by academic, government and industry representatives for sequencing the pig genome and nine years after its foundation, in November 2012 the first assembly of a domestic pig genome sequence was published (Groenen et al. 2012). The availability of a pig genome and the ability to generate genome-scale data sets associated to high throughput sequencing techniques such as transcriptome analyses of different reproductive tissues have allowed the identification and characterization of markers, pathways. 38.
(37) GENERAL INTRODUCTION and genes responsible for the genetic complexity of reproductive traits (Onteru et al. 2009). To date, main used strategies to detect those genes affecting litter size and its components have been: linkage analyses based on the identification of genomic regions linked with a phenotypic reproduction trait and more recently, genome-wide gene expression profiling, that has become a successful strategy for identifying a higher number of candidate genes related to reproduction in livestock (Du et al. 2014; Esteve-Codina et al. 2011; Ross et al. 2009; Sun et al. 2011). 1.4.1.. Transcriptome profiling. In recent years, transcriptome characterization has seen a remarkable rise, becoming a hot topic in genomic research either in human or animal genetics (Tuggle et al. 2007). The knowledge obtained by deciphering the pig genome and advances in molecular genetics, such as the transcriptomic analysis by RNA sequencing, have provided a powerful tool to better understand the genetic architecture of prolificacy-related traits. The use of microarrays and large-scale transcriptome analysis to identify differentially expressed genes in specific tissues, cell types or breeds has shed light on many aspects of porcine production traits (Samborski et al. 2013; Bauersachs & Wolf 2012; Franczak et al. 2013; Liu et al. 2014; Siqueira et al. 2014; Ramayo-Caldas et al. 2012; Corominas et al. 2013; Puig-Oliveras et al. 2014). Despite this, there have only been a few comparative studies on uterine function for prolific pigs and a low number of experiments regarding differences in endometrial gene expression between porcine breeds have yet been performed (Gu et al. 2014; H. Zhang et al. 2013; Zhou et al. 2009). 1.4.1.1. High-throughput sequencing (RNA sequencing) Current research in biology, biotechnology, and medicine requires fast genome and transcriptome analysis technologies (Mutz et al. 2013). Whole-transcriptome shotgun sequencing also known as RNA-seq, is a recently developed approach that uses highthroughput sequencing technology for characterizing the RNA content and composition of a given sample (Morin et al. 2008). Until the arrival of RNA-seq, microarrays were the standard tool for gene expression quantification. Although both techniques are generally in good agreement regarding relative gene expression quantification (Nookaew et al. 2012), microarray technology is limited towards the amount of RNA, the quantification of transcript levels and the. 39.
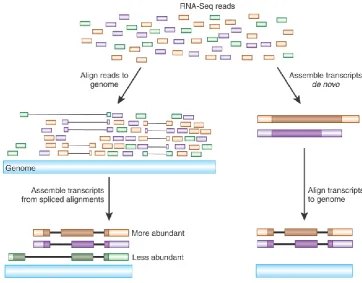
(38) Genetic and Molecular Basis of Reproductive Efficiency in Swine sequence information. The main technological limitation of RNA-seq experiments is that sequence information from transcripts cannot be retrieved as a whole (Wang et al. 2009). To solve this, once the RNA has been converted into cDNA and sequenced on a high-throughput platform generating millions of short (25 to 300 bp) reads, transcripts are randomly decomposed into short reads of several hundred base pairs. If there is no reference genome or transcriptome information, it is necessary to first reconstruct transcripts from these short reads (or read pairs), which is called “de novo” assembly (Grabherr et al. 2011). If on the contrary, we have a transcript or genome information available; reads can be directly aligned onto this reference (Figure 1.3).. Figure 1.3. Transcript assembly and quantification by RNA-Seq (Modified from Haas BJ et al., 2010). The currently available high-throughput next generation sequencing (HT-NGS) platforms differ substantially in their chemistry and processing steps (Table 1.4) and can be classified into three main groups: first generation, second generation and third generation HT-NGS platforms (Mihály & Gyorffy 2011).. 40.
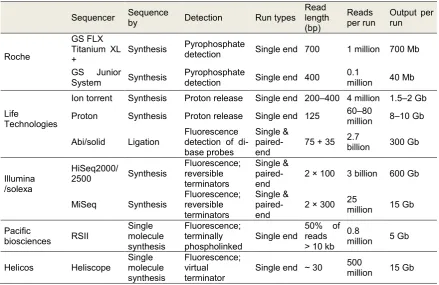
(39) GENERAL INTRODUCTION -. First generation sequencers. These first automatic sequencers used fluorescently labeled dideoxynucleotides that were analyzed on a capillary electrophoresis to produce a chromatogram or electropherogram, from which the sequence was then deduced on the computer (Karger & Guttman 2009). This technology allowed to sequence up to 96 DNA samples at the same time in only a few hours. The length of the generated sequences was around 500-1000 bases. The increment on the length of the reads compared to the manual processing of the Sanger-sequencing, along with the development of new strategies for large-scale sequencing (Whole Genome Shotgun Sequencing) increasingly facilitated assembly of genomic sequences (Buermans & den Dunnen 2014). Examples of these first generation sequencers included the ABI Prism from Applied Biosystems and the CEQ-serie from Beckman Coulter. -. Second generation sequencers. After the first draft of the human genome (3,000 million nt.) was published, in 2001 which cost nearly 3,000 million dollars (1$/nt), encouraged scientists to look for cheaper solutions as sequencing costs were unaffordable for any laboratory (van Dijk et al. 2014). In this context, the called second generation sequencers were developed, which were able to generate hundreds of thousands of sequences reactions in parallel (high-throughput) by immobilizing these reactions into a solid surface. Thus, the quantity of reagents required is minimized and the cost per read base decreases (Pareek et al. 2011). Some of the most widely known sequencers belonging to this group are the GS-FLX (454) from Roche, the ABI SOLiD form Applied Biosystems, the Genome Analyzer from Illumina and Ion (PGM, Proton, S5) from Ion Torrent. The GS-FLX (454) was based on the DNA pyrosequencing. It is a non-fluorescent technique that measures the release of pyrophosphate in a polymerization reaction using a series of coupled enzymatic reactions that emit light whenever a nucleotide is incorporated (Margulies et al. 2005). This emission produces an image that is subsequently analyzed and interpreted by the computer, sending back the whole nucleotide sequences. At the same time, two other companies developed other technologies for massively parallel sequencing DNA. SolexaIlumina, which sequencing technology was based in a DNA polymerization where a fluorescently labeled nucleotide was incorporated (Bentley et al. 2008). In this method, to. 41.
(40) Genetic and Molecular Basis of Reproductive Efficiency in Swine determine the sequence, four types of reversible terminator bases (RT-bases) are added and non-incorporated nucleotides are washed away (Figure 1.4-a). Then, a camera takes images of the fluorescently labeled nucleotides and the dye along with the terminal 3' blocker, is chemically removed from the DNA, allowing for the next cycle to begin. Unlike pyrosequencing, the DNA chains are extended one nucleotide at a time and image acquisition can be performed at a delayed moment. And the SOLiD (Sequencing by Oligonucleotide Ligation and Detection) method from Applied Biosystems, which is based in a sequence by ligation to the DNA chain of labeled octamers with a known sequence (McKernan et al. 2009). Subsequently, the fluorescent signal emitted after each ligation is detected (Figure 1.4-c). Ion Torrent Systems Inc. developed a totally different technology based on the detection of those hydrogen ions that are released during the DNA polymerization (Rothberg et al. 2011). A micro well containing the template DNA strand is flooded with each type of single nucleotides. If the introduced nucleotide is complementary to the leading template, it is incorporated into the growing complementary strand causing the release of a hydrogen ion that activates a hypersensitive ion sensor. As the number of released hydrogens is proportional to the electronic signal, the sequence pattern can be predicted (Figure 1.4-b).. Figure 1.4. Basic principles from Illumina/Solexa (a), Ion Torrent (b) and (c) SOLiD sequencing technologies (Corney et al., 2015). 42.
(41) GENERAL INTRODUCTION Thanks to the development of these second-generation sequencers, the final cost of each nucleotide decreased from 10$ in 1990 to 0.01$ in 2005 (Pareek et al. 2011). -. Third generation sequencers. The continuous need to descend sequencing costs and increase the reliability of the resulting sequences has led to the recent development of the called third-generation sequencers (Pareek et al. 2011). This new era is based on the sequencing of a single DNA molecule (single molecule real-time sequencing). The first third generation sequencer designed by Helicos BioSciences, was able to real time sequence billions of small unique DNA molecules attached to a solid surface, generating fragments of around 25-45 bases (Harris et al. 2008). In a step further, the companies Pacific Biosciences and Oxford Nanopore, developed a technology able to read up to 1000 nucleotides in a single run, solving all the problems associated with second-generation sequencers (ie, homopolymer regions, tandem repeats…). This new technology, is a completely different approach where the DNA polymerase its anchored to a solid surface called “nanopore” (Pennisi 2012). Finally, ZS Genetics is using electron microscopy to read the DNA sequence tagged with iodine, bromine or trichloromethyl, directly on an electronic image. Some examples of this type of sequencers are Helicos tSMS, MinION, gridION, and ZX Genetics. -. Fourth generation sequencers. Althought this methodology is still very experimental, fourth generation sequencers would be able to carry out a sequencing experiment on individual cells in a histological section, i.e. in their own biological context. Applications of this new methodology would be the interrogation of those DNA sequences likely to have undergone somatic mutations, differentiate between members of a gene family and perform multiplex detection of transcripts (Koboldt et al. 2013).. 43.
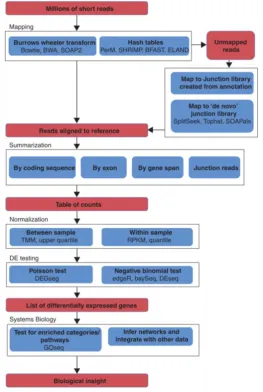
(42) Genetic and Molecular Basis of Reproductive Efficiency in Swine Table 1.4. Current available NGS platforms and their characteristic features (adapted from Buermans et al.,2014) Sequencer. Roche. Life Technologies. Illumina /solexa. Sequence by. GS FLX Titanium XL Synthesis + GS Junior Synthesis System Ion torrent. Synthesis. Proton. Synthesis. Abi/solid. Ligation. HiSeq2000/ 2500. Synthesis. MiSeq. Synthesis. Pacific biosciences. RSII. Helicos. Heliscope. Single molecule synthesis Single molecule synthesis. Detection. Read Run types length (bp). Reads per run. Output per run. Pyrophosphate detection. Single end 700. 1 million. 700 Mb. Pyrophosphate detection. Single end 400. 0.1 million. 40 Mb. Proton release. Single end 200–400 4 million 60–80 Proton release Single end 125 million Fluorescence Single & 2.7 detection of di- paired75 + 35 billion base probes end Fluorescence; Single & reversible paired2 × 100 3 billion terminators end Fluorescence; Single & 25 reversible paired2 × 300 million terminators end Fluorescence; 50% of 0.8 terminally Single end reads million phospholinked > 10 kb Fluorescence; 500 virtual Single end ~ 30 million terminator. 1.5–2 Gb 8–10 Gb 300 Gb 600 Gb 15 Gb 5 Gb 15 Gb. Once the RNA sequencing has been performed, making sense of the huge amount of data generated depends on the scientific question of interest (Oshlack et al. 2010). If the aim of our study is, for example, determining differences in allele-specific expression, we would require a precise estimation of the prevalence of transcribed single nucleotide polymorphisms (SNPs). If we are identifying fusion genes or aberrations in cancer samples, it would be necessary to find novel transcripts and/or RNA editing events (Rapaport et al. 2013). However, the primary use of RNA-seq is gene expression profiling between samples. In this case, it is necessary to count the reads that fall onto a given transcript, which serves as a digital measurement of transcript abundance being the starting point for gene expression quantification (Robinson & Oshlack 2010). The constant development of new software and the numerous characteristics of each transcriptomic analysis (selected specie, sequencing technology, quality of the reference genome...) have increased the number of available pipelines to analyze these massive sequencing data, being almost exclusively for each study (Carvalho & Rustici 2013). The standard and most common pipeline for detecting differential expression (DE) in RNA-seq consists in five main steps (Figure 1.5): mapping, assembly, data normalization, statistical test of DE and biological contextualization of the obtained results (R. Huang et al. 2011). First,. 44.
(43) GENERAL INTRODUCTION reads are mapped to the genome or transcriptome. Subsequently, mapped reads are assembled into gene, exon or transcript-level expression, depending on the aims of the study. After so, summarized data has to be normalized in order to perform statistical testing for differential expression (DE). Then, statistical analysis leads to a ranked list of genes with associated p-values and fold changes. Finally, to gain biological insight from these, systems biology approaches should be performed, similar to those performed on microarray experiments (Oshlack et al. 2010).. Figure 1.5. Overview of the RNA-seq analysis pipeline for detecting differential expression. The steps in the pipeline are in red boxes; the methodological components of the pipeline are shown in blue boxes and bold text; some software examples and methods for each step are shown by regular text in blue boxes (Extracted from Finotello F et al., 2014).. 45.
(44) Genetic and Molecular Basis of Reproductive Efficiency in Swine As a digital measure (count data), RNA-seq scales linearly even at extreme values and allows to capture a wider range of expression values providing also, information on RNA splice events (Mortazavi et al. 2008). This technique provides nearly unlimited possibilities in modern bioanalysis. 1.4.2.. GENE EXPRESSION ESTIMATION. Quantification of gene expression can be performed by a wide range of methodologies. The first technique applied to measure the expression of a gene was the Northern blot hybridization (Streit et al. 2009). This method, assess the relative expression level of transcripts based on the intensity of the hybridization band. A more specific and accurate technique was developed later on, the reverse transcriptase quantitative PCR (RT-qPCR) (Tse & Capeau). This method allows performing either a relative or an absolute quantification of the expression level of a particular mRNA. Recently, several techniques such as expressed sequence tags (ESTs), serial analysis of gene expression (SAGE), differential display (DD), expression microarrays and high throughput sequencing (HTS) have emerged allowing researchers to analyze gene expression at a whole-genome level. There are two main quantification strategies: relative to an external standard curve or to one or more co-amplified internal control mRNAs (Pfaffl 2012).. -. Quantification relative to external standard curves. This method is based on the use of a dilution series of an external standard, which is then used to generate a standard curve of threshold cycle (Ct) against an initial target copy number. Copy numbers of unknown samples can be estimated from the linear regression of that standard curve, considering the y-intercept giving the sensitivity and the slope giving the amplification efficiency (Bustin et al. 2005). To construct these standard curves, we can use from PCR fragments, single-stranded sense-strand synthetic oligodeoxyribonucleotides to commercially available universal reference RNAs and although they are often highly reproducible, external standards cannot detect or correct for inhibitors that may be present in the samples (Livak & Schmittgen 2001).. 46.
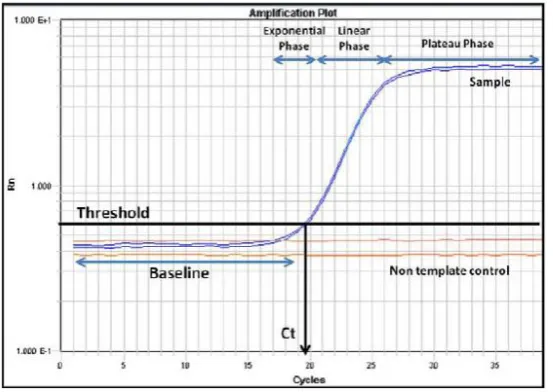
(45) GENERAL INTRODUCTION -. Quantification relative to internal standards or control mRNAs. This method is based on the comparison of the Ct values from target RNAs to those of one or more internal reference genes. We obtain a ratio of the target-specific signal to the internal reference as a measure of its expression, which represents a corrected relative value that can be compared between samples. In this case, the amplification efficiencies of target and reference genes have to be similar, since this directly affects the accuracy of any calculated expression result. Several models have been published to correct for efficiency however, within relative quantification, the 2. -ΔΔCT. Ct method is the most used (Livak & Schmittgen 2001). This. method assumes that the RT-qPCR efficiency is 100 % and is based on the use of reference genes whose expression is stable between the analyzed samples to correct for any difference in sample managing. Normalized expressions are then made relative to a calibrator sample which is randomly chosen. Since the expression of most reference genes vary significantly with treatment or between individuals, relative quantification can be confusing sometimes (Anon 2010). 1.4.2.1. Gene expression quantification by RT-qPCR Reverse transcriptase-quantitative polymerase chain reaction (RT-qPCR) is a powerful, sensitive and reliable technique that has become the gold standard for measuring and evaluating the expression of single or multiple genes. RT-qPCR is used when the starting material is RNA, either mRNA or other RNA source, which is first transcribed into complementary DNA (cDNA) by a reverse transcription reaction and then is used as the template for PCR amplification (Tse & Capeau). Ideally, PCR primers should be designed to span an exon-exon junction. This design reduces the risk of false positives from amplification of any contaminating genomic DNA, since the intron-containing genomic DNA sequence would not be amplified. If primers cannot be designed to separate exons or exon-exon boundaries, it is necessary to treat the RNA sample with RNase-free DNase I or dsDNase in order to remove contaminating genomic DNA (Bustin 2004). Once the RNAs are reverse transcribed to cDNAs, they are amplified by a variant of the polymerase chain reaction (PCR) used to simultaneously amplify and quantify the amplification product (Mullis et al. 1986). This quantification of the amplified product can either be absolute (number of molecules of a transcript) or relative. 47.
(46) Genetic and Molecular Basis of Reproductive Efficiency in Swine (proportion of transcripts in relation to one or more control genes) and it is based on the fluorescence emitted by an excited fluorochrome during the exponential phase of the reaction (Figure 1.6).. Figure 1.6. RT-qPCR amplification plot.. When the reaction reaches the exponential phase, the real-time PCR instrument estimates two values: the “threshold line”, which is the level of detection at which a reaction reaches a fluorescent intensity above background and the “cycle threshold” (Ct), which is the PCR cycle at which each sample reaches this level. This Ct is inversely proportional to the expression level. Low expression levels result in high Ct and the opposite (Bustin et al. 2005). RT-qPCR techniques can be classified depending on the detection chemistries, which can be either specific (probe-based) or non-specific (non-probe based): -. Non-probe based chemistry. Techniques based on unspecific fluorochromes are based on the exponential detection of the produced double stranded DNA (dsDNA) by a fluorochrome that binds in a non-specific way to each double chain produced during the PCR. The most widely non-probe-based chemistry detects the binding of SYBR Green to dsDNA (Bustin 2000). In solution, this intercalating dye exhibits little fluorescence. However, when it binds to the dsDNA emits a strong fluorescent signal. The intensity of the fluorescence increases as the PCR products accumulate. This technique is the most economical and easiest to use. It allows assessing specifically amplified DNA fragments from the melting temperature (Tm) by analyzing the melting curves. However,. 48.
(47) GENERAL INTRODUCTION since the dye does not discriminate the double-stranded DNA from the PCR products and those from the primer-dimers, overestimation of the target concentration can be a problem (Schmittgen et al. 2000; Rajeevan et al. 2001) -. Probe-based chemistry. Techniques based on probe sequences that fluoresce upon hydrolysis or hybridisation use at least one fluorescently labeled primer (Juskowiak 2010). This probe is usually attached to a fluorochrome and a quencher and it hybridizes in the intermediate zone between the forward and the reverse primer; that is, within the amplicon. Thus, when the probe is intact, the proximity between the fluorochrome and the quencher inhibits the emission of fluorescence. In the other hand, when the fluorophore and the quencher are distant due to degradation of the probe by the 5'-3 'exonuclease activity of DNA polymerase, fluorescence is emitted (Schmittgen et al. 2000). This allows monitoring a change in fluorescence pattern only if the DNA sequence complementary to the specific probe is amplified. With this approach, any possible nonspecific amplification is eliminated. Most widely used probes are TaqMan® from Life Technologies and HybProbes from Roche. To provide meaningful and reproducible results, parameters such as RNA extraction, RNA integrity, cDNA synthesis, primer design, amplicon detection, and data normalization have to be taken into account (Bustin et al. 2009).. 1.4.2.2. MicroRNA expression quantification by RT-qPCR. Despite the small size of miRNAs, there are some technologies that enable high-throughput and sensitive miRNA profiling such as microarrays (Pradervand et al. 2009), real-time quantitative PCR (RT-qPCR) (Mei et al. 2012) and bead-based flow cytometry (Jang et al. 2011). Because of its accuracy and specificity, RT-qPCR has become the method of choice not only for measuring gene expression levels, but for analyzing the expression level of non-coding RNAs including miRNAs (Schwarzenbach et al. 2015). RT-qPCR for measuring miRNAs expression is based on the same concepts applied to determine mRNA expression (Mei et al. 2012). The challenge in adapting this technique to miRNA expression quantification resides on their short length, because miRNAs have approximately the same size as conventional RT-. 49.
Figure

+7


Documento similar
In this work we have been used classic and ab initio molecular dynamics simulations combined with electronic structure calculations to reproduce en- tire sequences of collisions and
genetic diversity even without having any knowledge of the bare existence of it (Harlan, 1992). Nevertheless, classic breeding has limitations. It was not until the “Green
However, in the case of copper, hundreds of complexes based on picolinic acid derivatives have been prepared, giving rise to molecular complexes [20, 21]
This chapter delineates the main concept that the empirical study seeks to explore: the construction of one's identity, its components, processes and changes in order to shed light on
Doctoral thesis submitted to the Autonomous University of Madrid for the Degree of Doctor of Philosophy (Ph.D.) in Biomolecular Sciences. in possession of the
c) 27K Sympathetic paraganglioma; Meta: Metastasis. f) Diagnosis was clinically determined. g) Diagnosis of PC.. d) B: without metastasis or M:
"BRAF mutations in thyroid tumors are restricted to papillary carcinomas and anaplastic or poorly differentiated carcinomas arising from papillary carcinomas." J
To date, in the case of meagre (Argyrosomus regius), no microsatellite marker panels have been developed, although several specific and interspecific microsatellites have been used
