BRICS’ impact over Brazilian bilateral commercial relations with China
1Abstract2
Which is BRICS’ impact over bilateral commercial relations? Our hypothesis states that the countries’ group creation in 2006 - formed by Brazil, Russia, India China, and, more recently, South Africa - increased commercials trade among them. The research design combines descriptive statistics, paired sample t test and deep case study comparison (Brazil and China) to estimate production goods variation between 2000 and 2013. All data were collected from two sources: one from the Brazilian Ministry of Development, Industries and Exterior Trade (MDIC in Portuguese) and the other one from Interamerican Development Bank (BID in Portuguese). The preliminary results suggest that the mean difference of allocated resources before and after the BRICS’ institution is statistically significant.
Introduction
The historical of trade relations between Brazil and China reports since the half of the last century,
being indeed effectuated 40 years ago with the signature of the mutual reconnaissance diplomatic of
the countries (Becard, 2011). Both aimed to obtain autonomy in international system and, despite
clear differences between them, the Asian one with its left-winged Public Republic and the Latin
American one with considerate influence from United States, it was already possible to percept this
wish from the Chinese part after its rupture with USSR in the end of the 1950’s and from the
Brazilian part with a less repressive approach from the dictatorship since the moment Geisel came
as a president, without mentioning Brazil’s ex-vice-president visit in 1961 to China, João Goulart3.
Back to 1974, first year of Geisel’s mandate, when the bilateral relations between China and Brazil
began developing – having as main objective international prestige –, came a bigger convergence of
interests of the countries as a consequence, along with the beginning of the alignment of their
political positions. It is not possible to discard, however, that China’s subjects of the domestic
politics hindered the prompt start of the bilateral cooperation. Effectively, the trade began to
develop in 1978, with the signature of the first trade agreement between both countries, despite that,
the relations kept embryonic4.
In the 1970’s Brazil-China’s relations had as single mark the diplomatic reconnaissance. After that,
remained stagnation due to insufficiency of resources from the countries, situation that extended
1
Replication files are available at: http://dx.doi.org/10.7910/DVN/27543.
2
We thank a lot Prof. Dr. Dalson Britto for all his advices to us. Not only him, but also all UFPE’s Political Science Quantitative Methods Group.
3
Becard, 2011; Oliveira, 2004; Oliveira, 2010.
4
Idem
until the beginning of the 1980’s, when both countries politics suffered changes (Becard, 2011). In
Brazil, diplomacy researched approximation with countries in similar develop conditions out of its
continent – making contact with the Asians – and, simultaneously, external politics of China aimed
to establish South-South cooperation which brought concrete advantages to itself in the
economical-trade field. As a consequence “more than 20 bilateral acts with [Brazil] during the 1980’s decade
[were signed] – including basic deals in areas such as science and technology, nuclear energy and
cultural and educational cooperation –” (Becard, 2011: 33). This set of actions drew closer
relations, and in 1984 and 1988, Brazilian presidents of each year (João Figueiredo and José
Sarney, respectively) made a visit to China, thereby beginning an effective cycle of cooperation5.
About the 1990’s, with the Cold War ending, Brazil starts to prioritize its relationship not only with
developed countries, but also with the Asian-Pacific region, so the relations with China were
extended. The Asian crisis, although, followed in 1999 by a Brazilian crisis, didn’t let a wider
enlargement in trade relations – although the accomplished in spatial area in 1994 when transactions
values between the countries seemed substantive, “proximally US$ 820 millions in exports and US$
460 millions in imports” (Becard, 2011: 36) –, being worth mentioning an increasing of alignment
of countries’ positions in the international system6.
Getting, finally to the turn of the century, since 2000 is possible to think the possibility to observe a
growth in Brazil-China’s relations, seen that in 2001 it was identified by the Goldman Sachs’
chief-economist, Jim O’Neil, the presence of four countries that expressed individual characteristics that
made them similar7. From there came the BRICS’ idea, old BRIC, that’s being develop since then.
The two countries in question, along with Russia, India and, more recently, South Africa are
considered emergent countries, i.e., with capacity to reach a high level of power, even though they
were fulfilled in the past – and still are today – of problems more known to be characterised as from
the old nominated “third world” such as hungry and inequality. It is estimated that the sum of the
gross domestic product (GDPs) of all these countries would have more magnitude than the first
place in this concept, the United States, approximately in the year of 2018. After that, it was used,
as the term as the idea, for the group, when in 2009 it conducted the first forum in Ekaterinburg,
Russia8.
5
Ibidem.
6
Becard, 2011; Oliveira, 2004.
7
Itamaraty, 2014. (1)
8
Costa Lima, 2013; Thorstensen, 2012.
It’s important to emphasise the actual vision about these countries, according to Hurrel (2009), they
are acquiring power in such a way that they have the possibility to realise political-economical
modifications in global field.
From this Hurrel’s vision is possible to formulate the hypothesis that the XXI century may observe
a substantial deepening in Brazil-China’s trade relations, based in a new situation of great
integration between the nations, due to BRICS actuation as a propellant to the growth of relations.
After justification of the choice of China as specific country, and based on the Brazilian Ministry of
Development data it was analysed the trade exchange between Brazil and BRICS countries, firstly
in what it concern exports, then imports, expecting that those data leads to confirmation of the
hypothesis that bilateral trade between the countries raised and entrenched, from the analysis of
products that were exchanged, followed by the overview of trade agreements and barriers that were
overcome.
Justifying China
First, it was considered that all the economics were based in the dollar chart and thus leading to a
non-real value, so all of them were adapted to the same considerations of values. Based on the data,
it was realized that China was the biggest partner in both relations trades. The t-test use in this study
was important to show mean differences between the countries along the years, which were divided
in two groups: the first is dated before official BRICS’ creation (2000-2006). The second one is
dated after the event (2007-2013). Commercial relations numbers were used in two different ways:
in descriptive graphics they were divided in a one million scale for a better understand to the reader.
The others, such as t-test analysis, it was used nominal values, for a deeper and more complete
analysis.
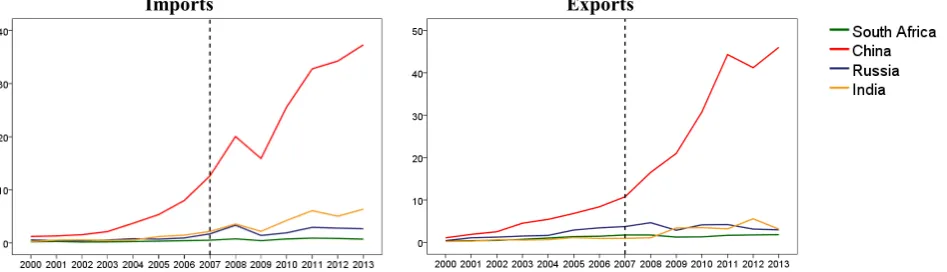
In general BRICS proportioned an amplification in Brazil trade relations between the others
members as expected. Analyzing Picture 1 by FOB9 system, it is verified-mostly in imports- an
increasing in Brazil’s transactions trade after the creation of the group.
9
As known as Free On Board, it means all the trade transactions, but it does not guarantee the product entrace into the country without lost and damages. For more informations can be obtained in Lunardi,2000
Picture 1 - Commercial Transactions (FOB) of Brazil and South Africa, China, Russia and India between 2000 and 2013 (in billions USD)
Imports Exports
Source: Authors elaboration (2014) based on data from the Ministry of Development, Industry and Foreign Trade (MDIC, in Portuguese).
Comparing imports/exports mean between Brazil and the others participants (China, India, Russia
and South Africa) for the last 13 years (2000-2013), it was statistically observed a significant
difference in all the cases (p-value<0.05), as seen on Table 1 in a more detailed way.
Table 1 – Mean difference of Brazil1’s commercial trades (FOB) with other BRICS’ members before and after the creation of the group
COUNTRIES
IMPORTS EXPORTS
Before After Mean difference p-value Before After Mean difference p-value
South Africa 0,27 0,70 0,43 0,000 0,82 1,62 0,79 0,002 China 3,33 25,50 22,17 0,000 4,38 30,1 25,70 0,001 Russia 0,64 2,39 1,75 0,000 1,75 3,67 0,47 0,002 India 0,73 4,23 3,50 0,000 0,63 2,98 0,68 0,002 Source: Authors elaboration (2014) based on data from the MDIC.
In fact, BRICS’ creation amplified Brazil’s commercial relations, acting in all aspects, as an
economic catalyst, mostly in China, where import and export present huge growths: 665 % and
587%, respectively, beside a USD 3.53 bi commerce balance mean to Brazil.
By the end, all data exposed, China’s choose was justified as analytical comparison in this study
due to a great impact exerted in Brazilian economics, using bilateral agreements which integrate
bilateral economics.
Trade exchange
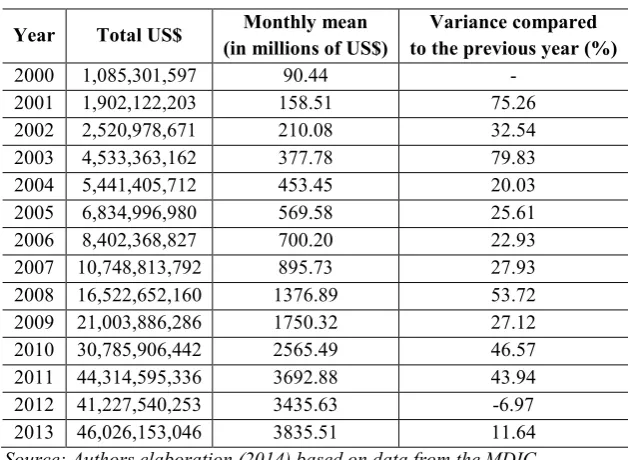
Analysing total exports from Brazil to China, it is noticed a growing export mean: 62.54% of
annual growth among 2000-2003. However, there was a retraction in the rhythm of exports between
2004-2007 (with an average increase of only 31.16% per year in the period), followed by the return
of the raise of the exports in 2008-2011 (average increase of 42.83% per year), even with a
[image:4.595.77.551.125.261.2]retraction in 2009 it was already a progress in comparison with the four previous years. What stands
out in the table is the retraction of 6.97% in 2012, followed by a little recuperation growth of
[image:5.595.154.471.146.376.2]11.64% in 2013.
Table 2 – Total exports from Brazil with China (2000 to 2013)
Year Total US$ Monthly mean
(in millions of US$)
Variance compared to the previous year (%)
2000 1,085,301,597 90.44 -
2001 1,902,122,203 158.51 75.26 2002 2,520,978,671 210.08 32.54 2003 4,533,363,162 377.78 79.83 2004 5,441,405,712 453.45 20.03 2005 6,834,996,980 569.58 25.61 2006 8,402,368,827 700.20 22.93 2007 10,748,813,792 895.73 27.93 2008 16,522,652,160 1376.89 53.72 2009 21,003,886,286 1750.32 27.12 2010 30,785,906,442 2565.49 46.57 2011 44,314,595,336 3692.88 43.94 2012 41,227,540,253 3435.63 -6.97 2013 46,026,153,046 3835.51 11.64 Source: Authors elaboration (2014) based on data from the MDIC.
Going to an analysis of the imports that Brazil made with China, it is possible to percept a growing
raise since 2000 to 2008 (average increase of 43.36% per year in the period), followed by a
retraction in 2009 of 20.62%, more accentuated than the one observed in exports, quickly recovered
with the growth of 60.89% in 20010, but with a retraction between 2011-2013 (with an average
increase of 13.82% in the period).
Table 3 – Total imports from China to Brazil (2000 to 2013)
Year Total US$ Monthly mean
(in millions of US$)
Variance compared to the previous year (%)
2000 1,222,098,317 101.84 -
2001 1,328,389,311 110.70 8.70 2002 1,553,993,640 129.50 16.98 2003 214,78,01,000 178.98 38.21 2004 3,710,477,153 309.21 72.76 2005 5,354,519,361 446.21 44.31 2006 7,990,448,434 665.87 49.23 2007 12,621,273,347 1051.77 57.95 2008 20,044,460,592 1670.37 58.81 2009 15,911,133,748 1325.93 -20.62 2010 25,595,419,005 2132.95 60.86 2011 32,790,634,943 2732.55 28.11 2012 34,251,274,099 2854.27 4.45 2013 37,303,342,491 3108.63 8.91
Source: Elaboration of the authors (2014) through the data from the MDIC.
[image:5.595.153.470.526.754.2]The representation of both tables above has a better visualisation as a timeline in the graphic that
follows, along with the balance of each year. Observing in the bar that represents the balance, it is
possible to observe that the trade surplus to Brazil existed from the beginning of the century until
2006, becoming negative in 2007 and 2008, after the continue process of retraction since 2004.
Between 2009 and 2010 there was no great movement, followed by a raise in 2011 and 2013, even
with the retraction of 2012.
Graphic 1 – Imports, Exports and Trade Balance from Brazil with China, 2000 to 2013 (in millions of US$)
Source: Elaboration of the authors through the data from the MDIC.
After this presentation of data, the first way to try to explain those variations of imports and exports
is in what concerns to the products involved in those trade exchange.
Barbosa (2006) highlight what was observed in Graphic 1: Brazil would manage to keep the surplus
in its relation with China until 2003. The author justifies that this initial moment was successful due
to the fact that the principle of the Brazil to try to conquer the market of commodities in China. This
situation is equally mentioned by Becard (2011: 36-37) when it mentions that the products exported
by Brazil were restrained to only a few productive sectors (such as soya and iron ore) and that the
biggest part of these products from 2001 and 2003 were of low technological-content (55%),
justifying the later retraction of commodities by its low price and high Chinese concurrence.
Making a timeline in the graphic below, following the Standard International Trade Classification
(SITC) of the products exported from Brazil to China between 2000 to 2013 – data that came from
the Interamerican Development Bank (BID in Portuguese) –, this situation described in the
bibliography is clear.
Graphic 2 – Exported products from Brazil to China, 2000 to 2013 (in thousands of US$)
Source: Elaboration of the authors (2014) through the data of the Interamerican Development
Bank (BID in Portuguese).
Through the Graphic 2 it may be noticed a clear domination of raw materials in exports from Brazil
to China, accompanied right after for a raising expression of fuel. However the presence of the
manufactured products exists, it’s not expressive.
In imports, it is noticeable the participation more equitable of the products that come into Brazil,
being the most part of them products that involve a higher level of technology, the manufactured, as
it is possible to observe in the following graphic.
Graphic 3 – Imported products from China to Brazil, 2000 to 2013 (in thousands of US$)
Source: Elaboration of the authors (2014) through the data of the BID.
There is no product that stands out in imports. However, key-sectors influence is clear both in
Brazil’ imports and exports. While there is a clear preference in imports to manufactured products
(including here the good, diverse articles and machines), the exports is more characterized by raw
materials, primary goods with low price in the market. From this constant tendency is possible to
comprehend the retraction of the commercial balance that Brazil obtains.
Trade agreements
Carrying on with the attempt to better understand the commercial evolution between China and
Brazil, it will be analysed the bilateral trade agreements among them. Years were divided based on
Brazilian presidents’ mandates: Fernando Henrique Cardoso10(2000-2002), Luís Inácio Lula da
Silva 11(2003-2010) and Dilma Rousseff (2011 until nowadays)12.
Using comparative analysis between bilateral agreements done by FHC and Lula, is verified a
bigger endeavor in the last one, that has done more than 27 agreements in contrast with none from
the first one during the specified period13. The specific year of 2004 was expressive based on
relations advance, as Brazilian president traveled to China with a delegation, what allowed bilateral
acts and business contracts about steel productions, aluminum, bauxite and oil extraction,
thermoelectric plants and financing development projects to export14.
That visit was rewarded in the same year, occasion which Brazil recognized China as market
economy, waiting in exchange a support to become a member of the UN Security Council, what
was not attained. Beyond that divergence, other episodes where both countries took different
positions are recurrent, for example: agriculture theme on WTO, and Information Technology
Agreement15.
Although these political dichotomies, countries’ approaching on Lula’s governments was stimulated
by various tool in his 2009’s second visit to China, such as:
i) “Agenda China”, in trade area; ii) a Commission of High Level of Concentration and Cooperation between Brazil and China (Cosban in Portuguese) in 2006, responsible for coordination of various lines of bilateral relations; iii) Strategic Dialog, created in 2007; iv) Brazil-China Financial Dialog, in 2008. For the period of 2010-2014, it was established a Combined Action Plan, including all cooperation bilateral areas, approved on April, 2010[...] (BECARD, 2011: 38).
10
As known as” FHC”
11
As known as “Lula”
12
For ethical questions it will not commented today’s president government.
13
Itamaraty, 2014 (2).
14
Barbosa et al., 2006; Bercard, 2011.
15
Idem.
Among all strategies above mentioned, the one that stands out the most is the “Agenda China”,
created as an attempt to equalize Brazil-China relations, tries to show that the tropical country
cannot only offer energetic technology and primary products, but also products that are less known
by the Chinese market and that are sophisticated technologically. In other words, it is nothing more
than a strategy to increase the numbers of manufactured products exported from Brazil and gets
equilibrium in import and export relations, looking for Chinese investments and to get a higher
number of exports in products which the Asian country is not self-sufficient to try to reach a bigger
convergence in their action16.
Tariff barriers
About the trade barriers that exist, they are divided in taxed and non-taxed barriers. The ones that
concern the last group there was a diminution as seen before, besides of a higher transparency in
models and methods of license standards of China after its joint into the World Trade Organization,
in 200117.
Non-tax barrier do not use monetary direct costs, but it affects directly trade process for being
composed by sanitary, non-sanitary and technical measures which are essential to the transaction
conclusion, resulting the impossibility of products entrance in the country if not checked. They are:
“Law about the Quarantine of Entry and Leaving of Fauna and Flora; Law about Alimentation
Hygiene; Law about the Prevention of Animal Diseases; Regulation about the Quarantine
Phytosanitary; Law about the Inspection of the Merchandise of Import and Export; and the Law
about Health in Borders and Quarantine” (MDIC, 2008). The regulation of this process is made by
the organ General Administration of Quality Supervision, Inspection and Quarantine (AQSIQ).
Taxed barriers are the ones based on charges, where it has a tax of import Chinese, for example,
they are determinate by the country tax commission. It is calculated by cost price, insurance and
freight (CIF), added an aliquot (MDIC, 2008). Tariffs are divided in two big groups: the ones which
China has in some way commercial agreements with, and the others that don’t have it.
In the first one, there are three essential taxes: for the Less-Favoured-Nation (NMF in Portuguese),
where only WTO members participate; Agreement Custom Taxes, destined to countries with
16
Becard, 2011.
17
MDIC, 2014. (2) ; Mortatti et al., 2011.
preferential agreements with China; and Special Preferential Taxes, focused on products provided
from these countries18.
In the second point there are the general customs tariffs, including those which come from countries
without any commercial relations with China, undetermined origin or products made in El Salvador
(although this country is a WTO member, it is not included in the first group). It cannot be forgotten
custom and provisional contingency taxes, used provisionally19.
Considering the product gender to be imported to China, there are limitations, such as products that
contain or based on animal source, mineral or opium. Superfluous products – cigarettes, alcohol
based drinks – are not excluded, although they are highly taxed in their entry and for internal
consumption.
Conclusion
The comparison made in the first section confirms that China has the biggest growth in its trade
with Brazil, both in imports and exports. After this apparent confirmation of our hypothesis with
FOB data it may seem reasonable to think that the data confirmed our first thought that the relations
between the countries have grown, especially after BRICS’ impulse. Nevertheless, it must be taken
in account that this work has its focus on the analysis of trade exchange variable and that there are
lots of others important variables to answer the question raised in the beginning, such as the impact
that the exchange agreements cause in trade reality.
Another important variable example is the political relation. Barbosa (2006: 7) uses the term
“diplomatic illusion” to describe China-Brazil bilateral relation based in the political convergence.
Although these countries still have lot of political divergence, it must be taken in consideration the
meaningful results in economical-trade area with tariff barriers decrease and Brazil’s conquer of
advantages in Chinese market.
Brazil’s main trade partner is China since 2008-200920. However, quality and quantity difference of
exported products from Brazil (mostly crude products) and imported (mostly manufactured
products) is troubling to Latin American country21.
18
MDIC, 2008.
19
Idem
20
Becard, 2011; MDIC, 2009.
21
Frischtak e Soares, 2013.
So, not giving a final verdict, but leaving space to say that the model created above may be
overrated, due to the exclusive use of FOB exchange data, ignoring the possibility to exist
meaningful relations outside it. The question stills open to more research, possibly the actual
situation changes positively with the application of China Agenda for a longer period of time.
Bibliographic reference
BANCO Internacional de Desenvolvimento (BID). Estatísticas e indicadores. Available in: <http://www10.iadb.org/dataintal/CnsConsultaCompleta.aspx>. Access in: 03 August 2014.
BARBOSA, Alexandre de Freitas; MENDES, Ricardo Camargo. As Relações Econômicas entre Brasil e China: Uma Parceria Difícil. FES Briefing Paper, São Paulo, jan. 2006. Available in: <http://www.observatoriosocial.org.br/arqmorto/download/brasil-china.pdf>. Access in: 31 July 2014.
BECARD, Danielly Silva Ramos. O que esperar das relações Brasil-China? Rev. Sociol. Polít., Curitiba, v. 19, n. suplementar, p. 31-44, nov. 2011.
CASTILHO. Marta Reis. Impactos distributivos do comércio Brasil-China: Efeitos da intensificação do comércio bilateral sobre o mercado de trabalho brasileiro. Revista Brasileira de Comércio Exterior, n. 91, april - jun. 2007.
COSTA LIMA, Marcos. Relações Comerciais e de Investimentos do Brasil e os demais países do BRICS. In: José Vicente de Sá Pimentel (Orgs.). O Brasil, os BRICS e a agenda internacional. 2ª ed. Brasília, Ed. FUNAG, 2013, p. 221:249.
FRISCHTAK, Claudio R.; SOARES, André. As relações econômicas Brasil-China: trajetória recente e perspectivas. Fórum Nacional, n. 510, 18-19 sept. 2013.
HURREL, Andrew et al. Os BRICS e a ordem global. 1ª Ed. FGV, 2009. 168 p.
ITAMARATY. BRICS: Brasil, Rússia, Índia, China e África do Sul. Available in: <http://www.itamaraty.gov.br/temas/mecanismos-inter-regionais/agrupamento-brics>. Access in: 15 May 2014. (1)
____________. China. Available in: <http://www.itamaraty.gov.br/temas/temas-politicos-e-relacoes-bilaterais/asia-e-oceania/china/pdf>. Access in: 31 July 2014. (2)
LUNARDI, Ângelo Luiz. Condições Internacionais de Compra e Venda - Incoterms 2000 Edições
Aduaneiras, São Paulo, p.105-114 2000.
MINISTÉRIO do Desenvolvimento, Indústria e Comércio Exterior (MDIC) – Secretaria De Comércio Exterior. Intercâmbio comercial brasileiro: China. Available in: <http://www.mdic.gov.br/sitio/interna/interna.php?area=5&menu=576>. Access in: 26 July 2014. (1)
____________. Agenda China: ações positivas para as Relações Econômico-Comerciais Sino-Brasileiras - Parte IV - Barreiras tarifárias e não tarifárias. Available in:
<http://desenvolvimento.gov.br/agendachina/arquivos/agenda_China_Parte_IV.pdf>. Access in: 29
July 2014. (2)
____________. China se torna principal parceiro comercial do Brasil. April, 2009. Available in: <http://www.mdic.gov.br/sitio/interna/noticia.php?area=5¬icia=9041>.
MORTATTI, Caio Marcos; MIRANDA, Sílvia Helena Galvão de; BACCHI, Mirian Rumenos Piedade. Determinantes do comércio Brasil-China de commodities e produtos industriais: uma aplicação VECM. Econ. Apl., Ribeirão Preto , v. 15, n. 2, Jun. 2011.
OLIVEIRA, Henrique Altemani de. Brasil-China: trinta anos de uma parceria estratégica. Rev. Bras. Polít. Int., v. 47, n. 1, p. 7-30, 2004.
____________. Brasil e China: uma nova aliança não escrita? Rev. Bras. Polít. Int., v. 53, n. 2, p. 88-106, 2010.
THORSTENSEN, Vera et al. Os BRICS na OMC : políticas comerciais comparadas de Brasil, Rússia, Índia e África do Sul. Brasília: Ipea, 2012. 470 p.