Contaduría y Administración 63 (2), 2018, 1-25 Accounting & Management
International efficiency of biodiesel: An analysis for the
case of Costa Rica, Spain, the United States and Mexico
Eficiencia internacional del biodiesel: un análisis para el caso de Costa Rica,
España, Estados Unidos y México
Yéssica Yasmín Santos Equihua*, Irma Cristina Espitia Moreno
and Rodrigo Gómez Monge
Universidad Michoacana de San Nicolás de Hidalgo, Mexico
Received 9 february 2015; accepted 18 march 2016 Available online 19 march 2018
*Corresponding author.
E-mail address: [email protected] (Y.Y. Santos Equihua)
Peer review under the responsibility of Universidad Nacional Autónoma de México.
http://dx.doi.org/10.22201/fca.24488410e.2018.1068
0186- 1042/© 2018 Universidad Nacional Autónoma de México, Facultad de Contaduría y Administración. This is an open access article under the CC BY-NC-ND (http://creativecommons.org/licenses/by-nc-nd/4.0/) Abstract
JEL Classification: M11, M16, M21, Q01, Q42
Keywords: Biodiesel, Efficiency, Energy Sector, Sustainability.
Resumen
A nivel internacional existen factores que han llevado a la búsqueda de energías alternativas, dentro de las cuales se encuentran los biocombustibles. En este contexto, la presente investigación tiene como objetivo principal determinar el nivel de eficiencia técnica relativa de empresas productoras de biodiesel a base de aceites vegetalesy grasas animales (BAVyGA) de México, en relación a los presentados en Costa Rica, España y Estados Unidos (EE UU) incorporando variables de entrada y salida, haciendo además uso del modelo Data Envelopment Analysis (DEA) como herramienta de análisis económico cuantitativo. La evaluación se realizó a 30 empresas durante el año 2014 y el resultado, permite establecer decisiones en las áreas operativas para que las empresas mexicanas logren un mayor nivel de eficiencia. En los principales hallazgos se observa que existe una amplia variabilidad en cuanto al tamaño y operatividad de las empresas; y además que no se encuentran trabajando en escala óptima; por otra parte las empresas norteamericanas son en general consideradas con mayor nivel de eficiencia. Además, algunas empresas, fundamentalmente mexicanas y costarricenses mantienen excedentes en la capacidad de producción y en número de empleados, que pueden aprovecharse mejor dentro del proceso de producción si se compara con la forma de operación de empresas norteamericanas y españolas.
Códigos JEL: M11, M16, M21, Q01, Q42
Palabras clave: Biodiesel, Eficiencia, Sector Energético, Sustentabilidad.
Introduction
“The constant and marked fluctuations in the price of fossil fuels, the growing concern for the environment, and the responsibilities acquired by the governments at an international scale have led to the search for alternative fuel sources” (Montiel, 2010, pp. 57-58). “The transport sector is the largest energy consumer and with the highest growth rate worldwide. In the next 25 years, the use of gasoline and diesel will double” (Soimmakallio & Koponen, p.3404). In light of this, the use of biomass for energetic uses has drawn more interest. Presently, there are two types of liquid biofuels that could replace gasoline and diesel: bioethanol and biodiesel (Demirbas, 2011, p.18). For the production of biodiesel, the Latin American region has some advantages such as “soil, weather, labor costs” (Janssen & Damián, 2011, p. 5817). However, the procurement methods of these should be observed.
the performance of sectors and productive sub-sectors, such as the biodiesel subsector” (López, J., Henao, S. & Morales, M., 2007, p.). This analysis allows the study of each incorporated variable in order to establish proposals for the conditions in which the companies in Mexico should operate so that it can reach a high level of national and international efficiency.
This investigation comprises seven sections. In the first one, we present the context in which the biodiesel sector operates. In the second, we present the fundamental aspects of the investigation. In the third, we develop the theoretical framework where we go back to the theories of sustainable growth and the focus on efficiency. In the fourth we present the design. Subsequently we establish the results of the DEA analysis. In the penultimate we present our conclusions, and finally, the study proposal.
Contextualization of the subject of study
Current situation of the transport sector and alternative energy. According to the Secretaria de Energía (Secretariat of Energy) ([SENER], 2013), in its report “Prospectivas del sector eléctrico 2013- 2027 en México” (Prospective of the power sector 2013-2017 in Mexico), it is mentioned that the power sector is one of the essential sectors in any economy (p. 9). The CAP ([Consejería de Agricultura, Pesca y Desarrollo Rural], 2008) (Council of Agriculture, Fisheries and Rural Development), mentions that “power acquires a great economical relevance, as its availability conditions its economy; social due to the fact that its access conditions its level and quality of life, and; environmental any use of power presents an impact in human population, as well as in the vegetable and animal kingdom” (p. 17).
In the case of Mexico, the detailed information on the importance of power is presented below:
Figura1: Total Imports and Exports by Source 2001- 2006 (PJ) Source: Own elaboration of Este Pais, 2008.
The above information is relevant if you consider that Mexico consumes mainly secondary energy, and that this is fundamentally based on the consumption of petroleum. According to the figures presented in the Secretaría de Energía (Secretariat of Energy (2013)) and based on the figures of the Instituto Nacional de Geografía e Informática ([INEGI],2012) (National Institute of Statistics and GeoFiguray) “the energy destined for transformation is on the rise, mainly that of crude oil4, whereas the volume of extraction has decreased5, representing a great
technical and economical challenge. Between 2000 and 2004, the production of petroleum increased until reaching its maximum level, and started to decline. Regarding final products, Mexico has become a net importer. In addition, the same secretariat presented a consumption of 48.19% during 2010, with regard to the total consumption of power in the country (SENER, 2013, p.4). Which also shows at an internal level the importance of the transport sector and the need to generate a change with regard to the procurement, use, and regulation. Martinez (2012) shows in their investigation that, in Mexico, the contamination derived from the transport sector in certain zones, particularly of high demoFiguraic or industrial density, is grave (p. 4). “Additionally, Mexico faces high health costs” (SENER, 2013, p. 4).
Renewable energies, the energy reform and the institutional changes in Mexico. “It is projected that bioenergy and biofuels especially play an important role in the achievement of the long-term policy and the reduction of CO2 and in the contribution of the sustainability of the energy supply” (Bellarby, Wattenbach & Gill, 2010, p. 1935). In light of this possibility and opportunities, there are also certain concerns due to the fact that a great portion of the supply and current use of the energy is based on limited resources of fossil fuels, which is unsustainable” (International Atomic Energy Agency [IAEA], 2008, p. 1). Mexico has started establishing changes and strategies in order to strengthen its sector, La escuela de Graduados en Administración y de Dirección de Empresas ([EGADE], (2014), mentions that “since 2008, there are already mechanisms in Mexico that have helped develop the budding development of the industry” (p. 22). The idea of national energetic transition is not new, it is still developing but at a very slow pace and with problems and hesitation, this is how Dorantes presents it (2008). It is within this strategy that the Mexican Center of Innovation and Energy have been created, which seek to gather specialized human resources and thus help strengthen the investigation (EGADE, 2014, p.3). It also mentions that Mexico is at a key moment to both redefine its energy reform and to consolidate its measures (p. 7). The researcher from the Instituto Mexicano para la Competitividad (The Mexican Institute for Competition (IMCO)), Quiroz (2014), mentions that the “reform includes, among other matters, the adaptation of the legal framework for the environmental protection and the creation of an Agencia Nacional de Seguridad Industrial y de Protección al Medio Ambiente del Sector Hidrocarburos” (Agency for the National Industrial Safety and Protection of the Environment in the Sector of Hydrocarbons) (p. 52).
According to the data presented by Aguirre, Gallegos & Pérez (2015), on the extensive evaluation of 200 entrepreneurs, as well as workshops with academy experts, financial institutions and the private sector, it was determined that the sector of clean energy is at its initial stage, even more so if we compare it with that of countries from the OECD, as is shown in the following table:
Table1
Evaluation of the Clean Energy in Mexico
INOVATION LEVEL TRADING SCORE
Investment in I& D Low Investment in the scalability stage Inexistente
Patenting Cleantech Average Outflows successful and recovery investments Low
Human resources Average Level of the conglomerates Inexistente
competitive advantages use Low Levels of internationalization Low
Types of biomass and generation of biofuels. “Biomass is the fourth source of energy in the world6, 78% of renewable energy in 2005” (Demiral et al., 2011. p. 1). At the time of selecting the raw matter with which the biofuel is going to be elaborated, it is important to take into consideration the provisions of Groom, Gray & Townsend (2008) and those of Annie (2006) to evaluate the practices of the use of the land where the raw materials will be cultivated and handled.
Growth, development and expectations of biofuels. Furtado (2009) mentions that “the international maker of biofuels is even more reduced and it is mainly destined for the internal market” (p. 7). “The production of bioethanol is even greater than that of biodiesel (94%), as well as its international commerce. However, biodiesel has grown at rather superior rates” (Carriquiry et al., 2011, p. 4222). According to the report “Perspectivas Agrícolas 2010-2019” (Agricultural Perspectives) presented by the OECD-FAO (2010), it is projected that the markets of biofuel will be heavily influenced by the mandates and consumption incentives of the countries throughout the world; USA and the EU, respectively, will participate in a meaningful way (p. 102). “In Latin America the largest producer of biofuel will continue to be Argentina, which will represent around 25% of the total biodiesel that is produced in the developing nations and 8% of the world production of biodiesel for 2020” (OECD, 2011, p. 98). According to the OECD (2011), in 2020 more than 75% of the global production of biodiesel will be from vegetable oil, and the one produced from fat, sebum, and waste oils will represent around 15% of the total biodiesel (p.100).
Amount of waste and collection companies in Mexico. Presently, the residue of annual domestic oil is of approximately 6 liters per capita, even though in certain zones it can be of 12 liters. According to the figures presented in Moreno, Vidal, Morgan, Espinosa, & Roblero (2012) and obtained from the database of the INEGI (2013) and the Procuraduría Federal del
Consumidor ([PROFECO]) (Office of the Federal Prosecutor for the Consumer) the following
is presented:
In Mexico, the per capita consumption is of 2 spoons (ANIAME, 2008). “In this consumption, food absorbs from 15 to 35% and the rest is discarded”. (PROFECO, 2013). Regarding the number of existing population, for the annual population and housing census of 2010, a population of 112,336,538 was recorded, which is equivalent to an average of 674,019,228 liters per month. The commercial food establishments also present a great potential for the supply of AVU. At a national level, the INEGI reported that one out of ten establishments sells food, with 353,210 counted establishments (Moreno Vidal, Morgan, Espinosa, & Roblero, 2012, p.896).
According to the data presented by Gasca (2015), Bioenergetics director of the SENER, at the Foro internacional 2015 de Valorización Energética de Residuos Urbanos, (2015 International Forum of Energetic Assessment of Urban residues), it has been confirmed that Mexico allocates around 88% of the organic residues to dumpsters and landfills, while less than 5% is used in composts or bio-digestion, and less than 2% in thermal uses, allocating the rest to recycling.
There are different problems created around the production of biofuels from waste, some of the most important are: The Costs of biofuels, which is the largest sector in production and goes from 37 to 70% (Coyle, 2007). Authors such as Timilsina & Arshish (2010) handle costs
that are high and varied, as is the case for cooking oil, which goes from $0.21-0.42 per liter (p. 14); The sources and access to statistical information: where the lack of information regarding the commerce of biofuels has promoted the development of investigations” (Heinimo, 2008, p.702). Van Dam & Faaij (2011) mention that “according to the estimations carried out, there is a lack of necessary components and data for the accounting of biofuel at this level”. The difficulty to determine the exact volumes is created because raw materials are commercialized for material purposes, but they are used in the production of energy (Hertel & Beckman, 2011) and because the majority of the companies are new (Heinimo, 2008); The commercial barriers: as there is no comprehensive commercial regime that applies to biofuels, and that the two more relevant biofuels do not compete at the same level within the World Trade Organization (WTO)”7 (Aristegui, 2009, p. 124). Duffey (2006) & Furtado (2009) state that biofuels such as biodiesel are classified as industrial products and are subject to the general rules of commerce under the WTO8. Bioethanol and energy crops, on the other hand, are covered by the Agreement on Agriculture of the WTO9, and finally; The societal degree of acceptance: where the support widely varies according to the technology and the crop10 (Delshad et al., 2011).
Characterization of the investigation
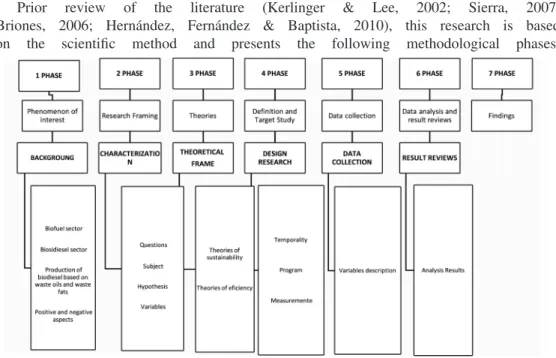
Prior review of the literature (Kerlinger & Lee, 2002; Sierra, 2007; Briones, 2006; Hernández, Fernández & Baptista, 2010), this research is based on the scientific method and presents the following methodological phases:
Figure 2: Phases of Research Methodology Source: Own elaboration, 2016
The research problem is presented as follows: Through the determination of the relative efficiency levels, we can establish a better performance in the decision-making of the operative
7 While ethanol finds its action framework fundamentally low under the Agreement on Agriculture, biodiesel is subject to the Agreement on Subventions and Compensatory Measures
8 Fall within chapter 38.
9 This is part of chapter 22 of the Harmonized System of the WCO.
areas of greater importance in the energetic subsector BAVyGA in Mexico, and with it, improve marketability both in national and international markets.
Once the approach of the problem has been described the investigation question is posed: What is the level of relative technical efficiency of Mexican BAVyGA producer companies in relation to the ones presented in Costa Rica, Spain and the United States, when incorporating input and output variables, using the DEA model, which allows for a better orientation in the decision-making of the areas of greater important and with this, improve marketability in both national and international markets?
The Research objective entails the following: To determine the level of relative technical efficiency of BAVyGA producer companies in Mexico, in relation to those of Costa Rica, Spain and the United States, incorporating input and output variables, making use of the DEA model to improve the decision-making of the operative areas of greater importance and with this, improve marketability in both national and international markets.
The Research hypothesis is presented as the following: The level of relative technical efficiency of the BAVyGAD producer companies in Mexico when using the input and output variables, making use of the DEA model, is inferior to the one found for the companies of Spain and the United States and similar to those of Costa Rica.
Specification of the variables used. The variables taken into consideration: Input variables: Employees: which are the people necessary for the production process, and; Production capacity: which is the maximum capacity of production of the plant; Output variables: Liters of biodiesel: which comprise the amount produced in the previous year. For the approximation of the measuring unit (liters and tons), a necessary condition, it was taken into consideration that the density of the diesel was of 0.88 g/cm3.
Theoretical framework
on Environment and Development (WCED), in the Brundtland report, which mentions that “development is not sustained if the base of environmental resources is deteriorated” “Thus, from the participation of the WCED, it is suggested that sustainability can be guaranteed through the accumulation of physical capital that helps compensate the reduction of material” (Comisión Económica para América Latina [CEPAL], 2003, p.89). Since 1990 and for the last two decades, the social movements and the production of knowledge coalesced in the diagnosis that says that the theories and the public and private policies for the promotion of development have turned out to be insufficient for the resolution of the sustainable development problems (Gutiérrez, 2007, p.56). At the end of the last century, and in the framework of the project on “Energy and Sustainable Development in Latin America and the Caribbean”, it is proposed that the human being should be the active subject and the objective of the development. The CEPAL (203) “mentions that the adopted concept of human being is what is frequently mentioned in the reports of the United Nations Development Programme (UNDP) and it is conceived as the process to broaden the range of choice of the people” (p.27). The WCED stated that it is necessary to “emphasize the distributive aspects when classifying as sustainable a development that distributes more equitably the benefits of economic progress, protects the national and global environment for the benefit of future generations” (Pistonesi, Nadal, Bravo, & Bouille, 2008, p. 43). “As a response to the decisions made by the Commission on Sustainable Development (CSD) of the United Nations and to the request made in Chapter 40 of Program 21, in 1995 the United Nations Department of Economic and Social Affairs (UNDESA) began working to define a set of indicators of sustainable development. At the beginning, the indicators would cover the four main dimensions: social, economic, environmental and institutional” (IAEA, 2008, p. 5). These four dimensions are strongly linked and interact with each other. In the economic dimension, sustainability is linked with the possibility of sustaining growth; In the social dimension it is important to take care of the quality of life of the population. In the environmental dimension it covers a broad range of elements (Pistonesi, pp. 43-44). And in the political dimension, it is linked with the governability that pertains to the rights of men (Organización Lationoamericana de Energía [OLADE] & CEPAL, 2003, pp. 31-32). “The dimensions must include indicators to evaluate its progress” (Pistonesi et al., 2008, p. 48).
to obtain the largest amount of product without reducing the production of another product” (Arzubi & Berbel, 2002). In order to descriptively explain this perspective of efficiency, we generally use a Figuraic instrument called the Edgeworth box, which helps analyze the exchange of two goods between two people, Figuraically displaying the preferences of the two through indifference curves. “This problem was brought up again by Debreu, who proposed a radial measure called Coefficient of resource utilization, being a ratio with input orientation that establishes the maximum possible equiproportional reduction in all inputs” (Gómez, 2012, p.32). “This ratio quantifies the proportion between the situations obtained in an economy that is moving away from the optimal status” (Romeu & Rodríguez, 2008). “After Kopmans and Debreau, another relevant work was created, which suggested the estimation of technical efficiency in terms of real deviation from the idealized production boundary. The works of these authors were continued by Farell in 1957, who created the conceptual bases that have been the ground of the subsequent methods to measure efficiency” (Galacho, 2010).
Quantification of efficiency. “Methodologically, in order to obtain a measure of efficiency, it is necessary to know the production function or the set of production data that was applied, as well as the efficient boundary” (Guzman, 2005, p. 5). The quantitative estimate that is shown since the work of Farrel, refers the use of convex conical or polygonal shapes to build the isoquants or boundaries in a non-parametric shape, and only on the basis of the information available regarding the behavior of several comparable decision making units (DMUs), many of which, will be more efficient than others (Schuschny, 2007, p.45). Its two great contributions are based on the division of efficiency into two components: The technical efficiency, which alludes to the ability to obtain the maximum level of production given the smaller combination of inputs, under the assumption of constant returns to scale (CRS) (Arzubi & Berbel, 2002). This could be measured in terms of physical relations between observable outputs and the maximum attainable output (Herrera & Francke, 2007, p.5). And the second contribution is that of Allocative efficiency, which involves achieving the minimum cost of production of a certain quantity of production by changing the proportional relations of the inputs used based on their prices and marginal productivities (Romeu & Rodríguez, 2008, p. 6). Both measures show the economic efficiency (Arzubi & Berbel, 2002, p. 106). With these two possibilities, two ways to estimate the reference boundary were developed: These two groups are those that consider a boundary type function and those that consider the non-boundary type.
does not mean that the entity has obtained its maximum efficiency, but it does indicate that the remaining units can improve their performance (Fernández & Flores, 2005).
Mathematical development of the DEA, BBC, and CCR model. “The Constant Returns
to Scale (CRS) model was made known in 1978 with the publication made by Charner, Cooper and Rhodes, reason for which it is known as the CCR model, based on the doctoral thesis presented by Rhodes, which was subsequently expanded on by Banker, Charnes and Cooper in 1994, i.e., the Variable Returns to Scale (VRS) (BCC model)” (Gómez & Pascual, 2010). “Both in the CRS as well as the VRS versions, the efficiency can be characterized in relation to two basic orientations: The oriented output models, which seek the maximum proportional increase of the outputs while remaining within the limit of production possibilities; The oriented input models, which seek the maximum proportional decrease in the inputs while remaining within the limit” (Gómez, 2012, p. 70).
Constant Returns to Scale (CRS) model. Among the hypothesis of this first analysis is convexity, the production technology with CRS, and the orientation towards the maximization of the use of the productive resources (Schuschny, 2007). Hereunder we develop the model according to Herra & Francke (2007) & Sanueza (2003).
Output orientation: The mathematical representation of the accorded model assumes a sample of Decision Making Units (DMUs) such that each DMUj (j=1,2,3...n) produce s outputs Yrj (r=1,2,3...s) using m inputs Xij (i=1,2,3...m). The DEA-CRS output oriented model expressed in a fractional form is formulated through the following equations:
The linear program selects the weights that minimize the virtual input of the assessed unit (Vi Xi0) conditioned so that its virtual output (ur yro) is equal to the unit, so that the implementation of said weights to the rest of the decision-making units being assessed does not allow their virtual output to exceed the virtual input. The unit shall be efficient if its virtual input is the unit. In practice, calculating the efficiency indexes is simpler if the dual form of the aforementioned model is used, through which a linear approximation is built in sections to the true limit. The dual formulation is the following:
In this case, =1 if the assessed unit is considered efficient, as there is no other that produces
more or that achieves the same level of production with less resources than it. With this DEA analysis it is also possible to detect likely decreases in the inputs or increases in the outputs can also be detected through the incorporation to the dual model of the so called slack variables. Therefore, it is possible that it does not meet the Pareto-Koopmans efficiency condition, which is more restrictive than that of Farrel, according to which an entity is efficient if and only if *=1 and all the slacks are zero, otherwise the entity is evaluated as inefficient. Concretely speaking, for the inputs these slacks represent the additional quantity that each producer could save in the use of the same inputs in the case of being efficient, whereas for the outputs it is identified by how much the production could increase if it were to reach an efficient behavior. These slack variables can be included with the following expressions:
Where s ī represents the input excess i and S + r, the lack of the r output. Therefore, the dual
model (of output maximization) is the following expression:
Where is the efficiency index, λi are the weights and s ī and S + r are the slack variables
Yo) on the efficient limit that represents an efficient unit (real or virtual), which, in an output
oriented model, shall produce, at least, the φ proportion of the outputs of the assessed unit and shall consume, at most, the same quantity of inputs. The referred projection point shall be given by X 0 = Σn
j=1λ*j Xj; Yo= Σnj=1λj Xj, i.e., the efficient quantity resulting from the projection
is obtained as a linear combination of the observed points, that is, of other entities, which is said constitute the benchmark of the entity evaluated and qualified as inefficient. Knowing the coordinates of the inefficient entity’s projection on the limit, it is possible to determine two important results: its target values (input and output) and the potential improvement that ought to be promoted. The target values are the input and output levels that, in case of reaching them, would transform an inefficient entity into an efficient one. The potential improvement, in absolute or relative terms, is obtained when comparing the values observed for the evaluated entity with its target values, and allows establishing the amount of the input decrease and/ or output increase that this should promote in order to become efficient. In turn, the potential improvement of an entity can be deconstructed into proportional improvement (radial reduction) and slack improvement (slack reduction). Determining the benchmark and the target values of an inefficient entity, it is also interesting to be able to know to what degree each of the benchmark units contribute to the aforementioned values. This information expresses the most or least importance that, in each input and output variable, the benchmark represents for the inefficient entity. The potential improvement, in absolute or relative terms, is obtained when comparing the observed values for the evaluated entity with its target values, and allows establishing the amount of the input decrease and/or output increase that it should promote in order to become efficient. Determining the benchmark and the target values of an inefficient entity also results rather interesting in order to know in what measure each of the benchmark units contribute to these. The contribution percentage of the efficient entity k to the objective values of the r output of an inefficient unit (PCk, r) will be given by:
So that the contribution percentage of the efficient entity k to the target values of input i of an inefficient entity (PCk, i) will be:
Variable Returns to Scale (VRS) model
Assumes the productive process of the company under the long-term time horizon.
In this last model the optimal, μ, indicates the possibilities of returns to scale in which the unit finds itself. “μ≤ 0 suggests that the evaluated unit is operating with growing returns to scale; μ≥ 0 suggests that the unit is under decreasing returns and, finally, μ = 0 indicates that it is operating under CRS” (Sanhueza, 2003, p. 89).
Investigation design
Time, spatial and sectoral delimitation of the sample. This study analyzes the situation of 30 manufacturing companies of biodiesel derived from vegetable oils and waste animal fats in 2014, of 4 countries: Costa Rica, United States of America, Spain, and Mexico. Same that showed availability to provide data through our survey or own databases and/or of associations. Which are shown in the following table.
Table 2
Manufacturing companies of BAVGA
Costa Rica
Cooperativa Agrícola Industrial Victoria Energías Biodegradables
Mexico
Combustibles Biológicos de México Moreco Renovables Maya
Verde
Spain
Biodiesel Castilla‐La Mancha Bio Bionet Europa, S.A. Bionor
Transformación, S.A.
Bionorte
Grupo Ecológico Natural, S.L. Stocks Del Valles, S.A. Ecofuel Energética
Española
United States
Baker Commodities Los Angeles Bay Biodiesel, LLC (San Jose) Biodiesel Industries of Ventura, LLC
BioDiesel One Ltd
Bridgeport Biodiesel, LLC CGF Clayton LLC Community Fuels Crimson
Renewable Energy, LP
Delta American Fuel, LLC FL Biofuels, LLC Genuine Bio-Fuel GeoGreen
Biofuels, Inc.
Healy Biodiesel Imperial Western Products Iowa Renewable
Energy, LLC Middle Georgia Biofuel
New Leaf Biofuel, LLC
Model specifications. To identify the assumptions on which the proposed model is based, what was proposed by Romeu & Rodríguez (2008) is established and summarized: Measurement of technical efficiency: DEA Analysis, given the ease of use of the variables and results; Orientation of the efficiency measurement: Output, since the production levels are low, it is intended to maximize the product; Typology of returns to scale: Growing and Variable, based on first determining if the companies are operating at optimal scale.
Data collection
Notation of the Variables and DMUS: There were a total of 20 DMUs used, which acquire the following notation:
Table 3
Notation of the DMUs used
Costa Rica
1.-Cooperativa Agrícola Industrial Victoria 2.-Energías Biodegradables
Coopavi Enerbio
Mexico
3.- Combustibles Biológicos de México 4.- Moreco
5.- Renovables Maya Verde
Combiomex Moreco Remave
Spain
6. - Biodiesel Castilla‐La Mancha 7.- Bio Bionet Europa, S.A 8.- Bionor Transformación, S.A. 9.- Bionorte
10.-Grupo Ecológico Natural, S.L. 11.-Stocks Del Valles, S.A. 12.-Ecofuel 13.-Bioenergética Española Biocama Biobionet Bionor Bionorte Grenatura Stockva Ecofuel Bioenergética
The United States
14.-Baker Commodities Los Angeles 15.-Bay Biodiesel, LLC (San Jose) 16.-Biodiesel Industries of Ventura, LLC 17.-BioDiesel One Ltd Bridgeport Biodiesel, LLC 18.-Bridgeport Biodiesel LLC
19.-CGF Clayton LLC Community Fuels 20.-Community Fuels
21.-Crimson Renewable Energy, LP
22.-Delta American Fuel, LLC FL Biofuels, LLC 23.-Fl Biofuels LLC
24.-Genuine Bio-Fuel 25.-GeoGreen Biofuels, Inc. 26.-Healy Biodiesel
27.-Imperial Western Products 28.-Iowa Renewable Energy, LLC 29.-Middle Georgia Biofuel 30.-New Leaf Biofuel, LLC
Backmoan Baybio Bioventura Bioneltd Bridgeport Cfgclayton Communityfuel Crimsonrenew Deltamerican Flbiofuellc Genuinebiofuel Geogreen Healybio Imperialwest Iowarenewa Middlegeorg Newleaf
The notation for the output variable and the two input variables are:
Table 4
Notation for the variables
Variable Indicator Notación
Input Production Level Nivelprod
Output Employees
Production Capacity
Empleado Capacidprod
Source: Own elaboration 2016
Analysis of the results
Descriptive statistics. There is a minimum of three employees for Biodiesel Industries of Ventura, LLC. Whereas the maximum level of employees is held by Imperial Western Products, both based in California. The annual production capability oscillates broadly, from the 400 tons a year in the Mexican company Renovables Maya Verde, up to the 416,000 tons in the case of CGF Clayton LLC, situated in Delaware. For the case of the annual production this goes from 60 tons in the case of Combustibles Biológicos de México, up to the 350,000 tons with Delta American Fuel, LLC.
Table 5
Descriptive statistics
Nombre Minimum Maximum Average Standard Deviation
Empleado 3 50 15.666 45.964
Inve&Des 0 4 0.933 0.891
Capacidproduc 400 416000 82874.9333 117528.2264
Nivelproduc 60 350000 53, 600.2 85482.1278
Preciobiodie 1.05 1.22 1.093 0.066
Gamaproduct 1 3 1.666 0.649
Pobmun 476 10017068 956088.4 2017285.752
Destino 0 1 0.766 0.423
Formcomerc 0 1 0.166 0.372
Preciodies 0.961 1.64 1.152 0.294
Impuestodie 0.009 0.413 0.222 0.128
Progra&apoyo 0 1 0.133 0.339
Source: Own elaboration from the Data Envelopment Analysis Online, 2014.
However, for the company Bioenergetica the difference is of 9%, in Moreco of 36%, and in the case of the company Remave it is of 63%. Furthermore, it can be generally observed for both cases that the North American companies are leaders in levels of efficiency. Hereunder, the results of the analysis of efficiency to scale are shown (ETG/ETP).
Table 6
Measuring efficiency scale
DMU ETG ETP EE
1 Imperialwest (EU) 100% 100% 100.0%
2 Middlegeorg (EU) 100% 100% 100.0%
3 Communityfuel (EU) 99.5% 100% 99.2%
4 Crimsonrenew (EU) 99% 100% 99.2%
5 Iowarenewa (EU) 96% 96% 100.0%
6 Deltamerican (EU) 93% 94% 98.9%
7 Healybio (EU) 92% 97% 94.8%
8 Bioneltd (EU) 92% 95% 96.8%
9 Geogreen (EU) 92% 99% 92.9%
10 Backcoman (EU) 91% 92% 98.9%
11 Bionorte (Es) 91% 97% 93.8%
12 BayBio (EU) 90% 91% 98.9%
13 Flbiofuellc (EU) 88% 91% 96.7%
14 Genuinebiofuel (EU) 86% 88% 97.7%
15 Bionor (Es) 86% 89% 96.6%
16 Bridgeport (EU) 80% 83% 96.4%
17 Bioventura (Es) 80% 100% 80.0%
18 Newleaf (Es) 80% 81% 98.8%
19 Grenatura (Es) 76% 76% 100.0%
20 Biobionet (Es) 76% 77% 98.7%
21 Stockva (Es) 66% 69% 95.7%
22 Moreco (Méx) 57% 93% 61.3%
23 Biocama (Es) 50% 51% 98.0%
24 Cfgclayton (EU) 48% 100% 48.0%
25 Enerbio (CR) 40% 42% 95.2%
26 Remave (Mex) 33% 100% 33.0%
27 Coopavi (Es) 33% 37% 89.2%
28 Ecofuel (Es) 25% 25% 100.0%
29 Bionergetica (Es) 13% 22% 59.1%
30 Cambiomex (Mex) 3% 4% 75.0%
A value below 100% for the majority of countries means that the majority of countries has not been able to reach the maximum level of efficiency (in comparative terms) as it is not operating in the most productive scale it otherwise could. Only the companies Middle Georgia and Imperial Western of the USA have reached a 100% efficiency level with economies of scale. Given the aforementioned results, we proceeded to evaluate each of the previously established variables for the DEA model, using the VRS model. Thus, among the results of the analysis of efficiency incorporating only variables of scale, a Mexican company be found “Renovables Maya Verde”. The American companies “Biodiesel Industries of Ventura LLC, Community Fuels, Crimson Renewable Energy, LP, Imperial Western Products, CGF Clayton LLC, Iowa Renewable Energy, LLC, and Middle Georgia Biofuel”. The first four being from the State of California, whereas the last three are from Delaware, Iowa and Georgia, respectively. There are also companies shown with a high level of efficiency, with levels close to the unit. In the case of the American companies, it is shown that all the remaining ones are close to the level of efficiency. In the case of Mexico, the company “Moreco” from the state of Michoacán also has a high level of efficiency. And in the case of Spain the companies “Bionor Transformación” and “Bionorte” of Álava and Asturias, respectively, are companies with a high level of efficiency. The companies with low levels of efficiency are: Cooperative Agrícola Industrial Victoria, from Alejuela Costa Rica; Cambiomex, Mexican company situated in Villa Hermosa Tabasco; Bioenergética Española a company established in Zaragoza, and Ecofuel also from Spain. The main Slacks showed the underutilization of the input variables that allow obtaining higher levels of production. The main ones were: Cooperative Agrícola Industrial Victoria from Ajuela, with an excess of more than four employees. Whereas Stocks Del Valles, S.A. had an excess of 36 employees. In the Spanish company “Bioenergética Española), there is an excess or waste in the productive capability of 22,800 annual tons.
Tabla 7 Slacks
DMU Eempleado Capacidprod Nivelprod
Coopavi 4.12 0 0
Enerbio 2.675 0 0
Moreco 1.783 0 0
Bionergetica 0 22800 0
Stockva 36.373 0 0
Baybio 0.627 0 0
Iowarenew 11.59 0 0
Source: Own elaboration from the Data Envelopment Analysis Online, 2014.
Table 8
Posibility to increase
DMU Empleado Capacidadproduc Nivelproduc
Coopavi 10 to 5.88 3000 to 3000 1000 to 2726.715
Enerbio 10 to 7.325 5000 to 5000 2000 to 4724.187
Combiomex 4 to 4 2000 to 2000 60 to 1711.201
Moreco 6 to 4.217 700 to 700 400 to 429.621
Remave 4 to 4 400 to 400 130 to 130
Biocama 8 to 8 50000 to 50000 25000 to 49205.264
Biobionet 50 to 50 73860 to 73860 56180 to 73394.139
Bionor 6 to 6 35000 to 35000 30000 to 34352.491
Bionergetica 8 to 8 250000 to 227200 30000 to 224000
Bionorte 5 to 5 5000 to 5000 4550 to 4690.459
Ecofuel 48 to 48 300000 to 300000 75000 to 296419.333
Grenatura 8 to 8 39700 to 39700 30000 to 39026.28
Stockva 45 to 8.627 6800 to 6800 4500 to 6521.913
Backcoman 80 to 80 120000 to 120000 110000 to 119427.18
Baybio 18 to 17.373 18900 to 18900 17000 to 18606.624
Bioventura 3 to 3 37900 to 37900 30200 to 30200
Bioneltd 5 to 5 11400 to 11400 10500 to 11015.265
Bridgeport 6 to 6 10000 to 10000 800 to 9646.218
Cfgclayton 3 to 3 416000 to 416000 40000 to 40000
Community 49 to 49 75500 to 75500 75000 to 75000.365
Crimsonrenew 20 to 20 113600 to 113600 112200 to 112232.08
Deltamerican 44 to 44 378500 to 378500 350000 to 373697.21
Flbiofuellc 4 to 4 17000 to 17000 15000 to 16534.965
Genuinebiofuel 8 to 8 34800 to 34800 30000 to 34183.85
Geogreen 6 to 6 3800 to 3800 3500 to 3519.063
Healybio 4 to 4 7600 to 7600 7000 to 7245.406
Imperialwestern 250 to 250 340700 to 340700 340000 to 340000
Iowarenewa 44 to 32.41 39700 to 39700 38000 to 39380.341
Middlegeorg 4 to 4 113600 to 113600 112000 to 112000
Newleaf 5 to 5 18900 to 18900 15000 to 18427.146
Source: Own elaboration from the Data Envelopment Analysis Online, 2014.
Bioenergética Española also has the capability of increasing its production by a little over seven times what it currently produces. Finally, Biodiesel Castilla-La Mancha could do so by 96.8%. On the other hand, there are companies that are operating at their maximum production level such as Renovables Maya Verde, Biodiesel Industries of Ventura, LLC, CGF Clayton LLC, Imperial Western Products, and Middle Georgia Biofuel. Whereas some of them have the possibility of increasing their production in a level below 10%, as is the case of Moreco, Bionor Transformación, S.A., Bay Biodiesel, LLC, Community Fuels, Iowa Renewable Energy, LLC, Healy Biodiesel, and Delta American Fuel, LLC. The companies that can increase production in a medium level are Stocks Del Valles, S.A., by 44.9%, Grupo Ecológico Natural, S.L., by 30%, Bridgeport Biodiesel, LLC, can do so by 20.6%, and New Leaf Biofuel, LLC, by 22.84%. The Lambdas allowed for the identification of the degree of benchmarking that must be carried out for each of the companies. The company Renovables Maya Verde of Mexico, Imperial Western Products that has a plant in California and Arizona, and Middle Georgia Biofuel of Georgia are the companies that are best catalogued as companies that can be picked up once more in order to elevate the level of efficiency.
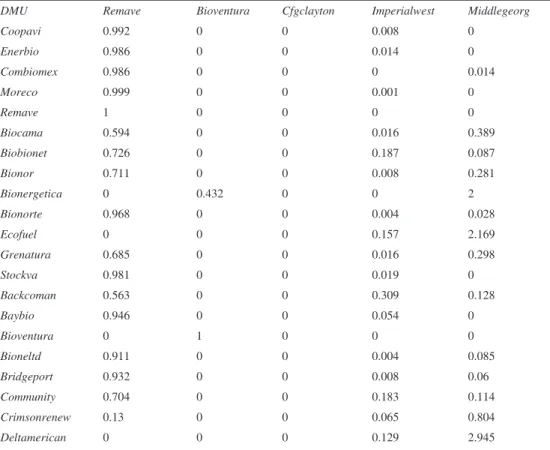
Efficient companies. The following table shows the results that allowed identifying what each company must do.
Table 9 Benchmarking
DMU Remave Bioventura Cfgclayton Imperialwest Middlegeorg
Coopavi 0.992 0 0 0.008 0
Enerbio 0.986 0 0 0.014 0
Combiomex 0.986 0 0 0 0.014
Moreco 0.999 0 0 0.001 0
Remave 1 0 0 0 0
Biocama 0.594 0 0 0.016 0.389
Biobionet 0.726 0 0 0.187 0.087
Bionor 0.711 0 0 0.008 0.281
Bionergetica 0 0.432 0 0 2
Bionorte 0.968 0 0 0.004 0.028
Ecofuel 0 0 0 0.157 2.169
Grenatura 0.685 0 0 0.016 0.298
Stockva 0.981 0 0 0.019 0
Backcoman 0.563 0 0 0.309 0.128
Baybio 0.946 0 0 0.054 0
Bioventura 0 1 0 0 0
Bioneltd 0.911 0 0 0.004 0.085
Bridgeport 0.932 0 0 0.008 0.06
Community 0.704 0 0 0.183 0.114
Crimsonrenew 0.13 0 0 0.065 0.804
Flbiofuellc 0.853 0 0 0 0.147
Genuinebio 0.729 0 0 0.016 0.255
Geogreen 0.986 0 0 0.008 0.006
Healybio 0.936 0 0 0 0.064
Imperialwest 0 0 0 1 0
Iowarenewa 0.885 0 0 0.115 0
Middlegeorg 0 0 0 0 1
Source: Own elaboration from the Data Envelopment Analysis Online, 2014.
The company Renovables Maya Verde of Mexico, Imperial Wester Products with a plant in California and Arizona, and Middle Georgia Biofuel of Georgia are the companies classified as the most efficient and could be taken as a reference model.
Conclusions
is one of the American companies of greatest growth, located in California. This company has managed to benefit from its strategic location in order to produce and commercialize the product, in addition to taking advantage of the support that has been established at both the State and Federal levels.
On the other hand, Renovables Maya Verde, a small-sized Mexican company, has managed to take advantage of its strategic location for the gathering of used vegetable oils and waste animal fats from the area of the Riviera Maya, Tulum and Cancun, given the broad quantity of residues that are produced daily in the hotels and restaurants of the region. Given these finds, it is established that the working hypothesis that affirms that the efficiency level in the production of the manufacturing companies of BAVyGAD in Mexico is below what is found in the companies of Spain and the USA, and similar to those of Costar Rica, when utilizing the input and output variables and making use of the DEA model, which is not valid for all the Mexican companies, as there is a company that, though small, was found to be producing efficiently due to its good utilization and location. Given these results, the possibility is posed that small and medium size companies in Mexico can make use more broadly and in a better form the residues of animal fats and vegetable oils, through a better utilization of their advantages due to location, population and resources, as well as from the implementation of strategies that allow support, link and impulse the gathering, processing and innovation of the proposed bio-combustible, with the help of the governmental sector; just as it has been shown for the North American companies, as well as the Mexican one. The fact of being a recently incorporated subject generates an issue, since the large part of support, projects and existing investigations are fundamentally oriented towards the production of ethanol or, as the case may be, biodiesel based on agricultural matter.
Proposal and recommendations
References
Acaroglu, M.& Aydogan, H. (2011, Noviembre 8). Biofuels Energy Sources and Future of Biofuels Energy in Turkey.
Biomass and Bioenergy, 36, 69 – 76. http://dx.doi.org/10.1016/j.renene.2017.02.008
Aguirre, L.,Gallegos, T., Pinzon, J. (2015). Cleantech México 2015. Panorama y recomendaciones para impulsar la
Ecoinovación Nacional: Enlace Emprendedores Ecoinovación.
Annie, D. (2006, Septiembre 2). Producción y Comercio de Biocombustibles y Desarrollo Sustentable: Los Grandes Temas. Londres, Inglaterra: Instituto Internacional para el Medio Ambiente y Desarrollo. Recuperado de http:// www.iied-al.org.AOP (2007, Noviembre). Eficiencia Seguridad y Sostenibilidad: Requerimientos para la
intro-ducción de los biocarburantes. España: Asociación Española de Operadores de Productos Petroliferos.
Aristegui, J. (2009, Julio). Los biocombustibles desde la Perspectiva del Comercio Internacional y del Derecho de la Organización Mundial del Comercio. Revista de Derecho, 22(1), 113-134.
Arzubi, A., & Berbel, J. (2002). Determinación de los índices de Eficiencia DEA en las Exportaciones Lecheras en Buenos Aires. Economía Sociológica y Políticas Agrarias. Escuela Tecnológica Superior de Ingenieros Agrono-mos y Montes, 17(2), 103- 123.
Bellarby, J., Wattenbach, M., & Gill, T. (2010, Julio 23). The Potential Distribution of Bioenergy Crops in the UK Under the Present and the Future Climate. Biomass and Energy, 1935-1945, doi: 10.1016/j.biombioe.2010.08.009. Briones, G. (2006). Métodos y técnicas de Investigación para las Ciencias Sociales (4a ed.). México, D.F., México:
Trillas.
CAP (2008). Situación del Sector Biocarburantes en Andalucía: Perspectvas y Desarrollo. Andalucía, España: Junta de Andalucía, Consejería para la Agricultura y la Pesca. ISBN: SE-645-08.
Carriquiry, M., Xiaodong, D., & Timilsina, G. (2011, Mayo 6). Second Generation Biofuels: Economics and Policies.
Energy Policy, 39, 4222-4234. https://doi.org/10.1016/j.enpol.2011.04.036
Case, K. E., & Fair, R. C. (2001). Principios de Microeconomía (4a ed.). Mexico, D.F.: Prentice Hall.
CEPAL. (2003). Energía y Desarrollo Sustentable en America Latina y el Caribe: Guía para la Formulación de
Polí-ticas EnergéPolí-ticas (Primera ed.). Santiago de Chile: CEPAL.
CNE. (2012, Marzo 8). Análisis comparativo de los sistemas nacionales de sostenibilidad de los biocombustibles
y bioliquidos en la UE. España: Comisión Nacional de Energía. Recuperado de http://energia.cnmc.es/cne/doc/
publicaciones/cne08_12.pdf
CMMAD (1987). Informe de la Comisión Mundial sobre el Medio Ambiente y el Desarrollo: Nuestro Futuro Común.
1987. España: Alianza Editorial, 21 -45.
Coyle, W. (2007). The Future of Biofuel: A Global Perspective. Feature. USDA, 5(5), 24-29.
Delshad, A., Raymond, L., Sawicki, V., & Wegener, D. (2011, Marzo 11). Public Attitudes Toward Political and Tech-nological Options for Biofuels. Energy Policy, 38, 3414–3425. http://dx.doi.org/ 10.1016/j.enpol.2010.02.015. Demiral, I., Eryaz, A., & Sensoz, S. (2011, Noviembre 17). Bio-oil Production from Pyrolysis of Corncob (Zea mays
L.). Biomass and Bioenergy, 36, 43 - 49. doi: 10.1016/j.biombioe.2011.10.045
Demirbas, A. (2011, Agosto 17). Competitive Liquid Biofuels From Biomass. Applied Energy, 88, 17-28. http://dx.doi. org/10.1016/j.apenergy.2010.07.01.
Dorantes, J. (2008, Septiembre). Las Energías Renovables y la Seguridad Energética Nacional. México, D.F.: AI México. Recuperado de: http://www.ai.org.mx/ai/archivos/coloquios/5/Las%20Energias%20Renovables%20 y%20la%20Seguridad%20Energetica%20Nacional.pdf
Duffey, A. (2006, Septiembre). Producción y comercio de biocombustibles y desarrollo sustentable: los grandes
te-mas, Instituto Internacional para el Medio Ambiente y Desarrollo. Londres: El Instituto Internacional para el
Medio Ambiente y Desarrollo. Recuperado de http://pubs.iied.org/pdfs/15504SIIED.pdf
FAO, O. (s.f.). Perspectivas Agricolas 2011-2020. Obtenido de http://dx.doi.org/10.1787/agr_outlook-2011-es FAO, O. (2010). Perspectivas Agricolas 2011-2020. Obtenido de http://dx.doi.org/10.1787/agr_outlook-2011-es Fernández, Y., & Flores, R. (2005). Aplicación del Modelo DEA en la Gestión Pública. Un análisis de la Eficiencia de
las Capitales de Provincias Españolas. Universidad de León.
Furtado, A. (2009, Abril). Biocombustibles y Comercio Internacional: Una perspectiva Latinoamericana. Unidad de Recursos Naturales y Energía de la División de Recursos Naturales e Infraestructura. Documento presentado en el marco del proyecto “Modernization of the State, productive development and sustainable use of natural resources” Santiago de Chile: CEPAL.
Galacho, C. (2010). La Medida de la Efciencia Técnica de los Gupos de investigación del Área de Economía de la Universidad de Málaga.Cuaderno de Ciencias Económicas y Empresariales, 32.
Gallopín, G. (2003). Sostenibilidad y Desarrollo Sostenible: un enfoque sistemático. Medio Ambiente y Desarrollo, 63. Recuperado de: http://repositorio.cepal.org/bitstream/handle/11362/5763/S033120_es.pdf?sequence=1.
Gasca, S. (2015, Octubre 7). Foro Internacional 2015. Valorización Energética de Residuos Urbanos: Experiencias
Globales. México: D.F.
Gómez, J. (2012, Mayo). Eficiencia y Diversificación: Sector de Caja de Ahorros (Tesis de Doctorado). Facultad de Economía y Empresa, Universidad de Murcia. Murcia, España. Recuperado de https://digitum.um.es/xmlui/bits-tream/10201/28510/1/Eficiencia% 20y%20Diversificaci%C3%B3n.%20Autor_Juan%20C%C3%A1ndido%20 G%C3%B3mez%20Gallego.pdf
González, F., & Álvarez, P. &. (2001). Análisis no Paramétrico de Eficiencia en Explotaciones Lecheras. Oviedo, España: Departamento de Economía, Universidad de Oviedo.
Groom, M., Gray, E., & Townsend, P. (2008, Noviembre 13). Biofuels and Biodiversity: Principles for Creating Better Policies for Biofuel Production. Conservation Biology, 22 (3), 602-609. http://dx.doi.org/ 10.1111/j.1523-1739.2007.00879.x.
Gutiérrez, E. (2007, Diciembre). De la Teoría del Desarrollo al Desarrollo Sustentable. Trayectorias, 9(25), 21- 35. Recuperado de: http://www.redalyc.org/pdf/607/60715120006.pdf.
Guzman, I. (2005, ). Predicción de Resultados Empresariales Versus Medidas no Paramétricas de Eficiencia Técnica:
Evidencia para Pyme de la Región de Murcia. Trabajo presentado en VII Reunión de Economía Mundial,
Carta-gena. España. Recuperado de http://repositorio.bib.upct.es/dspace/handle/10317/856
Heinimo, J. (2008). Methodological Aspects on International Biofuels Trade: International Streams and Trade of Solid and Liquid Biofuels in Finland. Biomass and Bioenergy, 32, 702 - 71 6, doi:10.1016/j.biombioe.2008.01.003 Hernández, R., Collado, C., & Baptista, P. (2010). Metodología de la Investigación (5a ed.). México, D.F.: Mc Graw
Hill.
Herrera, P., & Francke, P. (2007, Febrero). Un análisis de la Eficiencia del Gasto Municipal y sus Determinantes. CIES,
Pontifica Universidad Católica del Perú .
Hertel, W., & Beckman, J. (2011, Febrero). Commodity Price Volatility in the Biofuel Era: and Examination of the Linkage Between Energy and Agricultural Markets. Biomass and Energy, 16824, 278- 289, Recuperado de http://
www.nber.org/papers/w16824.
IFQC (2006, Abril).Market and Publicy Developments Quality, Standars & Handling.Metanol Institute.
INEGI (2012). El Sector Enrergético en México: Series sectoriales. Recuperado de: http://internet.contenidos.inegi. org.mx/contenidos/productos//prod_serv/contenidos/espanol/bvinegi/productos/integracion/sociodemografico/ Energetico/2012/Ener2012.pdf
Jassen, R., & Damian, R. D. (2011, Enero 25). Sustainability of biofuels in Latin America: Risks and opportunities. Energy Policy, 39(10), 5717–5725. doi:10.1016/j.enpol.2011.01.047.
López, J., Henao, S., Morales, M. (2007, Diciembre). Aplicación de la técnica dea (data envelopment analysis) en la Determinación de eficiencia de centros de costos de producción. Scientia and technica, Universidad Tecnológica
de Pereira. 37(7).
Maldonado, M. (2008, Diciembre). Una Aproximación a la Eficiencia Técnica del Gasto Público en Educación en las Regiones de Perú. Consorcion de Investigacón Económica y Social.
Montiel, J. (2010, Abril). Potencial y Riesgo de los Bioenergéticos en México. Red de Revistas Cientificas de América
Latina, Estudios de Economá Aplicada, 6(1), 57- 62.
Moreno, E., Vidal, J., Morgan, C., Espinosa, M., & Roblero, I. (2012, Junio). Aceites Reciclados de Cocina como Materia Prima de Proxima Generación para la Obtención de Biodiesel en Chiapas. Concyteg, 85(7), 895- 910. Nuñez, M., Diaz, L., & Martínez, C. (2004). Estudio de la Eficiencia de las Empresas de la Cadena de la Madera en la
Comunidad de Madrid. Cuaderno de Ciencias Sociales de España, 18(1), 115- 120.
OCDE. (2013). Evaluaciones sobre el Desempeño Ambiental en México. OCDE. Recuperado de http://www.oecd.org/ fr/env/examens-pays/EPR%20Highlights%20MEXICO%2020 13%20ESP.pdf
OCDE-FAO. (2010). Perspectivas Agricolas 2010-2019. OCDE-FAO. http://dx.doi.org/10.1787/agr_outlook-2011-es OIEA (2008, Julio). Indicadores Energéticos del desarrollo sostenible: directrices y metodologías.Viena, Austria:
De-partamento de Asuntos Económicos de y Sociales de las Naciones Unidas.
OLADE & CEPAL (2003, Diciembre). Energía y Desarrollo Sustentable en América Latina y el Caribe: Guía para la formulación de políticas energéticas. (1aed.). Santiago de Chile: CEPAL, 11- 56. Recuperado de: http://www.cepal.
org/drni/proyectos/energ%C3%ADa/ Manualespanol.pdf
Palomares, R. (2012). Análisis de Eficiencia con Variables Exógenas Categóricas. Un Estudio Monte Carlo para Con-trarrestar un Nuevo Método. Grupo de eficiencia y Porductividad Efiuco.
Pastor, J. (1995, Junio). Eficiencia, Cambio Productivo y Cambio Técnico en los Bancos y Cajas de Ahorro Españolas:
Un Análisis de Frontera No Paramétrico. Ponencia presentada en el VII congreso de Asociación Científica
Eu-ropea de Científicos de Economía Aplicada Instituto Valenciano de Investigaciones Económicas. Recuperado de http://aeea.webs.upv.es/aeea/ficheros/congresos/congresoAlbacete2007/ACTAS_VI_CEA-AEEA.pdf
Pierri, N. (2005, Julio). Sustentabilidad? Desacuerdos sobre el Desarrollo Sostenible. Colección América Latina y
Nuevo Orden Mundial. (1a ed.). D.F., México: Universidad Autónoma de Zacatecas & Miguel Angel Porrúa.
Pistonesi, H., Nadal, G., Bravo, V., & Bouille, D. (2008, Marzo). Aporte de los Biocombustibes a la Sustentabilidad
del Desarrollo en América Latina y el Caribe: Elementos para la Formulación de Políticas Públicas.Santiago de
Chile: CEPAL.
Quiroz, J. (2014). El Destino Está en los Detalles: Las Leyes Secundarias y la Reforma Energética. México: Instituto Michoacano Para la Competitividad (IMCO).
R, B., A., C., & Cooper., W. (1984). Some models for estimating technical and scales inefficiencies. Data Envelopment
Analysis, 30, 1078-1092.
Rojas,R. (2001). Guía para Realizar Investigaciones Sociales (27a. Ed.). D.F., México: Plaza y Valdés.
Romeu, A., & Rodríguez, Y. (2008). Procedimiento para la Evaluación de la Eficiencia Técnica en la Transportación
de Caña en las UPBC Cañeras de la Provincia de Villa Clara. Santa Clara, Cuba: Universidad Central de Santa
Clara.
Sanhueza,E. (2003, Noviembre). Fronteras de Eficiencia, Metodologías para la Determinación del Valor Agregado de Distribución. (Tesis de doctorado). Pontífica Universidad Católica de Chile. Recuperado de http://web.ing.puc.cl/ power/paperspdf/sanhuezathesis.pdf
SENER. (2007). Energías Renovables para el desarrollo sustentable en México. D.F., México: SENER. SENER. (2007). Programa de Introducción de Bioenergéticos. D.F., México: SENER.
Schuschny (2007, Enero). El método DEA y su aplicación al Estudio del Sector Energético y las Emisiones de CO2 en América Latina. CEPAL, 46, 46-53.
Sierra, R. (2007). Tesis Doctorales y Trabajos de Investigación Científica (5a. ed.). Madrid, España: Thompson. Soimakallio, S., & Koponen, K. ( 2011, Junio 23). How to Ensure Greenhouse gas Emission Reductions by
Increa-sing the Use of Biofuels? Suitability of the European. Biomass and Bioenergy, 35, 3504 - 3513, http://dx.doi.org/
10.1016/j.biombioe.2011.04.041.
Timilsina, G., & Arshish, S. (2010, Julio). Biofuel, Markets, Targets and Impact. Policy Research .