Evaluating the impact of public subsidies on a firm’s performance: a two stage quasi experimental approach
24
0
0
Texto completo
(2) 06 Duch. 19/11/09. 144. 12:26. Página 144. Duch, N., Montolio, D. and Mediavilla, M.. milares, pero no subvencionadas (control). Se utiliza la metodología del Propensity Score Matching (PSM) para construir un grupo de control que sea lo más parecido posible, respecto a sus principales características, al grupo de tratamiento, que permita identificar a las empresas que presentan la misma propensión a recibir subsidios públicos. Segundo, una vez se ha establecido un grupo de comparación válido, se comparan los resultados de las empresas de los diferentes grupos utilizando técnicas de regresión. Como resultado, se encuentra que las empresas que reciben subvenciones, en promedio, parecen aumentar su valor añadido como resultado directo de los programas públicos. Clasificación JEL: H25, H32, L25, L53. Palabras clave: política de I+D, evaluación, resultados empresariales, Propensity Score Matching.. 1.. Introduction. There seems to be little controversy about the desirability of governmental support to R&D and technological innovation and, nowadays, most countries spend significant amounts of money on programs intended to promote these activities. The justification for this support comes from the correction of market failures argument which states that social returns to R&D activities are greater than private returns making the market allocation of these resources sub-optimal. Two main policies have been implemented to solve the under-provision of innovation effort by private business: direct involvement of governmental bodies in these activities, and incentives for an increased provision of private investment in R&D. Concerning the latter, several instruments can be identified. There are tax incentives that reduce the marginal cost of R&D for all firms performing such activities so there is a priori no crowding out effects (see Hall and van Reenen, 2000 for a survey). Furthermore, direct funding of programs by public agencies allows subsidies to be targeted towards projects that are perceived to achieve higher social rates of return. However, given the intricacies of R&D activities and technological policy, public funds may end up financing projects with high private returns and thus crowding out private investment in R&D (see David et al., 2000 for a review of the related empirical literature). But do public subsidies to R&D complement or substitute private spending on R&D? Given the ambiguous answers offered by the literature, more empirical evidence on the effects of public R&D spending on private performance is needed. Moreover, as Klette et al. (2000) argue, compared to the size of the budgets and the current emphasis on technology policy, there has been relatively little effort to quantitatively evaluate the additionality of R&D subsidies. Recently a growing literature dealing with regional innovation systems has emerged (see, for example, Acs, 2000; Fornahl and Brenner, 2003) arguing that the regional dimension is of key importance for technology policy. There are several reasons to support this view. Firstly, regions differ with regard to their industrial specialisa-.
(3) 06 Duch. 19/11/09. 12:26. Página 145. Evaluating the impact of public subsidies on a firm’s performance: a two-stage... 145. tion patterns and their innovation performance (Paci and Usai, 2000). Secondly, knowledge spillovers, which play a key role in the innovation process, are often spatially constrained (Audretsch and Feldman, 1996). Finally, policy competences and institutions are partly bound to subnational territories (Cooke et al., 2000). This is particularly important in countries where a variety of public agencies are involved in the design and implementation of technology policy. Within the European Union member states, for instance, EU-level, national and regional R&D subsidies are in place. Recent contributions show that the objectives of national and regional agencies differ substantially (Blanes and Busom, 2004; García and Afcha, 2009) and the evaluation of the additionality effects of public R&D subsidies should take into account this allocational heterogeneity. The aim of this paper is to provide further evidence on the impact of public R&D subsidies at the regional level. We estimate, by using a quasi-experimental approach, the impact of the subsidies granted by the Catalan Public Agency (CIDEM, hereafter)1 on the growth rate of the recipient firms’ value added in two steps. Firstly, we compute the Propensity Score (PS, hereafter) and, by means of matching techniques, we evaluate the impact of public subsidies by comparing the outcomes of firms which receive public support with those which do not. Secondly, using the PS obtained in the first stage in order to detect valid controls, we match each recipient firm with the one (or more) that it most closely resembles in the control group, and then we perform standard regressions to measure the impact of the public subsidies. The rest of the paper is organized as follows. Section 2 briefly reviews the rationale for the existence of subsidies devoted to R&D, especially at the regional level. Section 3 presents the institutional framework of R&D subsidies in Catalonia. Section 4 summarises the main methodological issues involved in the empirics of the paper. Section 5 describes the database used. Section 6 presents the main results obtained. Finally, section 7 concludes.. 2.. Evaluating R&D subsidies: the state of the art. Technology and innovation are key issues in today’s economies, as they form the basis for competitiveness and long-term growth. From the individual firm’s perspective, there are incentives to perform R&D activities. On the one hand, successful innovations help to strengthen and to consolidate competitive advantages, and on the other they can represent, for the successful firm, a gain in market power and, therefore, supernormal profits for at least some time. The extent to which a firm that spends significant amounts on R&D can profit from its investments poses a dilemma for innovation in a market system. The expected profit from investing in R&D is lower the greater the probability that knowledge, once produced, becomes common to everyone. Thus, the inability to fully appropriate the profit flows from successful innovations reduces private incentives to invest in innovative activities. 1. From the Catalan acronym for Centre d’Innovació i Desenvolupament Empresarial..
(4) 06 Duch. 19/11/09. 146. 12:26. Página 146. Duch, N., Montolio, D. and Mediavilla, M.. If, as seems to be the case, the private sector under-invests in innovation from a social point of view, then there is a case for public efforts to encourage R&D spending. Depending on their main objectives, governments can establish different mechanisms to promote innovative activities. For instance, public bodies can be directly involved in the provision of R&D by financing basic research through systems that facilitate the transmission of knowledge to the private sector. Moreover, governments can create incentives for an increased provision of private investment in R&D. Patents are one of the most important public policy instruments used to reward innovating firms. The classical argument for using patents is that by granting a temporary monopoly right to the innovator, potential innovators have an incentive to devote resources to R&D. The cost of this policy is that patent holders restrict access to the innovation during the patent period. Thus, the optimal choice of patent length is for a social planner a trade off between the benefit of more innovation and the cost associated with temporary monopoly power. The seminal work of Nordhaus (1969) is the main theoretical justification for the existing long and broad degree of patent protection, showing that the welfare loss of long patents is minimal, while the social cost of choosing too short a patent life is great. Gallini and Wright (1990) and Matutes et al. (1996) have showed that extending the length of the patent delays the rate of introduction of new innovations and thus impacts negatively on the diffusion of new discoveries. Besides the patent system, governments might also subsidize private R&D, directly or by means of tax incentives. The latter reduce the marginal costs of R&D and have the virtue of being more neutral in the type of firms and projects funded than other measures of direct support, letting private business determine the projects and the amount of R&D (Hall and van Reenen, 2000). This virtue can also be seen as a weakness as it might be socially preferable to steer R&D towards projects with high spillover effects (Hall, 1993; Mohnen, 2000). Tax incentives are unlikely to be effective in promoting R&D by high-technology start-up firms or Small and Medium Enterprises (SME, hereafter): for a tax credit to be effective, a firm must have tax obligations that the tax credit can be used to satisfy. Direct public subsidies for private R&D allow governments to target projects with perceived higher social rates of return. Some theoretical models of R&D policy show that R&D subsidies can restore incentives to reach efficient allocation when knowledge spillovers are the main reason for underinvestment (Blanes and Busom, 2004). Implementation of a subsidy-based R&D policy, however, may be difficult in practice given the information asymmetries: the public agency must be able to identify those R&D projects with higher social returns that are unlikely to be carried out by private firms in isolation (Socorro, 2007). In this case, there is a risk that government-funded R&D will simply crowd-out private investment (David et al., 2000 and Wallsten, 2000). The danger of such displacement is particularly important because governments can end up allocating scarce public funds sub-optimally and discouraging the R&D activities of private entities. Moreover, several contributions from the geography of innovation literature have highlighted the great geographic concentration of technological activities and the re-.
(5) 06 Duch. 19/11/09. 12:26. Página 147. Evaluating the impact of public subsidies on a firm’s performance: a two-stage... 147. gional dimension of the innovation process (Storper, 1995; Feldman and Audretsch, 1999). Besides, innovation systems differ among regions which suggests the use of policies designed exclusively to deal with specific regional characteristics (Tödtling and Trippl, 2005; Nauwelaers and Wintjes, 2008). Consequently, regional governments have acquired a growing role in the definition and application of technology policy (Fritsch and Stephan, 2005), and many countries carry out these policies from a multi-level perspective where regional, national and international agencies are involved in the allocation of R&D subsidies2. Although this overlapping allocation mechanism calls for the efficient coordination of national and regional agencies granting R&D subsidies3, recent contributions using Spanish data have shown that different agencies follow very different policy objectives. More precisely, regional agencies are oriented towards SMEs and/or traditional sectors whereas national subsidies tend to reach larger firms already performing R&D activities (Blanes and Busom, 2004). Furthermore, having received a regional R&D subsidy has a positive impact on the probability of receiving a national grant and vice versa (García and Afcha, 2009). To sum up, as Herrera and Nieto (2008) argue, it is necessary to consider the location of firms in order to eventually assess the effect of the innovation policy correctly. The increased importance of regional innovation policy has not been accompanied by an equivalent upsurge in evaluation studies confirming the positive impact of the actions undertaken on a regional scale. Although some studies take the regional dimension into account in the concession of R&D subsidies, (Czarnitzki and Fier, 2002; Blanes and Busom, 2004) the literature on the evaluation of regional innovation policy is still scarce and offers little information on the performance of regional innovation systems. While studies of the impact of public subsidy programs conducted at the national level are common and include, among others, Lenihan and Hart (2004), Arvanitis et al. (2002), Lerner (1999), Wallsten (2000) or Roper et al. (2004), evaluation exercises conducted at the regional level are less frequent. For instance, Turok (1997) evaluates the impact (and effectiveness) of the European Structural Funds in Scotland; Lenihan (1999; 2004) studies the impact of public subsidies on the Shannon region in Ireland or Lambrecht and Pirnay (2005) who carry out an evaluation of public support measures to R&D in the Walloon Region of Belgium. While varying widely in their geographic scope, what all of the aforementioned studies have in common is their use of parametric techniques for performing policy evaluations. However, a non-parametric technique, Propensity Score Matching (PSM, hereafter), has gained increased popularity in carrying out policy evaluation exercises. Using PSM to undertake studies at the national level, Almus and Czarniztki (2003) look at the impact of public subsidies on a firm’s R&D intensity in Germany, Duguet (2004) analyses the consequences of public subsidies for the private fi2. Regional agencies normally restrict their activities to R&D subsidies given that in most cases they have no legal capacity to create tax incentives nor modify the rules concerning the patent system. 3 This topic is relevant but lies far beyond the scope or this paper. The interested reader is referred to Baldwin and Martin (2006) for a comprehensive discussion on the coordination of industrial policy..
(6) 06 Duch. 19/11/09. 148. 12:26. Página 148. Duch, N., Montolio, D. and Mediavilla, M.. nancing of R&D activities in France, and Herrera and Heijs (2007) evaluate the importance of public subsidies for R&D in Spain. With Czarniztki and Fier (2002) representing a notable exception, the PSM technique has, however, scarcely been used in studies at the regional level.. 3.. Institutional framework: R&D subsidies in Catalonia. In Spain, the decentralization process that started in the 80’s allowed regional governments to adopt their own measures for industrial promotion to tackle the peculiarities of each regional industrial structure more effectively. In the case of Catalonia, the industrial structure has been characterized by the importance of SMEs, and a high degree of productive diversification. Moreover, Catalan industry represents around 25% of Spanish industry and, therefore, its competitive position, as well as the impact of public intervention to promote it, is of particular interest. In Catalonia, regional industrial policy intervention has been summarized in different plans directed towards overcoming some of its structural weaknesses. For instance, during the 1993-1996 period there was a plan to improve the competitiveness of Catalan industry focused on reducing regional disparities, promoting the internationalization of firms, and the adoption of new technology and R&D. The results materialized in the strengthening of specialized clusters and in a growing participation of Catalan firms in international transactions of goods and services, as well as in investment inflows and outflows. More recently, industrial policy in Catalonia has been articulated around Innovation Plan for Catalonia 2001-2004, which intended to reinforce the innovative capacity of Catalan firms (see Callejón and García-Quevedo, 2000). Apart from this the Spanish central government has undertaken some actions to promote local industries through the design of high-priority lines such as the SME Consolidation and Competitiveness Plan 2001-2006, transferring funds to regional governments to manage public programs locally, guaranteeing independence in procedures, resolutions and payments in the application of these programs4. The evaluation of these public programs to promote industrial innovation is of special interest in determining which measures have been effective (and to what extent) in the reinforcement of the competitive position of Catalan firms. Public subsidies in Catalonia, as we have mentioned, are managed by CIDEM (all subsidies analysed in this study are part of the Innovation Plan for Catalonia 20012004). The amount of the subsidies we evaluate is around 8.6 million euros, which represented, approximately, 66% of CIDEM’s total budget for the year 2000, and around 0.03% of the Catalan industrial Gross Value Added in that year. Below we briefly describe the four public programs we evaluate. Table 1 presents a quantitative description of these programs during the year 2000.. 4. The Catalan government that took office in November 2003 implemented a new plan called Research and Innovation Plan for Catalonia 2005-2008..
(7) 06 Duch. 19/11/09. 12:26. Página 149. Evaluating the impact of public subsidies on a firm’s performance: a two-stage... 149. Program 1. This program was designed to finance projects intended to improve the optimization and consolidation of firms’ resource management, flexibility, innovation, satisfaction of clients and personnel, and to improve the firm’s impact on the environment. In addition, it had the aim of supporting the firm’s competitive position in the market. Program 2. The main objective of this program was to finance projects aimed at achieving more competitive products, cost reductions, and increases in quality and productivity. Program 3. This program consisted of a package of four subsidies: i) Managerial cooperation; ii) Promotion of information services; iii) Design and iv) Networks to support innovative activities. The purposes of this program as a whole was to increase the competitiveness of firms, promote the rendering of advanced services of managerial information; the incorporation, assimilation or application of innovative technologies and/or innovative design in SMEs. Program 4. This was a public program oriented towards promoting R&D cooperation between firms and technological centres. Catalonia represents one of the biggest regional innovation systems in Spain, concentrating around 23% of total and 26% of private R&D expenditure in the country. Its total R&D budget represents 1.4% of the regional GDP. Besides these figures, it was one of the first regions to pursue an autonomous R&D subsidy policy in Spain and it also attracts a considerable amount of the subsidies granted by the national agency. Thus, evaluation of the effectiveness of these subsidies is of importance not only for Catalonia but also for other regions recently designing innovation policies and granting subsidies. Table 1.. Public subsidies granted by CIDEM (in the year 2000). Applications received (a). Applications approved (b). Covering ratio (%) (b)/(a). Total amount (€). Amount per firm (€) 5,168. Program 1. 37. 30. 81. 155,032. Program 2. 1,248. 522. 42. 941,185. 1,803. Program 3. 515. 183. 35. 6,022,927. 32,912. 142. 86. 61. 1,539,888. 17,906. 1,942. 821. 55*. 8,659,032. 14,447*. Program 4 Total * Average.. It is worth noting that many of the studies mentioned up to this point report that the firms receiving a public subsidy tend to be more innovative, confirming the additionality effect of public subsidies. In this study, however, due to lack of data, we have been unable to include any variables related to firms’ R&D activities. Nonetheless, it seems clear that innovation plays a role in the determination of the competitive capacity of firms, and consequently in their results. We will therefore use growth in the firm’s value added as a measure of performance. Furthermore, to keep the sam-.
(8) 06 Duch. 19/11/09. 150. 12:26. Página 150. Duch, N., Montolio, D. and Mediavilla, M.. ple size of recipient firms sufficiently large, we evaluate together all subsidies contained in the four programs previously described. In the next section we explain the methodology used to analyse the impact of these subsidies on the performance of firms, while section 5 completes and extends the explanation of the data base used in the empirical estimations.. 4.. Methodological issues. The best method for evaluating public programs, such as those presented in the previous section, is to use “true” or natural experiments based on random assignments as they offer the strongest foundations for analysing cause and effect relationships (Lalonde, 1986). In experimental designs of this type, units are assigned randomly to “treatment and control groups”. On average, the units in each group are equivalent with regard to all their shared characteristics. Thanks to this equivalence, the influence of external factors that could contribute to the observed results can be eliminated. Hence, any differences in the observed results between the two groups can be attributed exclusively to the implementation of the public program. Nevertheless, the adoption of an experimental design based on random assignments for the evaluation of public programs is generally not feasible. Public agencies, for instance, are unable to refuse the concession of grants to eligible companies and subsidized (treated) and non- subsidized (non-treated) firms often differ in the characteristics that affect the results of the program (i.e. selection bias). The evaluation of public programs therefore requires an alternative method, a quasi-experimental approach which allows us to compare the results between two groups of companies: those which receive public subsidy (treated firms), and those that do not (non-treated firms), with the understanding, however, that not all the subsidies are randomly assigned. In other words, there is a need to construct a control group that has ex-ante the same probability of receiving a public subsidy in such a way that both treated and non-treated firms can be considered as if they had been randomly assigned. If we consider receiving public subsidy as being the treatment effect, we can define the main impact that we wish to capture as the expected effect of treatment for the treated population, or Average Treatment of the Treated (ATT, hereafter):. ATT = E (Y 1 −Y 0 D = 1) = E (Y 1 D = 1) − E (Y 0 D = 1). [1]. where, Y1 is the outcome for firms which receive public subsidy and Y0 is the outcome for recipient firms not exposed to the treatment. Finally, Di ∈ {0,1] is an indicator of participation (D = 1 for the treated firms, D = 0 for the non-treated firms). As we mention above, receiving a public subsidy cannot be considered a completely random event and, therefore, E (Y0⏐D = 1) is not observable and must be estimated given that that is the counterfactual outcome that participants would experience on average if they do not participate in the program. To support this, matching econo-.
(9) 06 Duch. 19/11/09. 12:26. Página 151. Evaluating the impact of public subsidies on a firm’s performance: a two-stage... 151. metric estimators, based on the seminal contribution of Lalonde (1986)5, are shown to produce, under certain assumptions, valid estimates of policy impacts6. Using matching estimators we are then able to build a counterfactual sample of firms (the control group) by pairing each recipient firm with a non-treated firm. As Rubin (1977) points out, a necessary assumption here is conditional independence between outcomes for non-treated firms and program participation, given that some characteristics (X) are observable. The control group, therefore, is constituted of nonparticipant firms whose distribution of observed characteristics is as similar as possible to that of the treated firms. This requires:. 0 < Pr( D = 1X = x ) < 1. [2]. for x ∈X. and guarantees that all treated firms have a counterpart in the control group. An implementation problem arises when the vector X is highly dimensional, as it is in our case (see section 5). Rosembaum and Rubin (1983) proposed the use of the probability (a scalar function) of receiving treatment conditional on covariates. This probability p(X) is the propensity score (PS). The matching method would estimate the ATT as:. {[. )}. ] (. ATT = E E Y 1 D = 1, p ( X) − E Y 0 D = 0, p ( X ) D = 1. [3]. Eq. [3] is derived from Eq. [1] with the requirement of an adequate balancing of pre-treatment variables. If this balancing hypothesis is fulfilled, observations with the same PS must have the same distribution of observable characteristics which are independent of their treatment status. Given that the PS is defined as the conditional probability of receiving a treatment given the pre-treatment characteristics, we estimate a probit model with the covariates estimation. {. }. Pr {D =1X} = Φ h( X ). [4]. where Φ is the normal function, and h(X) is an initial specification which includes all the covariates as linear terms (see Greene, 2003 for more details). Once we compute the PS, we can use several matching estimators. We construct the match for each treated firm as a weighted average over the outcomes of non-participants, where the weights depend on the distances between estimated PS. The more 5 Many studies examine the strengths and limitations of matching methods using non-experimental data, see for instance Dehejia and Wahba (1999, 2002) and Smith and Todd (2004). 6 These assumptions are the following. First, conditional independence: conditional on the vector of observable characteristics the outcomes are independent of treatment. Second, matching, this is a necessary assumption for identifying some population measures of impact. Third, conditional mean independence: the outcome for the non-treated group does not determine participation in the program. See Cameron and Trivedi (2005) for a detailed exposition of these assumptions..
(10) 06 Duch. 19/11/09. 152. 12:26. Página 152. Duch, N., Montolio, D. and Mediavilla, M.. similar the firms are in terms of these propensities, the higher the weight. Here, we employ four matching alternatives: the Nearest Neighbour estimator (NNM), the Radius estimator, the Stratification estimator and the Kernel estimator (Becker and Ichino, 2002)7. With the two groups of firms, “treated” and “non-treated”, we are now able to perform a first evaluation exercise as defined in Eq. (1), which is to estimate the average treatment of the treated firms. In a second stage, we use the estimated PS of the first stage to construct various quasi-experimental control groups8 which when combined with the treatment group allow us to estimate, through a classic production function regression model, the impact of public subsidies on the performance of firms controlling for several potentially influential factors. Given the lack of data referring to R&D indicators, our aim is to estimate the variation in the firms’ results, focusing our attention on the effect of public subsidies. We use a modified Cobb-Douglas production function, where production (Q) is a function of labour (L), capital (K) and intermediate inputs of production (M), as well as of the specific effects for each firm (F) and for the j industry (I) where the firm operates:. Q i = f (L i , K i , M i , F, Ij ). [5]. subtracting intermediate inputs of production (M) from each side of the equation yields:. V i = Q i − M i = f (L i , K i , F, I j ). [6]. where Vi is the value added of firm i. Since we are interested in estimating the contribution of public subsidies to a change in the value added of firms, we adopt a growth accounting framework. By first taking the differences in the production function in [6] we obtain the following relationship:. Δ t logV i = Δ t log L i + Δ t logK i + F + I j. [7]. where Eq. [7] presents the growth rate of value added between years 2000 and 2002. The specific effects for company (F) and sector (I) are also assumed to be fixed in the growth equation and, therefore, they are not represented in terms of a variable of change.. 7. The various matching estimators differ in their definition of distance between a treated firm and its most similar non-treated firm in terms of the estimated PS. 8 The various groups are constructed with different numbers of observations, that is, matching each treated firm with the one, two, and five most similar (with respect to the PS) firms from the control group in order to check the robustness of the results. Note that this procedure differs from the matching methodology where the final number of firms in the control group depends on the estimator and the computed distance..
(11) 06 Duch. 19/11/09. 12:26. Página 153. Evaluating the impact of public subsidies on a firm’s performance: a two-stage... 153. To control for specific effects at the firm level, we include the logarithm of the total number of workers and the logarithm of the value added in the initial year. The first variable controls for the initial firm size, while the second controls for the initial levels of competitiveness and positioning in the market. Formally, the estimated equation is:. Δ t logV i = β1 Δ t log L i + β 2 Δ t log K i + β3 logV i ,t −1 + β 4 log L i,t −1 + I j + ei. [8]. where Δt log Vi is the change in the logarithm of value added, Δt log Li is the change in the logarithm of the number of workers, Δt log Ki is the change in the logarithm of capital, log Vi,t-1 is the logarithm of the value added in the initial year, log Li,t-1 is the logarithm of the number of workers in the initial year, Ij is a set of sectoral dummy variables9, and, finally, ei is an error term. To conclude, we introduce the variables related to public subsidies (denoted by T) to estimate their effects on the growth rate of value added for recipient firms compared with non-recipient firms:. Δ t logV i = β1 Δ t log L i + β 2 Δ t log K i + β3 logV i ,t −1 + β 4 log L i,t −1 + I j +T i + ei. [9]. T denotes dummy variables that take the value 1 if the firm received a subsidy from any of the above mentioned programs in the year 2000 (treated) and 0 if not (non-treated).. 5.. Data. Two main sources of information are used in this paper. The first is the CIDEM database on those firms that received a public subsidy in Catalonia (from which we obtain the treatment group) and the second is the Sistema Anual de Balances Ibéricos (SABI, hereafter) database which is used to construct the control group. This database is a representative sample of firms in Spain and contains information on the accounts of individual firms. In 2007 it held information on more than one million Spanish firms, of which about 230,000 were located in Catalonia10. We construct our control group from those firms located in Catalonia that did not apply for public subsidies from the regional agency. Moreover, we complete the CIDEM’s data on recipient firms with the information contained in SABI for those firms.. 9 We also introduce other dummy variables to control for certain characteristics of the participating firms (see section 5). 10 The availability of data from the SABI database increases with the size of the firm. The SABI includes less than 5% of small firms, representing 31.4% of the overall employment in that category. However, the SABI covers 31% of firms with more than nine workers, and more than half of the larger firms (55.3%). These figures show that the sample of firms recorded in the SABI can be considered sufficiently representative of the population of Spanish (and Catalan) firms..
(12) 06 Duch. 19/11/09. 154. 12:26. Página 154. Duch, N., Montolio, D. and Mediavilla, M.. The SABI database enables us to analyse the behaviour of a very broad sample of firms, as it contains company information on balance sheets and profit and loss accounts and several economic indicators. With all this information to hand, we are able to organize the information at the territorial level, to classify firms according to the NACE-Rev.1 classification, and we can accurately define company size by examining information concerning the number of employees. For our study, we collected data from the SABI database from two points in time: first from 2000, the year in which the subsidy was granted, and second from 2002, in order to determine if, over time, there exists a significant impact from public subsidies on the main aggregates of firms. The information required to identify the treatment group was obtained directly from CIDEM. The total number of applications received by the agency in the year 2000 was 1,942 of which 821 were accepted11. We were able to locate 601 of the successful applicants in the SABI database, but unfortunately we were not able to obtain the relevant information for all of them. Therefore, our study is conducted using 421 firms which received a public subsidy and for which there is complete information in the SABI database. This gives us a covering ratio (treated firms with all the relevant information in relation to the total number of treated firms) of 51.3%. The first step in selecting firms, from those located in Catalonia, that could be considered eligible for the control group was to eliminate all those companies that received a subsidy and all those companies that operate in sectors not represented by any firm in the agency records (sectors in which firms did not apply for a subsidy). The result was data for 66,763 companies, these being the set from which we could select non-treated firms. After a filtering process in which we eliminated those firms with missing data, we finally had a quasi-experimental control group of 32,011 companies. The variables used to estimate the PS were selected on the basis of related empirical evidence and the information available in the SABI database. Previous studies have identified three groups of relevant variables that can determine the propensity to obtain a public subsidy12. Table A.1 in the appendix presents the descriptive statistics from the variables used. Firstly there are structural variables such as size (L) proxied by the number of workers; the sector in which a firm operates (Dht is a dummy variable for high technology manufacturing and Sht for knowledge intensive services); a firm’s age (Years), that is, the number of years a firm has been operating in the market;13 location. 11. We only have information for firms that finally received a public subsidy and not for the rest, i.e. those firms which unsuccessfully applied for a subsidy. 12 The selection of variables that a priori can determine the propensity to receive public subsidies basically follows Almus and Czarnitzki (2003), Arvanitis et al. (2002), Busom (2000) and Heijs (1999, 2001). For reasons of space we do not report the arguments behind the introduction of these variables that can be found in detail in the studies mentioned and in the references therein. 13 We also include a quadratic term for the effect of a firm’s age on its propensity to receive a subsidy Years2) in order to capture any possible non-linearities in the relationship, related to the learning curve (Y effect..
(13) 06 Duch. 19/11/09. 12:26. Página 155. Evaluating the impact of public subsidies on a firm’s performance: a two-stage... 155. (Loc) proxied by a dummy variable that distinguishes between firms located in the municipality of Barcelona (central city) and the rest of the Catalan region; a firm’s property structure (Inin) a variable which takes the value 1 if any shareholder has more than 25% of the total number of shares; the number of subsidiaries as an indicator of the degree of diversification of a firm (Nsub); and a variable reflecting credit constraints proxied by the firm’s solvency ratio, (Solv) which also appears in the literature to be an important determinant of a firm’s propensity to receive a public subsidy. Secondly, market-related variables serve to control for the competitive atmosphere in which firms operate. We consider a firm’s exports to be an indicator of competitiveness measured by dummy variables for whether the firm exports (Exp) and/or imports (Imp); and a firm’s investment capacity measured by the capital requirements variable (Creq) taken from the SABI database. Thirdly, we include in the estimation of the propensity to obtain a public subsidy a firm’s capital (K) and intermediate inputs (M) used in production.. 6.. Main results. With the dataset outlined above, we first estimate a probit model to obtain the PS for each firm, and using these scores and various matching techniques we calculate the average effect on the treated firms (ATT) by examining the impact of public subsidies on a firm’s results. Then, for various control group sizes, we use a classic regression technique to evaluate the impact of the various public programs aimed at promoting the competitiveness of firms in Catalonia. 6.1.. Determinants for receiving public subsidies. The results of the probit estimation used to calculate the PS are presented in table 2 for three different specifications (denoted SP1, SP2 and SP3, respectively)14. Briefly, the variables that determine the propensity to be awarded public subsidies are stable across the three different specifications shown. The variables which prove to be significant in all specifications are those variables related to a firm’s characteristics. Firstly, the dummy variables that account for high technology manufacturing (Dht) and knowledge intensive services (Sht) are highly significant, indicating that firms operating in these sectors have a greater propensity to receive subsidies. Secondly, export activity (Exp) is also significant, which indicates that firms facing external competition are more likely to be subsidised in order to reinforce their competitiveness both domestically and internationally. Finally, the number of years that a firm has been operating (proxy for organizational capacity and experience) is statistically significant as well. When the square of the number of years term is also considered our results show an inverted U relationship, indicating that the propensity to re14. Not all the specifications satisfy the requirements to construct the PS. In table 2, therefore, we only present the variables that satisfy these so-called balancing conditions. For the technical details of this method, see Becker and Ichino (2002)..
(14) 06 Duch. 19/11/09. 156. 12:26. Página 156. Duch, N., Montolio, D. and Mediavilla, M.. ceive a subsidy increases with the age of the firm up to a certain point and subsequently decreases. Table 2.. Propensity to receive a public subsidy SP1. Constant Years Years2 VA L. –6.4531 (–20.36) 0.0452 (3.26) –0.0006 (–2.82) 0.2718 (3.77) –0.1237 (–1.51). SP2 *** *** ***. –5.7685 *** (–26.27) 0.0484 *** (3.49) –0.0006 *** (–2.91). *** 0.0561 (1.02). K M Inin Imp Exp Dht Sht. Log–Likelihood Pseudo R2. 0.5138 (2.11) 0.2527 (1.52) 0.3281 (2.03) 0.6715 (4.98) 0.8624 (2.99) –2189.6 0.025. **. ** *** ***. 0.0863 (2.48) 0.5643 (2.32) 0.2341 (1.40) 0.3361 (2.08) 0.6973 (5.18) 0.9312 (3.22) –2167.5 0.024. ** **. ** *** ***. SP3 –6.4821 (–20.16) 0.0448 (3.21) –0.0006 (2.78) 0.2762 (2.48) –0.1485 (1.75) –0.0192 (–0.23) 0.0343 (0.80) 0.5189 (2.13) 0.2354 (1.41) 0.3196 (1.98) 0.6645 (4.92) 0.8974 (3.09). *** *** *** ** *. **. ** *** ***. –2162.8 0.026. Notes: t-statistics in parentheses. *, ** and *** indicate statistical significance at 90, 95 and 99 percent levels, respectively. Data are for the year 2000. The number of observations is 32,431. The dependent variable is 1 if the company receives a public subsidy and 0 otherwise. Estimation carried out with a probit model. Inin is 0 if the company has one or more shareholders with more than 25% of the shares. Imp is 0 if the company does not import. Exp is 0 if the company does not export. Dht is 0 if the company is not part of a high technology manufacturing sector. Sht is 0 if the company is not part of a high technology services sector.. From table 2 we can conclude that sectoral differences are highly significant in determining the propensity of a firm to receive a public subsidy. This indicates that public subsidies in Catalonia have been mainly directed towards high technology sectors. This result confirms previous empirical findings for both Spain (Heijs, 1999, 2001; Busom, 2000), as well as other countries (Arvantis et al., 2002; Almus and Czarnitzki, 2003; Czarnitzki and Fier, 2002), which indicate that certain sectors, most prominently high-tech, participate more actively in public programs than others. Moreover, while structural variables, such as a firm’s size (L) and the independence indicator (Inin), influence its propensity to obtain a public subsidy, location.
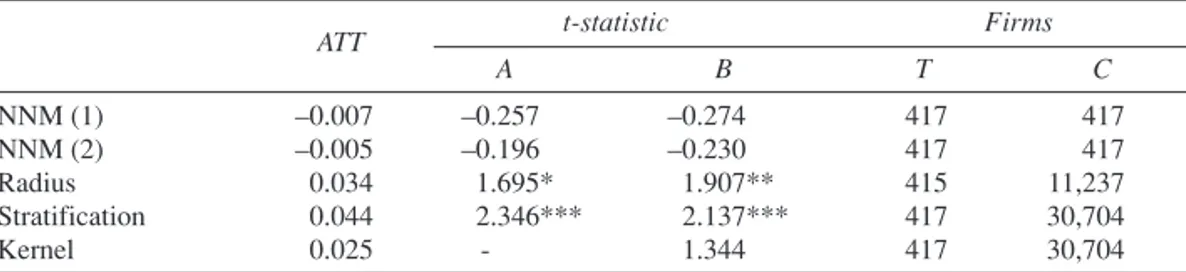
(15) 06 Duch. 19/11/09. 12:26. Página 157. Evaluating the impact of public subsidies on a firm’s performance: a two-stage... 157. and credit constraints do not appear to have an impact. For this reason, we do not include the latter variables in the determination of the PS. In the case of market-related variables, a firm’s investment capacity seems to have no impact on its propensity to receive an R&D subsidy, while in the case of capital (K) and intermediate inputs (M) of production, their relevance is found to be small and not very significant. For instance, capital only enters into SP3, and is not significant, while intermediate inputs are only significant in SP2. Size, proxied by the number of employees, is not significant in the first two specifications, but in the third we find it to have a negative and significant influence on the PS. It seems, then, that SMEs do receive public subsidies with a greater frequency than big firms. This finding contradicts usual reports for this variable both in the Spanish case (Fernández et al., 1996; Heijs, 1999, 2001) as well as in the cases of other countries (Almus and Czarnitzki, 2003; Czarnitzki and Fier, 2002). 6.2. The effects of public subsidies on a firm’s performance: the first-stage After analysing and controlling for observable differences between groups of firms, we then estimate the average effect of public subsidies on the value added growth rate of the treated firms. Our results for the third specification (SP3 in table 2) presented in the previous section are summarized in table 315. In order to estimate the average effect of the treatment, we use an area of common support, which enables us to eliminate those firms that present poor matching. As shown in figure 1 the observations outside the overlapping area between the two distributions are left out of the common support area. This procedure guarantees that both treated and non-treated units have the same distribution of observable characteristics, making them independent of the treatment status. This restriction improves our estimation of the ATT without reducing the sample by too much. When calculating the ATT, the sample of firms varies according to the proposed estimator, and as companies can never be identical the size of the control group is non-homogeneous. Moreover, as the requirements that have to be met when calculating the different estimators vary, the number of firms in the treatment group also varies. Thus, the number of firms receiving a subsidy is 417 (or 416 in the case of the Radius estimator), with the control group oscillating between 414 at the lowest (Nearest Neighbour estimators) and 30,603 at the highest (Stratification and Kernel estimators). Table 3 shows that the parameters obtained by means of nearest neighbour estimators, NNM(1) and NNM(2), are not statistically significant16. Significant estimations show that treated firms present value added growth rates that are 3.5% higher in 15. The estimations for SP1 and SP2 are presented in tables A.2 and A.3 in the appendix. Nearest Neighbour estimator (NNM) consists of taking each treated unit and searching for the control unit with the closest PS. It seems clear that some of these matches are poor because for some treated units the nearest neighbour may have a very different PS and, nevertheless, contribute to the estimation of the treatment effect independently of this difference.. 16.
(16) 06 Duch. 19/11/09. 158. 12:26. Página 158. Duch, N., Montolio, D. and Mediavilla, M.. Figure 1. Box-Plot of treatment and control distributions of predicted PS (using specification 3 in table 2). Note that the overlapping PS in both groups (box) is the area of common support.. the case of the Kernel estimator, 4.4% higher with the radius estimator, and 5.6% higher using the stratification estimator than non-treated firms. It seems, therefore, that the inclusion of more companies increases the statistical significance of the estimators (bearing in mind, of course, that the requirements for the construction of the control group differ according to the estimator used). Table 3.. Average effect of subsidies on firm’s performance for SP3 t-statistic ATT. NNM (1) NNM (2) Radius Stratification Kernel. 0.017 0.011 0.044 0.056 0.035. A 0.700 0.436 2.307 *** -. Firms B 0.606 0.439 2.246 *** 3.091 *** 2.034 ***. T. C. 417 417 416 417 417. 414 414 10,316 30,603 30,603. A – t-statistic (analytic); B – t-statistic (bootstrapping ); T – Number of Treated firms; C – Number of Control firms; (1) Nearest neighbor with random selection; (2) Nearest neighbor with identical weights. *, * * and *** indicate statistical significance at 90, 95 and 99 percent levels, respectively.. These results appear robust, as the estimators obtained for the other specifications considered in table 2 to obtain the PS confirm (see appendix). Effectively, nearest.
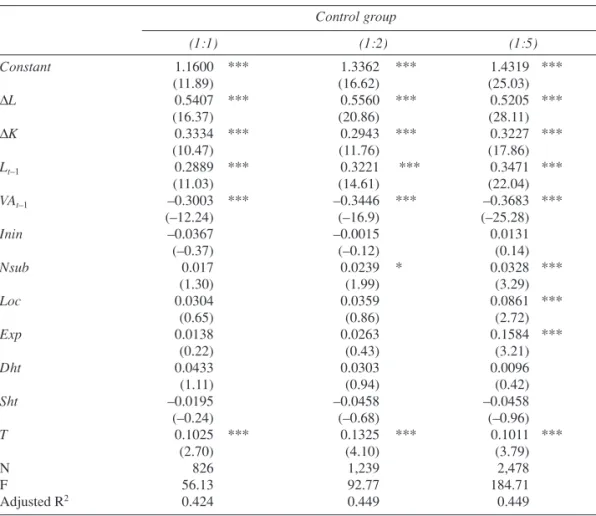
(17) 06 Duch. 19/11/09. 12:26. Página 159. Evaluating the impact of public subsidies on a firm’s performance: a two-stage... 159. neighbour matching parameters are not statistically significant, but with other estimators the parameters present a variation ranging from 3.5% in the case of the Kernel estimator and 5.7% when the stratification estimator is used in SP1 (table A.1) and 2.5% and 4.4% respectively in SP2 (table A.2). Moreover, we always find the radius estimator lies somewhere between these two extremes. To sum up, the empirical evidence shows that the subsidies granted by the regional agency have a positive effect on the value added growth rate of the firms that receive them. 6.3. The impact of public subsidies on value added growth: the second-stage The ATT results of the previous section show that, on average, firms that receive subsidies show a faster value added growth rate. To what extent is this result robust? In this section, we perform a new matching exercise in order to construct additional control groups and rely on classic regression techniques that allow a wide set of covariates to be taken into account, as suggested by Ho et al. (2007). We proceed by first separating firms by sector and then, to construct the control group, we match up the most similar firms within each sector according to the PS. We perform this matching on three levels: i) 1:1 matching: we match a firm receiving a subsidy with the most similar firm from the same sector according to the PS. ii) 1:2 matching: for each treated firm we identify the two most similar firms in the same sector. iii) 1:5 matching: we identify five control firms for each treated unit, always selecting from the same sector of activity. We construct these three different control groups in order to determine the threshold of similarity between treated and non-treated units. The hypothesis we formulate is that if there is no average treatment effect differential between the treated unit and its most equal control group (that is, with a 1:1 matching), then both groups are so similar that non-treated firms will probably have an equal performance to treated firms17. This holds, however, only in the event of a significant average effect differential with the larger control groups (that is, with a 1:5 matching). If there are no average effect differentials of public subsidies between the treated group and the control group on the 1:5 level, then public programs to promote a firms’ competitiveness could be seen as ineffective. As table 4 shows, we observe that the change in the number of employees (ΔL), the change in the capital stock (ΔK), along with the value added (VAt-1) and the number of employees (Lt-1) both for the initial year are highly significant. The variables that capture the variation in the quantities of the productive factors (K and L) are positively related to the value added growth rate of firms. In addition, as we successively use control groups containing more firms, the estimated parameters remain constant as the number of observations increases. 17. It could be that non-treated firms carry out R&D projects (similar to those publicly financed to treated firms) financed by private sources in order to maintain their competitiveness..
(18) 06 Duch. 19/11/09. 160. 12:26. Página 160. Duch, N., Montolio, D. and Mediavilla, M.. Our results show that firms with a higher number of employees in the initial period and firms with a lower value added in the initial period grew rapidly. This result points towards the idea that once firms have reached a certain level of value added, it is more difficult to find mechanisms which allow high growth rates to be maintained. When using all three control group sizes, we obtain a significant effect for the variable that indicates whether a firm receives a public subsidy or not (T). This result is highly robust in the three sets of estimations presented. When we consider a narrow control group, in which each firm is matched to its most similar control, public subsidies are significant with an elasticity of around 10%. When we expand the control group to consider more than one match per firm, 1:2 and 1:5 respectively, we find that public subsidies are statistically significant and that they have a positive impact on the determination of differential growth in value added for recipient firms in the period under analysis. Table 4.. Impact of public subsidies on value added growth Control group (1:1). Constant ΔL ΔK Lt–1 VAt–1 Inin Nsub Loc Exp Dht Sht T N F Adjusted R2. 1.1600 (11.89) 0.5407 (16.37) 0.3334 (10.47) 0.2889 (11.03) –0.3003 (–12.24) –0.0367 (–0.37) 0.017 (1.30) 0.0304 (0.65) 0.0138 (0.22) 0.0433 (1.11) –0.0195 (–0.24) 0.1025 (2.70) 826 56.13 0.424. (1:2) *** *** *** *** ***. ***. 1.3362 (16.62) 0.5560 (20.86) 0.2943 (11.76) 0.3221 (14.61) –0.3446 (–16.9) –0.0015 (–0.12) 0.0239 (1.99) 0.0359 (0.86) 0.0263 (0.43) 0.0303 (0.94) –0.0458 (–0.68) 0.1325 (4.10) 1,239 92.77 0.449. (1:5) *** *** *** *** ***. *. ***. 1.4319 (25.03) 0.5205 (28.11) 0.3227 (17.86) 0.3471 (22.04) –0.3683 (–25.28) 0.0131 (0.14) 0.0328 (3.29) 0.0861 (2.72) 0.1584 (3.21) 0.0096 (0.42) –0.0458 (–0.96) 0.1011 (3.79) 2,478 184.71 0.449. *** *** *** *** ***. *** *** ***. ***. Note: t–statistic in parentheses. *, * * and *** indicate statistical significance at 90, 95 and 99 percent levels, respectively. The dependent variable is value added growth between 2000 and 2002. Estimates carried out by means of ordinary least squares. Inin is 0 if the companies have one or more shareholders with more than 25% of the shares. Loc is 0 if the company is located outside the municipality of Barcelona. Exp is 0 if the company does not export. Dht is 0 if the company is not part of a high technology manufacturing sector. Sht is 0 if the company is not part of a high technology services sector. T is a dummy variable that takes the value 0 if the firm did not receive a subsidy..
(19) 06 Duch. 19/11/09. 12:26. Página 161. Evaluating the impact of public subsidies on a firm’s performance: a two-stage... 161. The results presented in table 4 show that, in general, neither the characteristics of a firm nor its market-related variables are significant when explaining value added growth for the 1:1 and 1:2 control groups18. Only when the control group is increased to a 1:5 relationship do these variables appear significant. The variables concerned are, specifically, the number of subsidiaries (Nsub), defined as a measure of differentiation, which indicates that diversified firms grow faster, location (Loc) which shows that firms in the municipality of Barcelona also grow faster and, finally, the exports variable (Exp) which indicates that exporting firms also have higher growth rates for value added. Finally, it is worth noting that the dummy variables controlling for high technology manufacturing and knowledge intensive services are not significant, indicating that there is no differential growth rates for these two groups of firms. Public subsidies, therefore, can be seen to have a positive and significant impact on the value added growth of the firms that receive them. Given that the objective of subsidies is the promotion of quality, R&D activities, managerial information services and the strengthening of managerial cooperation between firms as a mechanism for the enhancement of their competitiveness and, hence, market positioning and results, we can verify that the firms which receive a subsidy become more dynamic. This is something which becomes apparent when their growth differential is compared with firms which did not receive a subsidy. Our results are in line with those of Turok (1997) who detects a significant impact of structural funds on SMEs employment and turnover in Scotland and opposed to those of Lambrecht and Pirnay (2005) who do not find any relevant effect of subsidized private external advisors to SMEs on job creation, turnover or financial indicators in the Walloon region of Belgium. Nevertheless, these results should be interpreted with care given that the link between R&D subsidies and value added growth is not always clear. In other words, even if it seems reasonable to assume that a firm that is granted a subsidy to pursue a specific innovation project can improve its competitiveness and, hence, could be generating more value added, there might be other explanations that we cannot control for. For instance, a treated firm could simultaneously be receiving public money from the national agency or even EU-level funds or could be cooperating with other firms or technological centres, thus hiding the real effect of the regional subsidy. In addition, firms can be strengthening their competitive position by means of strategies that are not technological activities.. 7.. Conclusions. In this paper, we carry out a two-stage quasi-experimental procedure to evaluate the impact of regional public subsidies for R&D. Firstly, the quasi-experiment performed allows us to gain external validity for the results obtained (they can be generalized). Secondly, the two-stage approach helps to increase the internal validity of the estimations (to overcome some of the drawbacks of matching techniques). 18. The only exception is the number of subsidies in the regression with the 1:2 control group, which is significant at a 10% level of confidence and shows a positive sign..
(20) 06 Duch. 19/11/09. 162. 12:26. Página 162. Duch, N., Montolio, D. and Mediavilla, M.. An important element of such an evaluation exercise is that it fulfils the requirements necessary for a counterfactual design based on the construction of a control group which makes the accurate measurement of the effects of such subsidies possible. To do this the Propensity Score Matching methodology is used to build up a control group comprised of firms which do not receive a subsidy, but which can be considered as the closest matches to their treated, or recipient, counterparts. This method allows us to evaluate the impact of public subsidies through the Average Treatment of the Treated. The propensity scores obtained here indicate that variables such as age, sector (especially high-tech), property structure, and the export activity of firms positively affect a firm’s propensity to receive a public subsidy, and that the results seem to be robust to different specifications. Using the propensity scores in an initial attempt to estimate the effects of public subsidies, we find that, on average, the firms which received a subsidy in the year 2000 recorded a higher growth rate of value added during the period 2000-2002. Furthermore, in a second step, we estimate a production function at the firm level for the treatment and control groups (the latter we create with the estimated PS), and find that the public subsidies seem to have a positive impact on the growth rate of the value added for recipient firms. This positive and significant impact, bearing in mind the construction of the control groups, seems to suggest that the results are robust and that, indeed, public subsidies promote growth differentials between treated and nontreated firms. These conclusions must be framed within a comprehensive evaluation of the subsidies for the promotion of local firms. Although the rigorous approach which we present here yields credible estimates of program impacts, in the absence of random experiments, causality can always be called into question, particularly given potential selection bias. While the construction of the control group and the specification of the model that we use in this evaluation helps to minimize potential bias, future efforts need to address this problem more exhaustively. The explicit modelling of the selection process using longitudinal data awaits further attempts by those interested in measuring the impact of public subsidy programs. Acknowledgments. We would like to thank Juan Manuel Espino for his research assistance during the preparation of this paper. Moreover, we gratefully acknowledge comments by José García-Quevedo, Paolo Buonanno, the staff at CIDEM and all the participants at the XIII Encuentros de Economía Pública (Almería, 2006), the XXII Jornadas de Economía Industrial (Barcelona, 2006) and the European Association for Research in Industrial Economics (Amsterdam, 2006). Any errors or omissions, however, are the sole responsibility of the authors. Néstor Duch and Daniel Montolio also acknowledge financial support from 2005SGR00285 (Generalitat de Catalunya) research program..
(21) 06 Duch. 19/11/09. 12:26. Página 163. Evaluating the impact of public subsidies on a firm’s performance: a two-stage... 163. 8.. References. Acs, Z. (2000): Regional Innovation, Knowledge and Global Change, Pinter, London. Almus, M. and Czarnitzki, D. (2003): “The effects of public R&D subsidies on firms’ innovation activities: the case of Eastern Germany”, Journal of Business & Economic Statistics, 21:226-236. Arvanitis, S., Hollenstein, H. and Lenz, S. (2002): “The effectiveness of government promotion of advanced manufacturing technologies (ATM): An economic analysis based on Swiss micro data”, Small Business Economics, 19 (4): 321-340. Audretsch, D. and Feldman, M. (1996): “Innovative clusters and the industry life cycle”, Review of Industrial Organisation, 11: 253–273. Baldwin R. and Martin, P. (2006): “Coordination of industrial policy in the European Union”. EIB Papers, 11 (1): 134-157. Becker, S.O. and Ichino, A. (2002): “The estimation of average treatment effects based on propensity score”, The Stata Journal, 2 (4): 358-377. Blanes, J.V. and Busom, I. (2004): “Who participates in R&D subsidy programs? The case of Spanish manufacturing firms”, Research Policy, 33 (10):1479-1476. Busom, I. (2000): “An Empirical Evaluation of the Effects of R&D Subsidies”, Economics of Innovation and New Technology, 9 (2): 111-148. Callejón, M. and García-Quevedo, J. (2000): “Economía y política del cambio tecnológico en la industria de Cataluña”, Economía Industrial, 335-336:193-206. Cameron, A. C. and Trivedi, P. K. (2005): Microeconometrics. Methods and Applications. Cambridge University Press. Cambridge, UK. Cooke, P., Boekholt, P. and Tödtling, F. (2000): The Governance of Innovation in Europe, Pinter, London. Czarnitzki, D. and Fier, A. (2002): “Do innovation subsidies crowd out private investment? Evidence from the German service sector”, Applied Economics Quarterly, 48 (1):1-25. David, P.A., Hall, B.H. and Toole, A.A. (2000): “Is public R&D a complement or substitute for private R&D? A review of the econometric evidence”, Research Policy, 29 (4/5):1459-1476. Dehejia, R.H. and Wahba, S. (1999): “Causal Effects in Nonexperimental Studies: Reevaluating the Evaluation of Training Programs”, Journal of the American Statistical Association, 94 (448): 1053-1062. Dehejia, R.H. and Wahba, S. (2002): “Propensity Score-Matching Methods for Nonexperimental Causal Studies”, Review of Economics and Statistics, 84 (1):151-161. Duguet, E. (2004): “Are R&D Subsidies a Substitute or a Complement to Privately Funded R&D? An Econometric Analysis at the Firm Level”, Revue d’Economie Politique, 114 (2):245-274. Feldman, M. and Audretsch, D. (1999): “Innovation in cities: science-based diversity, specialization and localized competition”, European Economic Review, 43:409-429. Fernández, E., Junquera, B. and Vázquez, C. (1996): “The government support for R&D: The Spanish case”, Technovation, 16 (2):59-65. Fornahl, D. and Brenner, T. (2003): Cooperation, Networks and Institutions in Regional Innovation Systems, Edward Elgar, Cheltenham Glos, UK. Fritsch, M. and Stephan, A. (2005): “Regionalization of innovation policy – Introduction to the special issue”, Research Policy, 34 (8):1123-1127. Gallini, N. and Wright, B. (1990): “Technology transfer under asymmetric information”, RAND Journal of Economics, 21 (1):147-160. García, J. and Afcha, S. (2009): “El impacto del apoyo público a la I+D empresarial: Un análisis comparativo entre las subvenciones estatales y regionales”. Investigaciones Regionales, 15:277-294. Greene, W.H. (2003): Econometric Analysis, 5th Edition, Prentice Hall, Upper Saddler River, New Jersey. Hall, B. (1993): “R&D tax policy during the eighties: success or failure?”, Tax Policy and the Economy, 7:1-36. Hall, B.H. and van Reenen, J. (2000): “How effective are fiscal incentives for R&D? A review of the evidence”, Research Policy, 29 (4/5):449-469. Heijs, J. (1999): “La difusión de los créditos del CDTI en el País Vasco y Navarra”, Ekonomiaz-Revista Vasca de Economía, 44: 278-301..
(22) 06 Duch. 19/11/09. 164. 12:26. Página 164. Duch, N., Montolio, D. and Mediavilla, M.. Heijs, J. (2001): Política tecnológica e innovación; evaluación de la financiación pública de I+D, Consejo Económico Social, Colección de Estudios. Madrid. Herrera, L. and Heijs, J. (2007): “Difusión y adicionalidad de las ayudas públicas a la innovación”, Revista de Economía Aplicada, 15 (44):117-197. Herrera L. and M. Nieto (2008): “The national innovation policy effect according to firm location”, Technovation, 28 (8):540-550. Klette, T.J., Moen, J. and Griliches, Z. (2000): “Do subsidies to commercial R&D reduce market failures? Microeconometric evaluation studies”, Research Policy, 29 (4/5):471-495. Lalonde, R.J. (1986): “Evaluating the Econometric Evaluations of Training Programs with Experimental Data”, American Economic Review, 76 (4):604-620. Lambrecht, J. and Pirnay, F. (2005): “An evaluation of public support measures for private external consultancies to SMEs in the Walloon Region of Belgium”, Entrepreneurship & Regional Development, 17 (2):89-108. Lenihan, H. (1999): “An evaluation of a regional development agency’s grants in terms of deadweight and displacement”, Environment and Planning C: Government and Policy, 17 (3):303-318. Lenihan, H. (2004): “Evaluating Irish industrial policy in terms of deadweight and displacement: a quantitative methodological approach”, Applied Economics, 36 (3):229-252. Lenihan, H. and Hart, M. (2004): “The use of counterfactual scenarios as a means to assess policy deadweight: an Irish case study”, Environment and Planning C: Government and Policy, 22 (6):817-839. Lerner, J. (1999): “The government as venture capitalist: The long-run impact of the SBIR program”, Journal of Business, 72 (3):285-318. Matutes, C., Regibeau, P. and Rockett, K. (1996): “Optimal patent design and the diffusion of innovations”, RAND Journal of Economics, 27 (1):60-83. Mohnen, P. (2000): R&D tax incentives: issues and evidence. In: Neven, D and Roller, L. H. (Eds.), The political economy of industrial policy in Europe and the Member States (pp. 183-199). Sigma, Berlin. Nauwelaers, C. and Wintjes, R. (2008): Innovation policy, innovation in policy: policy learning within and across systems and clusters. In: Nauwelaers, C. and Wintjes, R. (Eds), Innovation Policy in Europe. Measurement and Strategy (pp. 225-269). Edward Elgar, Cheltenham Glos, UK. Nordhaus, W. D. (1969): Invention, Growth and Welfare: A Theoretical Treatment of Technological Change, Cambridge, Mass. Paci, R. and Usai, S. (2000): “Technological enclaves and industrial districts: an analysis of the regional distribution of innovative activity in Europe”, Regional Studies, 34 (2):97-114. Roper, S., Hewitt-Dundas, N. and Love, J.H. (2004): “An ex ante evaluation framework for the regional benefits of publicly supported R&D projects”, Research Policy, 33 (3):487-509. Rosenbaum, P. and Rubin, D.B. (1983): “The Central Role of the Propensity Score in Observational Studies for Causal Effects”, Biometrica, 70 (1):41-55. Rubin, D.B. (1977) “Assignment to treatment group on the basis of covariate”, Journal of Educational Statistics, 2 (1): 1-26. Smith, J.A. and Todd, P.E. (2005): “Does Matching Overcome LaLonde’s Critique of Nonexperimental Estimators?”, Journal of Econometrics, 125:305-353. Socorro, M. P. (2007): “Optimal technology policy under asymmetric information in a research joint venture”, Journal of Economic Behaviour and Organization, 62 (1):76-97. Storper, M. (1995): “The resurgence of regional economies, ten years later: The region as a nexus of untraded interdependencies”, European Urban and Regional Studies, 2 (3):191-221. Tödtling, F. and Trippl, M. (2005): “One size fits all? Towards a differentiated regional innovation policy approach”, Research Policy, 34 (8):1203-1219. Turok, I. (1997): “Evaluating European support for business development: evidence from the structural funds in Scotland”, Entrepreneurship & Regional Development, 9 (4): 335-352. Wallsten, S. (2000): “The effects of government-industry R&D programs on private R&D: the case of the Small Business Innovation Research program”, RAND Journal of Economics, 13 (1): 82–100..
(23) 06 Duch. 19/11/09. 12:26. Página 165. Evaluating the impact of public subsidies on a firm’s performance: a two-stage... 165. Appendix Table A.1.. Summary of statistics. Treated test L (employees) K (1000’s €) M (1000’s €) Dht (dummy) Sht (dummy) Years (number) Loc (dummy) Inin (dummy) Nsub (number) Solv (ratio) Exp (dummy) Imp (dummy) Creq (ratio) N. * * *. * * *. *. Mean 25.6 3,759.2 2,353.5 0.2 0.0 19.0 0.2 0.0 0.4 30.3 0.1 0.1 44.8. Std. Dev. 36.7 6,252.2 4,209.7 0.4 0.2 10.9 0.4 0.2 1.6 22.8 0.3 0.3 127.8. Non-treated. Min. Max. Mean. 1 465 72.4 57,809.1 0 43,262.7 0 1 0 1 5 71 0 1 0 1 0 17 –130.6 90 0 1 0 1 –93.4 952 421. Std. Dev.. Min. Max. 29.6 169.8 1 15.003 6,499.8 10,8470.3 3.3 11,400,000 3,317.8 45,873.1 0 5,024,350 0.1 0.3 0 1 0.0 0.1 0 1 16.3 10.2 5 107 0.1 0.4 0 1 0.0 0.1 0 1 0.3 2.3 0 226 28.9 32.1 –948.8 100 0.1 0.2 0 1 0.1 0.3 0 1 45.9 134.8 -99.9 996 32,011. * Indicates that the mean of the treated and non-treated group are not statistically different at a 99% level of significance (performed with a t-test for the continuous variables and with a z-test for the dummy variables).. Table A.2.. Average effect of subsidies on firm’s performance for SP1 t-statistic. ATT A NNM (1) NNM (2) Radius Stratification Kernel. 0.011 0.002 0.045 0.057 0.035. Firms B. 0.446 0.070 2.388*** -. 0.434 0.081 2.297*** 2.527*** 1.946**. T 421 421 420 421 421. C 420 420 11,089 31,309 31,309. A – t-statistic (analytic); B – t-statistic (bootstrapping ); T – Number of Treated firms; C – Number of Control firms; (1) Nearest neighbor with random selection; (2) Nearest neighbor with identical weights. *, * * and *** indicate statistical significance at 90, 95 and 99 percent levels, respectively.. Table A.3.. Average effect of subsidies on firm’s performance for SP2 t-statistic. ATT A NNM (1) NNM (2) Radius Stratification Kernel. –0.007 –0.005 0.034 0.044 0.025. –0.257 –0.196 1.695* 2.346*** -. Firms B. T. –0.274 –0.230 1.907** 2.137*** 1.344. 417 417 415 417 417. C 417 417 11,237 30,704 30,704. A – t-statistic (analytic); B – t-statistic (bootstrapping ); T – Number of Treated firms; C – Number of Control firms; (1) Nearest neighbor with random selection; (2) Nearest neighbor with identical weights. *, * * and *** indicate statistical significance at 90, 95 and 99 percent levels, respectively..
(24) 06 Duch. 19/11/09. 12:26. Página 166.
(25)
Figure


+2
Documento similar
MD simulations in this and previous work has allowed us to propose a relation between the nature of the interactions at the interface and the observed properties of nanofluids:
The expansionary monetary policy measures have had a negative impact on net interest margins both via the reduction in interest rates and –less powerfully- the flattening of the
rous artworks, such as sonorou s poetry; d) instances of nOlHu1islie music, such as sonorous activiti es with soc ial, bu t not necessarily aes thetic, funct ions. Lango
On the other hand at Alalakh Level VII and at Mari, which are the sites in the Semitic world with the closest affinities to Minoan Crete, the language used was Old Babylonian,
Illustration 69 – Daily burger social media advertising Source: Own elaboration based
The following figures show the evolution along more than half a solar cycle of the AR faculae and network contrast dependence on both µ and the measured magnetic signal, B/µ,
In the previous sections we have shown how astronomical alignments and solar hierophanies – with a common interest in the solstices − were substantiated in the
What is perhaps most striking from a historical point of view is the university’s lengthy history as an exclusively male community.. The question of gender obviously has a major role
