1 1
AEROSOL PROPERTIES OF MINERAL DUST AND ITS MIXTURES IN A REGIONAL 2
BACKGROUND OF NORTH-CENTRAL IBERIAN PENINSULA 3
4
M. A. Burgos, D. Mateos, V. E. Cachorro*, C. Toledano, A. M. de Frutos 5
Grupo de Óptica Atmosférica, Universidad de Valladolid, Paseo Belén 7, CP 47011, Valladolid, Spain 6
* Corresponding author: [email protected] 7
Abstract (300 words) 8
To broaden the knowledge about desert dust (DD) aerosols in western Mediterranean Basin, their 9
fingerprints on optical and microphysical properties are analyzed during DD episodes in the north-10
central plateau of the Iberian Peninsula between 2003 and 2014. Aerosol columnar properties obtained 11
from the AErosol RObotic NETwork (AERONET), such as aerosol optical depth (AOD), Ångström 12
exponent (AE), volume particle size distribution, volume concentration (VC), sphericity, single 13
scattering albedo, among others, are analyzed in order to provide a general characterization, being some 14
of them compared to particle mass surface concentrations PM10, PM2.5, and their ratio, data obtained 15
from EMEP network. The mean intensity of DD episodes exhibits: AOD440nm = 0.27±0.12, PM10 = 16
24±18 μg/m3
, AE=0.94±0.40 and PM2.5/PM10=0.54±0.16. The AOD and PM10 annual cycles show 17
maximum intensity in March and summer and minima in winter. A customized threshold of AE=1 18
distinguishes two types of dusty days, those with a prevailing desert character and those of mixed type, 19
which is corroborated by sphericity values. Three well established intervals are obtained with the fine 20
mode volume fraction (VCF/VCT). Coarse-mode-dominated cases (VCF/VCT ≤ 0.2) present a mineral 21
dust character: e.g., particle maximum concentration about 2 μm, non-sphericity, stronger absorption 22
power at shorter wavelengths, among others. The relevance of the fine mode is noticeable in mixtures 23
with a predominance of particles about 0.2-0.3 μm radii. Conditions characterized by 24
0.2 < VCF/VCT < 0.45 and VCF/VCT ≥ 0.45 present a larger variability in all investigated aerosol 25
properties. Relationships between AOD and columnar particle volume concentration give volume 26
extinction efficiencies between 1.7 and 3.7 μm2/μm3 depending on VCF/VCT. Aerosol scale height is 27
obtained from relationships between surface and columnar concentrations displaying very large values 28
up to 10 km. The uncertainty associated with the transformation between AOD and PM10 can be 29
2 31
1. Introduction 32
Airborne dust is a key player in the atmospheric science studies since it is considered to impact 33
climate, air quality and human health by causing respiratory diseases and infections or even certain 34
epidemics; Earth’s radiative budget by scattering/absorbing solar radiation; life cloud cycle acting as 35
cloud condensation nuclei or ice nuclei; air visibility that can affect traffic or military operations; 36
different continental and maritime ecosystems by changing the provided nutrients; and the soil erosion 37
in agriculture (e.g., Horvath et al., 1998; Dubovik et al., 2002; Eck et al., 2010; Yannopoulos et al., 38
2015; Gkikas et al., 2013; Knippertz and Stuut, 2014). Mineral dust accounts for 13% of the total natural 39
emissions in the Earth’s system (e.g., Viana et al., 2014), being the Sahara and Sahel deserts the most 40
relevant natural sources of crustal aerosols in the Northern Hemisphere (Prospero et al., 2002) with 41
more than 200 Tg per year emitted to the atmosphere and transported over the Atlantic Ocean 42
(Kaufmann et al., 2005). The injection of desert dust (DD) into the atmosphere from the Sahara’s two 43
major dust sources (Bodélé depression and eastern Mauritania) by different re-suspension processes can 44
achieve high atmospheric layers, being responsible for high aerosol loads that are transported very large 45
distances, to the northern Atlantic Ocean, Caribbean Sea, Amazon Basin, Mediterranean Basin, and 46
European continent (e.g., Goudie and Middleton, 2001). 47
Focusing on the studies devoted to the analysis of DD over the Iberian Peninsula (IP), it has been 48
observed that different areas exhibit different behavior and annual cycle of DD events because of the 49
orography and the uneven synoptic conditions along the IP (Toledano et al., 2007; Obregón et al., 2015; 50
Mateos et al., 2014). The closeness of the IP to the African continent enhances the impact of these high 51
turbidity events on different aspects. For example, DD outbreaks impact on air quality by increasing 52
aerosol load, being the main responsible of the daily exceedances over 50 μg m-3 (limit established by 53
the 2008/50/EC European Directive) in the particulate matter (PM10) levels (e.g., Escudero et al., 2007; 54
Querol et al., 2014; Salvador et al., 2013, 2014). This is reinforced by long residence times of dust 55
particles in the atmosphere favored by the low precipitation levels (e.g., Escudero et al., 2005; Cabello 56
et al., 2012). Moreover, aerosol seasonal patterns are modulated by mineral dust producing two maxima 57
along the year of PM or aerosol optical depth (AOD) in certain areas of the IP (e.g., Mateos et al., 2015). 58
The DD aerosols also present influence on the radiative budget with an aerosol forcing efficiency about 59
-70 Wm-2 at the surface in south-eastern IP (Valenzuela et al., 2014). Acute effects on human health also 60
occur during DD events in Spain, accelerating cardiovascular and respiratory mortality (Pérez et al., 61
3
Different methodologies have been recently developed in order to detect and identify DD intrusions 63
by means of PMx (x refers here to the upper particle cut-off) or AOD data. Likewise, other tools are 64
used to identify DD outbreaks, such as aerosol model forecasts, air mass back trajectories, satellite 65
images, among others (e.g., Pace et al., 2006; Tafuro et al., 2006; Escudero et al., 2007; Toledano et al., 66
2007; Querol et al., 2009; Cabello et al., 2012; Pey et al., 2013; Salvador et al., 2014; and Cachorro et 67
al., 2016). All these tools can be used in very different and combined ways in order to carry out the DD 68
detection and the evaluation of its occurrence, intensity and impact, as for example over the entire 69
Mediterranean Basin. 70
An extensive work about desert dust studies has been carried out during the last years in the 71
Mediterranean area. Pace et al., (2006) and Meloni et al., (2007) obtained occurrence maxima in May 72
and July in the Lampedusa island (Central Mediterranean) using MFRSR measurements and air mass 73
backward trajectories in the DD detection. A summer maximum (June and August) is reported by 74
Toledano et al., (2007) in south-western Spain by a combination of Sun photometer data and back-75
trajectory analysis of air mass origin. Valenzuela et al., (2012) reported the maximum of annual 76
occurrence in July over south-eastern Spain by analyzing air mass back trajectories. Pey et al., (2013) 77
obtained a shifted annual maximum from April to July between eastern and western Mediterranean 78
Basin in the 2000s using PMx surface data and a combination of meteorological products, aerosol maps, 79
satellite images and air mass back-trajectories. Cachorro et al., (2016) obtained an annual cycle of dusty 80
day occurrence over north-central IP of similar characteristics to that reported by Salvador et al. (2013) 81
for Madrid area, but with lower occurrence. 82
The application of the mentioned methodologies for DD detection allows further characterization 83
studies, which are related to the evaluation of the different properties that define DD aerosols. However, 84
only some of these properties are used in the methodology of DD identification. In our case, columnar 85
AOD and Ångström exponent (AE), and surface PM10 concentration are used for detection. These 86
quantities will be characterized in the present study, together with other properties, such as volume 87
particle size distribution (VPSD), asymmetry parameter (g) or single scattering albedo (SSA). 88
Previous studies in the African surroundings have shown that mineral dust aerosols are dominated by 89
large particles beyond 0.6 μm, and they exhibit non-sphericity and a pronounced absorption in the blue 90
spectral range, among others (e.g., Dubovik et al., 2002; Eck et al., 2010; Giles et al., 2012). These are 91
however the expected properties for pure dust near the sources. The dust over our study region has 92
experienced long-range transport, with possible apportioning of other aerosol particles as well as 93
mixture with local aerosol. So it is to expect that some variability and differences with respect to pure 94
4
The aerosol characterization developed in this article is based on a DD inventory previously reported 96
by Cachorro et al. (2016). This inventory is composed by DD event days occurring in the north-central 97
area of the Iberian Peninsula between January 2003 and December 2014. The methodology behind the 98
inventory simultaneously uses columnar and surface aerosol data to identify DD events. Once the DD 99
fingerprint is recognized in one or both of these core variables, a thorough manual inspection of the data 100
is carried out together with the analysis of air mass backward trajectories, meteorological maps, satellite 101
images, and model forecasts, in order to corroborate the right classification of each DD outbreak. 102
As a natural continuation of the inventory analysis, the aim of this study is to carry out the 103
characterization of the main optical and microphysical properties during mineral dust events, for a better 104
understanding of mineral aerosol over the IP. One of the most interesting results reported by Cachorro et 105
al. (2016) is the analysis of the two sub-groups of DD aerosols, one labeled as desert (D) and the other 106
one labeled as mixed-desert (MD). These groups were discriminated by means of the Ångström 107
exponent. Such kind of study is required in those areas where aerosol mixtures play a non-negligible 108
role caused by different reasons (large distance to the sources, orography, presence of big industrial 109
cities or other aerosol types, among others) and where the DD identification is complicated since the 110
boundaries among well-known (pure) aerosol types are ambiguous. 111
A detailed analysis of the aerosol surface concentration and columnar optical and microphysical 112
properties is carried out here using EMEP (European Monitoring and Evaluation Programme) and 113
AERONET (AErosol RObotic NETwork, Holben et al., 1998) observations. These data allow the study 114
about how columnar and surface quantities are related. Relationship between different size parameters 115
are studied, like AE, effective radius (ER), the fraction of the fine mode volume concentration 116
(VCF/VCT) and surface PM2.5/PM10 ratio. Relationships between columnar volume concentrations and 117
aerosol loads by columnar AOD and surface PMx are also reported to better define their validity during 118
high turbidity dust events as one of the most relevant results. To the best of our knowledge, some of 119
these relationships are established for the first time. Finally, radiative quantities are also investigated to 120
provide a general insight about absorbing and scattering properties: sphericity fraction, single scattering 121
albedo and asymmetry factor during DD events. Hence, this is the first DD aerosol characterization 122
based on a long-term inventory with emphasis on the relationship between columnar and surface 123
properties. 124
2. Desert Dust Inventory: sites, databases and method 125
2.1. Sites and databases 126
The monitoring sites for the columnar and surface properties are placed in “Castilla y León” region, 127
5
“Meseta Central”), surrounded by three mountain systems in the north, south and east. These large 129
landforms (up to 2500 m a.s.l.) make it difficult the arrival of air masses from southern areas. The study 130
area exhibits a clean continental aerosol background, isolated from any large urban or industrial centres, 131
which implies that aerosol observations are representative of the whole region. The detection of 132
moderate or even minor DD aerosol intrusions is possible since they notably modify the background 133
properties. 134
Columnar aerosol data measured by CIMEL CE-318 (Holben et al., 1998) Sun photometers from 135
AERONET contains instantaneous values of spectral AOD (at 7 different wavelengths) and its 136
associated Ångström exponent (AE) at Palencia site (41.9º N, 4.5º W, and 750 m a.s.l.), which are 137
completed with the nearby Autilla site (41.9º N, 4.6º W, and 870 m a.s.l., 7 km away) when gaps appear 138
in the database. The Sun photometer performs direct sun measurements every 15 minutes during 139
daytime. The AOD at 440nm wavelength is selected in this study to perform the DD characterization. 140
Furthermore, the CIMEL instrument hourly measures sky radiances, both in almucantar and principal 141
plane geometries, at 440, 670, 870, and 1020 nm wavelengths. Table 1 summarizes the aerosol 142
properties used in this study. Further details about the inversion algorithm were deeply described by, 143
e.g., Dubovik et al. (2000; 2006), Holben et al., (2006), and Eck et al. (2008). All the instantaneous 144
columnar aerosol data are daily averaged in the characterization presented in this study. As can be seen 145
in Table 1, a notable reduction in the number of inversion products compared to AOD is due to the 146
fewer radiance measurement sampling and the quality constraints imposed by AERONET inversion 147
algorithm. 148
The closest site to Palencia with measurements of aerosol surface concentrations (PM10 and PM2.5) 149
belonging to EMEP network is located in Peñausende (41.28ºN, 5.87ºW, and 985 m a.s.l.). These PM10 150
and PM2.5 concentrations are obtained daily by gravimetric determinations. These are the official data 151
reported to the European Commission and their high quality is guaranteed (e.g., Pey et al., 2013). The 152
PM ratio (PM2.5 / PM10) gives also an idea of the predominance of fine (large ratio) or coarse (low ratio) 153
particle modes. 154
Apart from the conceptual differences between columnar and surface aerosol load represented by 155
AOD and PMx, there exist some significant differences in relation with the sampling of both aerosol 156
concentration measurements. The CIMEL Sun photometer measures nearly instantaneous data under 157
clear-sky conditions during daytime, whereas PMx data give surface information integrated over 24 158
hours under all sky conditions. Details and discussion about the AOD-AE and PMx measurements and 159
6
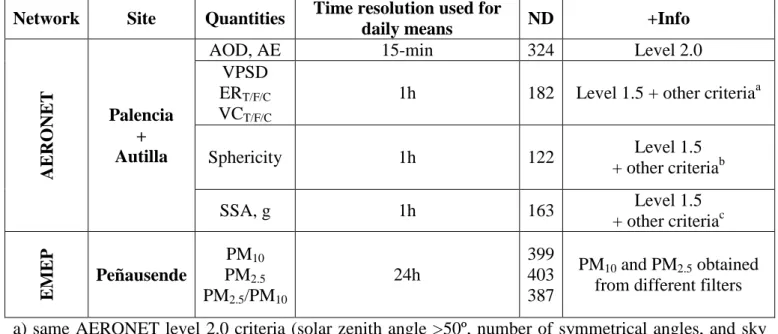
Table 1. Information on the columnar and surface quantities used in this study. ND is the number of 161
days with available data into the DD dataset (a total of 418 days in 2003-2014). 162
Network Site Quantities Time resolution used for
daily means ND +Info
AERONET
Palencia + Autilla
AOD, AE 15-min 324 Level 2.0
VPSD ERT/F/C VCT/F/C
1h 182 Level 1.5 + other criteriaa
Sphericity 1h 122 Level 1.5
+ other criteriab
SSA, g 1h 163 Level 1.5
+ other criteriac
E
M
E
P
Peñausende
PM10 PM2.5 PM2.5/PM10
24h
399 403 387
PM10 and PM2.5 obtained from different filters a) same AERONET level 2.0 criteria (solar zenith angle >50º, number of symmetrical angles, and sky 163
error between 5% and 8% depending on AOD), but there is no filter with respect to AOD; b) same 164
AERONET level 2.0 criteria but with AOD ≥ 0.2 (see Dubovik et al., 2006); c) same AERONET level 165
2.0 criteria but with AOD ≥ 0.15 (see Mallet et al., 2013; Mateos et al., 2014). 166
167
168
2.2. Methodology 169
The employed methodology for desert outbreak identification based on columnar and surface aerosol 170
data (AOD/AE/PM10) is explained in detail by Cachorro et al. (2016) and therefore only a short 171
description is provided here. A set of thresholds for AOD (440nm) and PM10 (0.18 and 13 μg m-3, 172
respectively) are selected taking into account a long-term statistical analysis. Moreover, other important 173
ancillary information is also taken into account together with aerosol information: air mass backward 174
trajectories, satellite images, meteorological maps and aerosol model forecasting, which are manually 175
analysed. Therefore this methodology does not restrict DD events identification to those days with 176
aerosol data. It is worth mentioning here that the DD inventory of dusty days is elaborated with 177
instantaneous AOD data when available while the foregoing characterization is performed on a daily 178
basis. The use of the instantaneous data allowed us to detect the sharp time when the intrusion arrives, 179
although DD conditions are attributed to that day regardless the arrival time. Therefore, for those days 180
7
to the “expected” DD aerosol properties. These “non-typical” values have been thoroughly investigated 182
in order to accurately accomplish the DD characterization. 183
The AE threshold to separate DD event days into two sub-groups is set to 1.0, since it corresponds to 184
a typical value assigned to separate fine and coarse mode predominant aerosols (e.g, Toledano et al., 185
2007; Di Biagio et al., 2010; Guirado et al., 2014). Those days with mean AE values below 1.0 are 186
noted as “D type”. However, during Saharan dust intrusions, mixing with other aerosol types can occur, 187
being DD aerosols a fraction of that mixture (with a wide range of concentrations), therefore the values 188
of the aerosol properties may not be the ones expected for pure mineral dust (e.g., Pace et al., 2006; 189
Tafuro et al., 2006; Basart et al., 2009; Eck et al., 2010). In our inventory, this category can be 190
represented by 1 < AE < 1.5 and is indicated by MD type. It must be highlighted that “mixture” 191
conditions mean the possible superposition of different aerosol layers located at different heights and 192
loaded with different aerosol types. The measurements of the aerosol optical properties of the entire 193
column take into account all such layers and, therefore, their values are not attributed to one specific 194
aerosol type. Generally, a desert dust episode is composed of D and MD event days, because the 195
majority of the detected DD episodes are of moderate intensity. The selection of criteria to differentiate 196
between fine and coarse particle predominance is not an easy task due to the strong site dependency 197
(local aerosol) and the variable characteristics of the DD events (origin and formation, the followed 198
path, among others). Therefore, many different thresholds used by different authors worldwide can be 199
found in the literature (e.g., Gkikas et al., 2016). 200
Overall, the number of DD event days is 418 for the 12-year period (2003-2014) according to the 201
inventory described by Cachorro et al., (2016), but only 304 coincident days are available for AOD and 202
PM10. Hence, the available DD database is reduced by almost 30% in the aerosol characterization study. 203
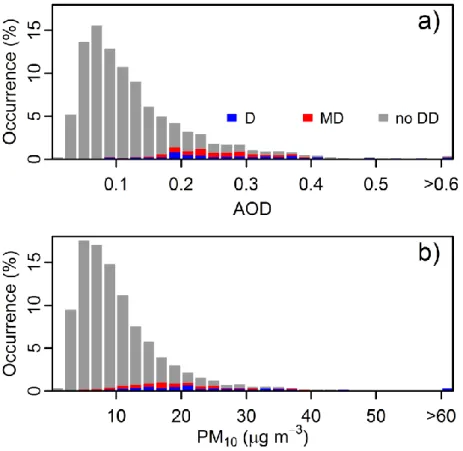
The DD database contains 162 days of D type and 142 of MD type. Figure 1 shows daily aerosol loads 204
for the two types together with the non-DD event days (a total of 2466) that comprise the whole 205
database for both AOD (Figure 1a) and PM10 (Figure 1b) during the analyzed period. As it can be seen, 206
dusty days represent ~11% of the total. DD outbreaks are responsible for 45% of the moderate and high-207
turbidity days showing AOD > 0.2. This percentage increases up to 52% for those days with PM10 > 20 208
μg m-3
. The remaining percentage can be attributed to other high-turbidity episodes such as biomass 209
burning or industrial aerosol. 210
8 212
Figure 1. Frequency histograms of AOD (a), PM10 (b) during no DD (gray), D (blue), and MD (red) 213
event days in the period 2003-2014. 214
215
216
3. Results and Discussion 217
3.1. Characteristics of AOD, PM10, AE, and PM2.5/PM10 during DD events
218
3.1.1 Frequency histograms 219
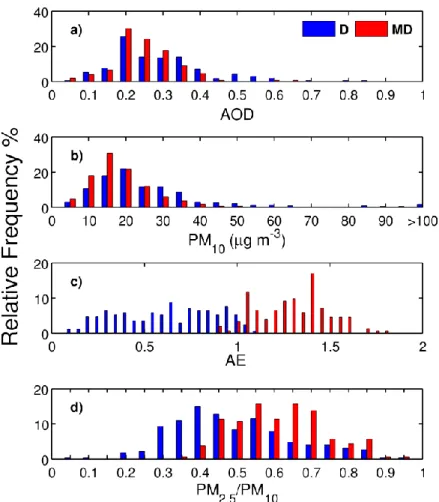
The frequency histograms of the daily values of AOD, PM10, AE, and PM2.5/PM10 for D and MD 220
event days are shown in Figure 2. Aerosol load during the DD events presents most AOD daily values in 221
the range 0.15 – 0.35 (~72%) and between 15 and 35 μg m-3 for PM10 (~60%). The occurrence 222
frequency for AOD peaks in 0.2 for both subgroups and decreases forwards. A similar behavior is 223
observed for PM10 quantity with the maximum about 15-20 μg m-3 depending on the category or 224
subgroup. The most intense events present AOD and PM10 mean values over 0.40 and 40 μg m-3, 225
respectively representing about 10% of the total dusty days. In particular, exceedances beyond 50 μg m -226
3
, threshold established by the 2008/50/EC European Directive, are achieved in 19 cases or the ~5% of 227
9 229
Figure 2. Frequency histograms of AOD (a), PM10 (b, in μg m-3), AE (c), and PM2.5/PM10 (d) during D 230
and MD event days in the period 2003-2014. 231
232
233
With respect to the aerosol size predominance, represented by the AE, Figure 2c illustrates the 234
threshold values used for the discrimination between D and MD categories. Around 76% of AE values 235
fall between 0.5 and 1.5, displaying an even distribution. The lowest AE values (<0.5), that indicates 236
strong coarse mode predominance, represent about 18% of the DD event days. 237
The PM2.5/PM10 is useful to complete the analysis since this is the only variable not (directly) used in 238
the DD identification. The PM ratio values span from 0.1 to 0.95, with most of the data concentrated in 239
the range 0.4-0.7 (~62%). The extreme categories 0-0.4 and 0.7-1.0 present similar weight (~19%). The 240
PM ratio frequencies considerably mix up D and MD categories, with a wider interval for D type. 241
Daily mean values out of the established thresholds (see Section 2) are registered due to two possible 242
situations. On one hand, daily averages are considered in the characterization meanwhile the thresholds 243
10
above). Thus, if an outbreak occurs after midday, it is possible to detect it thanks to the instantaneous 245
values in spite of the fact that the daily mean does not overcome the corresponding threshold. On the 246
other hand, the followed methodology allows identifying an outbreak when its impact is only visible at 247
high layers or only at surface level, in which case only the AOD or PM10 quantity overcomes its 248
established threshold. These cases highlight the advantage of this methodology. Overall the daily mean 249
values out of the thresholds represent the ~15% (~18%) of the total event days for AOD (PM10). 250
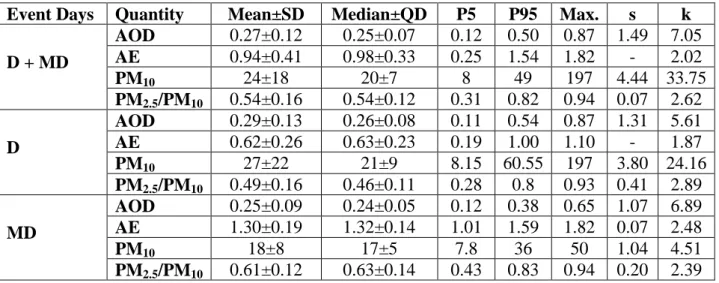
Table 2 briefly summarizes the statistics of AOD, PM10, AE, and PM2.5/PM10 quantities for desert 251
dust intrusion days. Overall, DD outbreaks showing large aerosol loads rule the mean value since this 252
statistical parameter stays above the median. However, this effect is weaker in the MD subset. The 253
differences between mean and median values are generally larger for PM10 quantity than for AOD. This 254
fact can be understood from the histograms shown in Figure 2, where surface aerosols present a wider 255
interval, achieving concentrations above 100 μg m-3. However, AE and PM2.5/PM10 present very similar 256
values of the mean and median, indicating a more even distribution of their data. The AOD, PM10, AE, 257
and PM2.5/PM10 data sets do not follow a normal distribution. The AOD and PM10 exhibit a log-normal 258
shape (O’Neill et al., 2000), whereas AE and PM2.5/PM10 frequency distributions present platykurtic 259
shapes. These behaviors are linked with the frequency histograms shown in Figure 2. The stronger loads 260
and larger particles associated to D type are corroborated by the percentile values (larger P95 of AOD 261
and PM10, and lower P5 of AE and PM2.5/PM10). 262
263
Table 2. Mean and standard deviation (SD), median and quartile deviation (QD), percentiles 5 (P5) and 264
95 (P95), maximum, skewness (s) and kurtosis (k) for AOD, PM10 (in μg m-3), AE, and PM2.5/PM10 for 265
each D, MD, and D+MD event days. 266
Event Days Quantity Mean±SD Median±QD P5 P95 Max. s k
D + MD
AOD 0.27±0.12 0.25±0.07 0.12 0.50 0.87 1.49 7.05
AE 0.94±0.41 0.98±0.33 0.25 1.54 1.82 -0.19
2.02
PM10 24±18 20±7 8 49 197 4.44 33.75
PM2.5/PM10 0.54±0.16 0.54±0.12 0.31 0.82 0.94 0.07 2.62
D
AOD 0.29±0.13 0.26±0.08 0.11 0.54 0.87 1.31 5.61
AE 0.62±0.26 0.63±0.23 0.19 1.00 1.10 -0.14
1.87
PM10 27±22 21±9 8.15 60.55 197 3.80 24.16
PM2.5/PM10 0.49±0.16 0.46±0.11 0.28 0.8 0.93 0.41 2.89
MD
AOD 0.25±0.09 0.24±0.05 0.12 0.38 0.65 1.07 6.89
AE 1.30±0.19 1.32±0.14 1.01 1.59 1.82 0.07 2.48
PM10 18±8 17±5 7.8 36 50 1.04 4.51
PM2.5/PM10 0.61±0.12 0.63±0.14 0.43 0.83 0.94 0.20 2.39
11 3.1.2 Scatter plots
268
Figure 3 shows the AE-AOD scatterplot for all daily means and dusty days including information 269
about the corresponding PM10 or PM2.5/PM10 values. In order to obtain a better visualization in Figure 270
3b, an upper threshold of 40 μg m-3 has been established for PM10 values. The right identification of DD 271
events with the employed method is corroborated in Figure 3a, in which dusty days stand out among the 272
entire dataset. The shape of this diagram for D type is similar to that reported by the analysis of DD 273
aerosols performed in previous studies about nearby areas (e.g., Toledano et al., 2007; Di Biagio et al., 274
2010; Valenzuela et al., 2012; Obregón et al., 2015). The mixing of dust with other aerosol types 275
associated to MD type put the DD intrusions of this sub-group in the unexpected area (AE >1) of this 276
kind of diagram. 277
278
279
Figure 3. AE-AOD scatterplot for all data (a) and for DD intrusions (b,c), with the corresponding daily 280
value of PM10 (b) and PM2.5/PM10 (c) in colour scale. The two types of DD intrusions are represented by 281
12
Previous studies have also stated that DD intrusions in the Mediterranean Basin can present moderate 283
AOD values associated with large AE values (e.g., Pace et al., 2006; Tafuro et al., 2006). The same has 284
been shown by Pey et al., (2013) when analyzing the intensity of DD outbreaks by PMx values for the 285
whole Mediterranean basin. In order to analyze the intensity of the DD outbreaks and following the 286
AOD criterion used by Gkikas et al. (2016), the mean plus four times standard deviation, our extreme 287
DD events are those with an AOD larger than 0.5. This extreme subset represents 16 dusty days (about 288
5% of the total DD event days). Strong episodes, determined with the AOD interval between mean plus 289
two and four times the standard deviation, range between 0.3 and 0.5. There are 85 cases (26% of days). 290
Finally, 223 days (69%) are low-moderate DD outbreaks and exhibit an AOD below 0.3. 291
The relationships among AOD, AE and surface concentrations under DD intrusions display different 292
behaviors (see Figures 3b and 3c). For the D subset, the four most intense columnar events (AOD > 0.7) 293
are linked with large surface concentrations too (PM10 > 40 μg m-3), with a predominance of the coarse 294
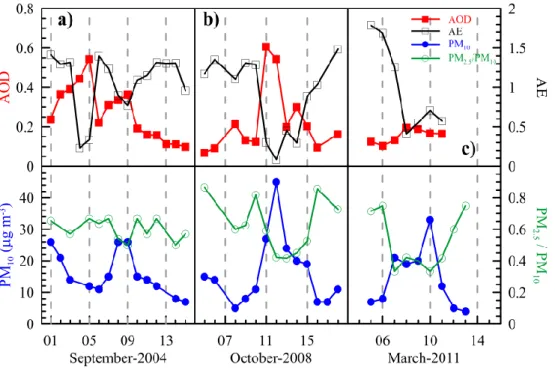
mode (PM2.5/PM10 < 0.5 and AE < 0.6). For instance, Figure 4b shows the time series of all the 295
quantities during a strong event in October 2008: AOD values about 0.6 and a maximum PM10 larger 296
than 40 μg m-3
. It is worth mentioning that during this episode, there was high temporal agreement 297
between columnar and surface aerosol load, although the PM ratio only reached values close to 0.4 298
meanwhile AE was close to zero. 299
300
301 302
Figure 4. Time series of AOD (solid squares), AE (open squares), PM10 (solid circles), and PM2.5/PM10 303
13
Overall, most of the strong and extreme DD intrusions of AOD (>0.3) also present PM10 values > 25 305
μg m-3
. However, the discrepancy between surface and columnar impact of DD aerosols frequently 306
occurs due to delays in the deposition phenomena. There are PM10 values below 15 μg m-3 and 307
PM2.5/PM10 > 0.5 with a high AOD. For instance, on September 5th, 2004 (PM10 = 12 μg m-3, AOD = 308
0.54, AE = 0.33, and PM2.5/PM10 = 0.67, see Figure 4a) is enclosed in a 10-day event (1st-10th 309
September, 2004) which represents a DD outbreak with more impact on high atmospheric levels than at 310
the surface. This DD event is also reported in south-western Spain by Prats et al. (2008) in the first 311
fortnight of September-2004. The possible delay in deposition to the ground, considering the 24h filter 312
sampling in the surface concentration, could also produce large PM10 and low PM2.5/PM10 values with 313
simultaneous weak columnar loads (AOD < 0.3) when the event is starting/finishing. 314
For the MD subset, the intensity of columnar events is in general low to moderate, with AOD values 315
<0.4, the majority of surface concentrations under 25μg m-3
and PM2.5/PM10 ranging from 0.5 to 0.7. 316
Overall, MD event days show lower PM10 and higher PM2.5/PM10 values than D type due to the 317
presence of aerosol mixtures. In particular, there is larger frequency of biomass burning or 318
anthropogenic aerosol events during summer (e.g., Mateos et al., 2015). Large variability of the PM10 319
occurs for the MD type and AOD ranges between 0.2 and 0.4. Overall, low AOD (<0.2) implies PM10 < 320
20 μg m-3 with intermediate values of the PM2.5/PM10 ratio. However, large PM10 and low PM2.5/PM10 321
values can also occur for this AOD range. For instance, a 3-day event from 8th to 10th March, 2011 (see 322
Figure 4c) represents a case with more impact at low atmospheric layers than in the column (e.g., PM10 323
= 33 μg m-3
, AOD = 0.16, AE = 0.7, and PM2.5/PM10 = 0.33 on March 3rd, 2011). The 4-day event 324
shows low AE values and AOD about 0.2 with surface concentrations ranging between 20 and 30 μg m-3 325
and PM2.5/PM10 about 0.4. 326
3.1.3. Relationships of columnar and surface quantities: PM10-AOD and PM ratio-AE
327
One important task carried out in aerosol studies in the last years has been the development of a 328
method for monitoring surface aerosol levels (generally accomplished by air quality networks) by means 329
of remote sensing data, such as the AOD data provided by satellite sensors (e.g., Liu et al., 2004; 330
Kacenelenbogen et al., 2006; Rohen et al., 2011). A theoretical background supports this analysis 331
between AOD and PM10 quantities (for further details see Bennouna et al., 2016). In the present study, 332
the AOD-PM10 and AE-PM2.5/PM10 relationships are reported in Figure S1 only for mineral dust 333
aerosols (the general comparison for the entire long-term database was presented by Bennouna et al., 334
2016). Overall the correlation or Pearson's coefficient (R) is around 0.6 for PM10 vs AOD relationship, 335
being lower (R~0.5) for PM2.5/PM10 vs AE. During DD intrusions the change of PM10 is larger than that 336
14 concentration values achieving a maximum of ~200 μg m-3
, meanwhile AOD does not reach 1.0. If the 338
total mean values in the 2003-2014 period are used as reference (PM10=10.3 μgm-3 and AOD=0.13), the 339
mentioned maxima correspond to changes around 20 and 8 times the mean values of PM10 and AOD, 340
respectively. Therefore, although the surface-columnar relationship presents limitations, there are still 341
similarities that point out the usefulness of the joint interpretation of these two quantities during high 342
turbidity events such as DD outbreaks. 343
344
345
3.2. Annual cycle of AOD, PM10, AE, and PM2.5/PM10 during DD events
346
The annual cycles for DD event days obtained for AOD, PM10, AE, and PM2.5/PM10 are shown in 347
Figure 5. Regarding AOD, Figure 5a illustrates the intensity of the dusty days (D + MD curve). 348
Maximum values about 0.32 appear in March and the summer months of July and August, local 349
minimum in May and absolute minimum during the winter months (0.15 in January). The three annual 350
cycles (D, MD, and D+MD) exhibit very similar AOD values in February, April, June and August. 351
Overall, DD intensity is governed by D type but certain differences are noticeable. The maximum in 352
March is governed by D type (reaching values up to 0.36) because MD event days have stable AOD 353
from February to April. The decrease on the DD outbreak intensity in May is observed in both subsets, 354
being more intense for the MD type. The slight AOD decrease in June in the D curve is counteracted by 355
the large increase in the MD type. In July, the D type presents a more marked maximum with a notable 356
fall in August, again, counteracted by the load increase during MD events. The behavior in September 357
and October is ruled by MD type while D is the only event type encountered in November and 358
December. To our knowledge, this study presents the first evaluation of the DD intensity monthly cycle 359
for AOD in the western Mediterranean area. The seasonal means of AOD intensity during DD outbreaks 360
over 4-year period (2003-2006) in Palencia site are studied by Basart et al., (2009) obtaining values in 361
the interval 0.23-0.33 (taking the wavelength of 670 nm). This range is proven here to be still acceptable 362
for a longer period (2003-2014) with values (at 440 nm): 0.22 (DJF), 0.28 (MAM), 0.30 (JJA), and 0.24 363
(SON). With respect to the AE, the variation of seasonal means in this study is almost negligible 364
between 0.91 (MAM) and 0.96 (DJF and JJA) with the D type exhibiting seasonal values around 0.61. 365
These figures are higher than those reported by Basart et al., (2009) around 0.45. This discrepancy can 366
be attributed to the different AE criteria used to identify dusty days, established in 0.7 (Basart et al., 367
15
Some of the main characteristics shown for AOD are similar in the PM10 annual cycle for D+MD 369
curve (see Figure 5b): maximum in March (34 μg m-3) and summer months (being in this case more 370
prominent the month of August), local minima in April and May and absolute minimum during winter 371
(16-18 μg m-3). The D+MD seasonality is only governed by the D type, reaching its absolute maximum 372
in August with almost 40 μg m-3. The MD type shows a more stable pattern throughout the year, without 373
marked changes. We have compared the magnitude of the PM10 seasonal cycle with that obtained in 374
other regions of the Iberian Peninsula by Pey et al. (2013). These authors have reported the seasonal 375
cycle intensity for the NE and SE sectors, which is quantitatively larger than our results for the north-376
central area. 377
378
379
380
Figure 5. Annual cycles of AOD (a), PM10 (b, in μg m-3), AE (c) and PM2.5/PM10 ratio (d) for the DD 381
inventory (squares) and the two subsets or categories of desert dust aerosols, D (triangles) and MD 382
(circles). 383
16 385
The value of AE parameter, linked to particle size predominance (see Figure 5c), corroborates the 386
well-known behavior mentioned above for DD intrusions by decreasing and increasing in an opposite 387
way than AOD. Thus, the AOD maximum of March becomes a minimum of AE (about 0.8) and the 388
same occurs during summer months. For D subset, the largest coarse particle predominance observed in 389
October (annual minimum of AE, ~0.45) is not linked to the most intense loads. However, the low AE 390
observed in March and July, occur with the strongest events. The MD type follows an even distribution 391
throughout the year. 392
Finally, the PM2.5/PM10 ratio (see Figure 5d) presents a strong minimum (larger concentration of 393
coarse mode) in March of ~0.5 and a weak variability in the rest of the year. A particular difference with 394
respect to AE is observed in July: the ratio values increase from June and AE decreases indicating a 395
different weight of fine/coarse particles at the surface and the entire column. The minimum of D type in 396
the AE in October is also observed in the PM2.5/PM10 ratio but this is not as pronounced as in the AE 397
(local minimum compared to September and November). There is a small difference between 398
PM2.5/PM10 values for the D and MD types. In addition, for most of the year their behaviour is similar, 399
being only remarkable the difference in August and September. 400
3.3. Characterization of columnar microphysical properties during DD events 401
3.3.1. Columnar volume particle size distribution 402
AE and PM ratio are simple derived parameters used to represent the particle size predominance. The 403
columnar microphysical properties obtained by inversion methods (Dubovik et al., 2000; 2006; Torres et 404
al., 2014) are more explicit quantities, such as the columnar volume particle size distribution and its 405
derived parameters: volume concentration, effective radius for total, fine and coarse modes, fine mode 406
volume fraction, etc. Therefore, these columnar microphysical properties have been investigated during 407
DD events in the study area. As a first step, VPSD during these outbreaks is compared to the overall 408
mean of available AERONET inversion data, in Figure 6a. The VPSD for all data exhibits a clear 409
bimodality, the fine mode peaks at 0.15 μm and the coarse mode at 2.24 μm (but with a large flat shape 410
between 1 and 3.5 μm), being the concentrations about 0.011 μm3/μm2. This feature is already reported 411
by, e.g., Prats et al., (2011) in southern Spain but only during the cold season (November through 412
February), since in the summer months the southern area has a clear coarse particle predominance. This 413
fact highlights the difference between northern and southern areas of the Iberian Peninsula with respect 414
17 416
417
Figure 6. Aerosol volume size distribution at Palencia AERONET site in 2003-2014: a) for All days 418
(solid black line), all dusty days (D+MD, lilac squares), and D (blue triangles) and MD (red circles) 419
event days; b) for the entire VF/VT range. 420
421
422
However, these characteristics are strongly modified during DD events. For the total number of DD 423
event days (D + MD curve), the increase of the coarse mode concentration is evident and presents a 424
slimmer shape compared to the former. Besides, a more prominent maximum appears about 2 μm 425
radius, which is in the size range (1-3.5 μm) reported by Ryder et al. (2013) in the Central Sahara and is 426
similar to the values reported at other sites affected by African desert dust (e.g., Cuesta et al., 2008; 427
18
it was also reported by previous studies in other Mediterranean sites (e.g. Gkikas et al., 2013). In this 429
mode, the center of the peak is also shifted to smaller radii (0.11μm). 430
Concerning the D type, the mean VPSD peaks at 1.7 μm (0.08 μm3/μm2). It is noticeable that for both 431
fine and coarse mode, the maxima are shifted to smaller radii with respect to the overall mean (black 432
line in Figure 6a). In presence of mixtures with dust (MD curve) the fine mode concentration is on 433
average higher than the coarse mode.The fine mode peaks at 0.15 μm, slightly shifted to larger radii 434
when compared to the D curve but with a similar concentration. The features presented here about 435
VPSD for DD are in line with previous studies in the Mediterranean Basin for particular or strong DD 436
episodes (e.g., Tafuro et al., 2006; Cachorro et al., 2008; Prats et al., 2008; Valenzuela et al., 2012; 437
among others). 438
Eck et al. (2010) obtained a notable dependence of VPSD curves on the fine mode volume fraction, 439
presenting large fine mode concentrations under certain mixture conditions of desert dust with biomass 440
burning at Ilorin site in Nigeria. Similar results were reported by Toledano et al. (2011) for Cape Verde 441
islands, when DD episodes occuring at different heights and mixed with biomass burning aerosols were 442
analyzed. Figure 6b shows the VPSD dependence on VCF/VCT (the ratio of volume concentration for 443
the fine mode, VCF, to the total one, VCT). The VPSD curves for the strongest coarse concentrations 444
(corresponding to VCF/VCT ≤ 0.2) present the maximum concentration at about 2 μm radii and the fine 445
mode is almost negligible. Furthermore, a small concentration increase about 0.6 μm is found, which 446
could be analogous to the third mode reported by Eck et al. (2010) and Toledano et al. (2011) for dust 447
observed nearby the Sahara desert. This third mode is an unusual characteristic in most worldwide 448
aerosol sites. Hence, DD intrusions observed in our study area with VCF/VCT ≤ 0.2 show the expected 449
characteristics for Saharan mineral dust aerosols. The feature at 0.6 μm dissapears in Figure 6b for 450
larger fine mode fractions; in contrast to the previous studies nearby Sahara, which present this extra-451
mode until intermediate fine mode fractions. In the 0.2 < VCF/VCT < 0.5 range, bimodality is evident 452
with similar concentration in the fine and coarse modes. With respect to the coarse mode, the maximum 453
concentration is shifted to larger radii between 2 and 4 μm for increasing fine mode fraction, while the 454
fine mode peaks around 0.1 μm. When the fine mode predominates (VCF/VCT > 0.5), its radius for the 455
maximum concentration is shifted to larger values, between 0.15 and 0.30 μm. 456
To understand the role played by mixtures during African dust episodes in central Iberian Peninsula, 457
Salvador et al. (2013) reported the mean source contributions to PM10 values in the Madrid region for 458
short field campaigns. Their results highlight that mineral contribution can achieve the 66% of the total 459
bulk of PM10 during dusty days for a rural environment, while the remaining ‘non-negigible’ percentage 460
19
than 25% of other sources are even present when the daily limit value of PM10 = 50 μg m-3 is overcome 462
during intense DD intrusions. 463
3.3.2. Relationships between the size and shape parameters: AE, fine mode volume fraction, 464
sphericity, and PM2.5/PM10
465
Different parameters representing the aerosol size are directly derived from the VPSD, such as the 466
effective radius or the fine mode volumen fraction (VCF/VCT). This latter quantity may be considered 467
analogous to the surface PM ratio (PM2.5/PM10). Besides, the AE obtained from the AOD spectral 468
dependence is also related to the prevailing aerosol size (Eck et al., 2008). A relevant quantity provided 469
by the AERONET inversion algorithm (Dubovik et al., 2006) is the sphericity (portion of spherical 470
particles) , ranging from 0 to 1 and thus indicating the spherical (values near 1) or non-spherical (values 471
near 0) shape of the aerosol particles. The relationships between these four quantities related to the 472
aerosol size and shape in different ways are studied in this subsection, with focus on their general 473
features as part of the aerosol characterization of mineral dust and its mixtures over our study area. 474
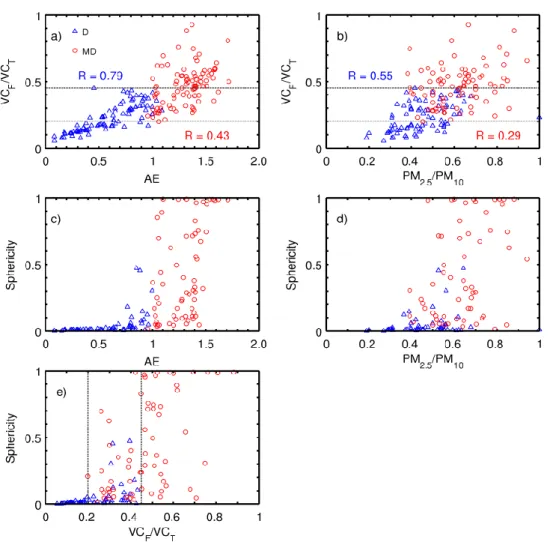
Figure 7a shows how the VCF/VCT ratio is related to the Ångström exponent, which is a more simple 475
parameter to obtain. Overall, the correlation between VCF/VCT and AE is in general poor, as obtained 476
by previous studies such as Prats et al., (2011) for “El Arenosillo” site in the south-western Iberian 477
Peninsula; Rodríguez et al., (2012) and Toledano et al., (2012) in Sub-Arctic areas. However, the 478
correlation is higher when only D-type intrusions are analyzed, with a correlation coefficient ~0.8 479
showing an almost linear dependence for AE values up to 1.0. The correlation is much lower for the MD 480
type (R~0.4) without any marked dependence. In order to extend the columnar analysis to the surface, 481
the VCF/VCT vs PM2.5/PM10 scatterplot is shown in Figure 7b. High dispersion leading to a weak 482
correlation is observed. The highest correlation is obtained for D event days with R~0.6 (~0.3 for MD 483
type). Overall, an increasing trend of PM2.5/PM10 from 0.2 to 0.9 is observed in the entire range of 484
VCF/VCT. This novel result must be highlighted because of the different techniques used to derive PM 485
ratio values and columnar inversion products. The lower sampling frequency of Sun photometer 486
inversion products (VCT, VCF and Sphericity, see Table 1) have also caused a notable reduction in the 487
number of availabe data, 182 in Figure 7a and 165 in Figure 7b, from the total of 304 with simultaneous 488
20 490
Figure 7. Scatterplots of: a) VCF/VCT vs AE, b) VCF/VCT vs PM2.5/PM10, c) Sphericity vs AE, d) 491
Sphericity vs PM2.5/PM10, and e) Sphericity vs VCF/VCT for the D (blue triangles) and MD (red circles) 492
event days. 493
494
495
A general feature can be drawn from Figures 7a-b: three zones have been identified considering the 496
type of DD intrusions falling in each one. First at all, those intrusions with a predominant coarse mode 497
(VCF/VCT ≤ 0.2) are only of D type, with AE below 0.7 and PM2.5/PM10 between 0.2 and 0.6. This 498
behavior is an indicator of strong coarse particle predominance in the atmospheric column meanwhile 499
weak mixture conditions can occur at the surface. About a quarter of all the available points fall in this 500
interval of VCF/VCT. In contrast, there is a zone where the fine mode predominates even in the presence 501
of dust (VCF/VCT ≥ 0.45, AE > 1.2 and 0.5 < PM2.5/PM10 < 1.0) being all classified as MD type. The 502
presence of mineral dust is always ensured by the analysis of the ancillary information described in 503
Section 2.2. Furthermore, the intermediate zone (0.2 < VCF/VCT < 0.45) presents both D and MD types 504
21
analyzing aerosol mixtures including mineral dust over our site. About 75% of the total DD event days 506
with columnar inversion products present mixtures in greater or lesser extent. These three established 507
zones of VCF/VCT can be considered a main feature in the study of other aerosol properties during DD 508
outbreaks. 509
The non-spherical shape of mineral dust aerosols has been extensively demonstrated (e.g., Dubovik 510
et al., 2006; Eck et al., 2005; Prats et al., 2008; Bedareva et al., 2014; Taylor et al., 2015), hence this is a 511
key parameter in the aerosol characterization studies. The AERONET retrievals of sphericity fraction 512
(e.g, Dubovik et al., 2006) are used in this section. Figures 7c-e show the sphericity vs AE, PM2.5/PM10, 513
and VCF/VCT scatterplots, respectively. Overall, the mean sphericity fraction during DD episodes is 514
0.25, being as low as 0.05 for D type and about 0.4 for MD type. As expected, most of aerosols present 515
spherical shapes (sphericity fraction values below 0.20 in the 64% of the cases), but a non-516
negligible part (16%) nearly displays a predominant spherical shape (sphericity fraction beyond 0.70). 517
For the D type, most of the sphericity fractions are below 0.20 pointing out the predominance of non-518
spherical particles, whereas sphericity in the MD type spans in the entire 0-1 interval indicating mixtures 519
of spherical and non-spherical particles in different proportions. 520
Figure 7c clearly shows two well defined areas below and above AE=1, demonstrating that aerosols 521
with AE values below 1 are very predominantly DD aerosol because of the very low sphericity fraction, 522
whereas above AE=1 we can find a mixture of particle shapes with a high variability in the sphericity 523
fractions. On the other hand, as can be seen in Figure 7d, PM ratio and sphericity do not follow any 524
correspondence, thus demonstrating the less ability of PM ratio for DD detection. 525
In terms of the VCF/VCT ranges established above, the mean sphericity fraction is about 0.01 for 526
VCF/VCT ≤ 0.2. Hence, those cases showing AE values below 0.7 and PM2.5/PM10 between 0.2 and 0.6 527
present non-sphericity, as it is typical in Saharan surroundings (e.g., Dubovik et al., 2006). For the 528
interval 0.2 < VCF/VCT < 0.45), the mean portion of spherical particles increases up to 0.17. These two 529
fractions are in line with previous studies analyzing areas with notable weight of dust particles (e.g., 530
Taylor et al., 2015). The mean sphericity values in these two first intervals of VCF/VCT (where coarse 531
mode predominates) highlight that the choice of the selected threshold of AE = 1 in order to distinguish 532
between D and MD dusty days in our study area is reliable and correct, since this quantity hardly 533
reaches values of 0.17. Finally, those cases with VCF/VCT ≥ 0.45 show a mean sphericity fraction of 534
0.56, thus indicating a minor role of mineral dust particles. 535
All the results presented in this subsection, with a wide range of AE, VCF/VCT, PM ratio, and 536
22
The large number of mixture cases is due to the low-moderate DD events registered. Besides, these 538
results again highlight that the detection of strong DD events could be affordable using AE, VCF/VCT or 539
sphericity, but bearing in mind that the amount of available columnar inversion data is much less than 540
AOD and AE observations. Hence, the most suitable quantity to carry out this task is the Ångström 541
exponent, which can present DD fingerprints even in low and moderate episodes. 542
3.3.3. Effective radius and its relation with other particle size parameters 543
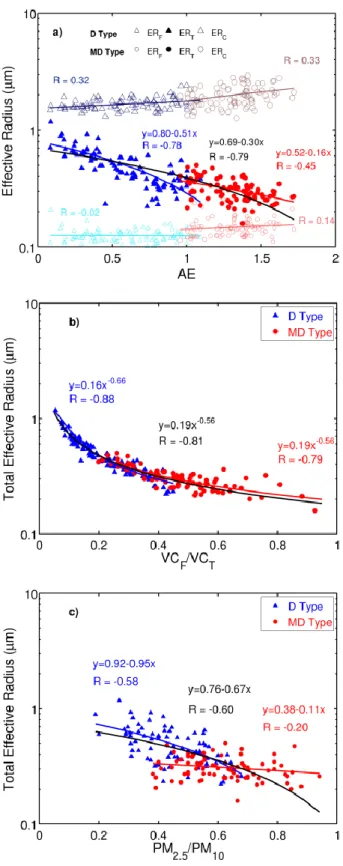
Effective radius is the most important parameter representing the size of the VPSD, thus its relation 544
with the other quantities related to the particle size is of general interest for atmospheric aerosol 545
community. Figure 8 displays the Effective Radius (ER) for the total (ERT), fine (ERF), and coarse 546
(ERC) modes vs AE, VCF/VCT, and PM2.5/PM10 size parameters. Figure 8c is the first attempt, to our 547
knowledge, of establishing a relationship between columnar microphysical and surface aerosol size 548
properties. Both ERF and ERC span in the following tight intervals: (0.1, 0.22 μm) and (1.3, 3 μm), 549
respectively. Therefore, as it can be seen in Figure 8a they are practically independent of AE, VCF/VCT 550
or PM2.5/PM10. On the contrary, ERT shows a wider range between 0.15 and 1.2 μm, and certain 551
correlation with AE, VCF/VCT or PM2.5/PM10 is to be expected in spite of the different size information 552
contained in each quantity. The correlation coefficients for our DD database are -0.8 for ERT vs AE, -0.9 553
for ERT vs VCF/VCT, and -0.6 for ERT vs PM2.5/PM10. I.e., the larger the AE or VCF/VCT or 554
PM2.5/PM10, the smaller the total effective radius. 555
The largest particles during DD outbreaks are placed in the ERT range of 0.5-1.2 μm and they 556
correspond to AE values below 0.5, VCF/VCT ≤ 0.2, and PM ratio up to ~0.5, being only D type 557
intrusions. However, there are similar PM2.5/PM10 values occurring for smaller particles (ERT of 0.2-558
0.5 μm for D and MD types), which does not happen in the AE and VCF/VCT intervals. Overall, the 559
mean ERT during all events is 0.40 μm, which increases up to 0.50 μm for D type cases and decreases 560
until 0.31 μm for MD type cases. 561
The highest correlation between AE and ERT is found for the D type with a correlation coefficient of 562
-0.78, which is also noticeable (R= -0.88) in the ERT vs VCF/VCT scatterplot and slightly lower in the 563
ERT vs PM2.5/PM10 scatterplot (R= -0.6). The scatterplots present different behaviors: ERT vs AE and 564
PM2.5/PM10 exhibit linear relationship (Figures 8a and 8c) while power functions are used to fit ERT vs 565
VCF/VCT (Figure 8b). Note that logarithmic scale is used for the y axis. With respect to MD event days, 566
high correlation (R ~ 0.8) is observed in Figure 8b in the VCF/VCT analysis, whilst AE and PM2.5/PM10 567
are almost independent on ERT (with slope of linear fits close to 0 and R below 0.5). 568
23 570
571
Figure 8. Scatterplots of: a) Effective Radius for total, coarse, and fine modes vs Ångström exponent for 572
D (blue triangles) and MD (red circles) event days; b) idem for VCF/VCT; and c) idem for PM2.5/PM10. 573
Solid lines are the fits of each analysis, being the black one the fit for the total DD database. 574
575
576
24
The analysis of dusty days allows establishing a consistent relationship between the total effective 578
radius and AE (Prats et al., 2008). The higher correlation for the ERT vs VCF/VCT study is related to the 579
fact that the both variables are retrieved in the same inversion process (e.g., Gonzi et al., 2002; Prats et 580
al., 2011; Rodríguez et al., 2012). Finally, Figure 8c shows certain correlation (R=-0.58) between the 581
total effective radius and PM ratio recorded at surface for the D type aerosol. All these features are in 582
line with previous results discussed in Figures 6 and 7. 583
584
3.3.4. Columnar volume particle concentration and its relationship with AOD and surface mass 585
concentration 586
Columnar aerosol load can also be expressed by means of the columnar volume (or mass) particle 587
concentration derived from the VPSD, where we can separate the concentration of the fine and the 588
coarse modes. Aerosol optical depth can be expressed as a function of the columnar volume (or mass) 589
particle concentration (e.g., Fraser et al., 1984; Kokhanovsky, et al., 2009), defining the columnar 590
volume efficiency factor EV. Empirical relationships between AOD and total volume particle 591
concentration (VCT) were analyzed in previous studies (Prats et al., 2011; Toledano et al., 2012). These 592
studies highlight that the relationship between these two columnar quantities represented by EV is ruled 593
by the VCF/VCT ratio. In order to empirically prove this kind of relationship for dusty days in north-594
central Iberian Peninsula, Table 3 and Figure 9 illustrate the linear relationship between different 595
columnar and surface quantities during DD events using the three intervals established in Figure 7. 596
Figure 9 is depicted as an example of visualization of this kind of scatterplots for the AOD vs VCT, 597
PM10 vs VCT, and AOD vs PM2.5 cases. Linear fits without intercept have been assumed in order to 598
avoid the lack of physical meaning for no aerosol conditions. 599
600
25 602
Figure 9. AOD vs VCT (a), PM10 vs VCT (b), and AOD vs PM2.5 (c) for three different intervals of 603
VCF/VCT during DD episodes. Linear fits are reported in Table 3. 604
605
606
For the coarse-mode-dominated cases (VCF/VCT ≤ 0.2), there is an excellent agreement between VCT 607
and AOD (Figure 9a), with R values about 0.98. The slopes of these fits are the columnar volume 608
extinction efficiencies (e.g., Toledano et al., 2012) which present units of μm2/μm3. Hence, for a given 609
AOD, the larger the slope the smaller the VCT. For strong DD outbreaks observed in south-western 610
Spain in summer 2004, Prats et al. (2011) reported a mean efficiency value of 1.8 μm2/μm3, with an 611
extreme threshold of 1.4 μm2/μm3 for coarse particles. Our columnar volume extinction efficiency for 612
this category (1.7 μm2/μm3) falls between these two values. As the fine mode gains weight, the slope 613
becomes larger, up to a value of 3.7 μm2/μm3 for VCF/VCT ≥ 0.45. This figure in is line with previous 614
results for fine particles in southern Spain (Prats et al., 2010) and Sub-Arctic areas (Toledano et al., 615
2012). The VCF/VCT governs the columnar volume extinction efficiency, related to different aerosol 616
types. Overall, the mean columnar volume extinction efficiency obtained during all dusty days is about 617
2.1 ± 0.06 μm2/μm3. 618
To correctly interpret the slope of PM10 vs VCT fit (Figure 9b and Table 3), it must be born in mind 619
that the ratio between the columnar aerosol optical depth and the horizontal extinction coefficient 620
defines the scale height H (e.g., Horvath et al., 2002), which can be understood as the height a 621
homogenous aerosol layer with given extinction coefficient would extend in order to have the given 622
optical depth. The scale height factor makes the transformation from surface to columnar quantities. 623
Besides, the slope of the fit between PM10 and VCT gives the ratio between two particle concentrations, 624
one expressed by mass and the other one by volume, thus this slope is the ratio between aerosol particle 625
density ρ (in g cm-3
26
between the surface and columnar concentration can provide an estimate of the scale height or the 627
particle density, depending on the known quantities. 628
Table 3 presents the linear fits between PM10 and VCT, PM2.5 and VCF, and PM2.5-10 and VCC. These 629
three linear fits exhibit correlations coefficients about 0.9 with the expected exceptions of the fine mode 630
fit in the VCF/VCT ≤ 0.2 category and the coarse mode fit in the VCF/VCT ≥ 0.45 one. The PM10 vs VCT 631
exhibits increasing slopes as the fine mode fraction gains weight. The opposite is observed in the PM2.5 632
vs VCF fit. The slopes of these fits in Table 3 are in g m-4 (or µg cm-4). 633
634
Table 3. Linear fits (y = b x) for three different categories of VCF/VCT ratio: c1) VCF/VCT ≤ 0.2, c2) 635
0.2 < VCF/VCT < 0.45, and c3) VCF/VCT ≥ 0.45. The ‘StE’, ‘R’, and ‘N’ are the standard error, 636
correlation coefficient and number of data, respectively. The ‘H’ column in the PMx vs VCx fits is the 637
corresponding scale height, assuming a particle density for crustal material of 2.2 g cm-3 (e.g., Sorribas 638
et al., 2015). See text for units. 639
640
Fit VCF/VCT
category b StE R N H (m) AOD vs VCT
c1 1.68 0.05 0.98 41 - c2 2.49 0.07 0.97 76 - c3 3.74 0.14 0.97 48 - PM10 vs VCT
c1 226 16 0.91 41 9725 c2 236 12 0.92 76 9329 c3 272 19 0.90 48 8080 PM2.5 vs VCF
c1 620 64 0.84 41 3546 c2 377 19 0.92 76 5843 c3 309 21 0.91 48 7117 PM2.5-10 vs VCC
c1 172 13 0.91 41 12781 c2 163 10 0.88 76 13517 c3 217 25 0.79 48 10157 AOD vs PM10
c1 0.0062 0.0005 0.89 41 - c2 0.0091 0.0005 0.92 76 - c3 0.0114 0.0008 0.90 48 - AOD vs PM2.5
c1 0.0184 0.0015 0.89 41 - c2 0.0169 0.0009 0.92 76 - c3 0.0186 0.0012 0.91 48 - 641
642
If the assumption of crustal material having a density of 2.2 g cm-3 is considered (Wagner et al., 643
2009; Sorribas et al., 2015), the scale factors H obtained with the PM10 vs VCT slope (shown in Table 3) 644
range between ~8000 and ~10000 m depending on the VCF/VCT interval. When fine particles are 645
27
density (Sorribas et al., 2015),. Finally, for the coarse particles a larger scale height H around 13000 m 647
is obtained for the categories VCF/VCT ≤ 0.2 and 0.2 < VCF/VCT < 0.45. All these large scale factors 648
indicate that a relevant portion of dust is contained in high layers with limited impact on the extinction 649
at the ground. When there is not impact of neither desert dust nor other high turbidity events, the scale 650
height H takes a mean value about 2700 m, which is in line with the results reported by Horvath et al. 651
(2002) in two sites in Spain and Austria during short campaigns, who obtained values ranging from 652
3000 to 5000 m. 653
With this information, the ratio between AOD and PM10 or PM2.5 can be understood as an efficiency 654
factor, with units of m3/g. Hence, analogously to the efficiency introduced at the surface by Waggoner et 655
al. (1981), the AOD/PM10 and AOD/PM2.5 ratios represent the mass extinction efficiency for the whole 656
atmospheric column. The slopes for AOD vs PM10 fits are strongly dependent on the VCF/VCT category, 657
meanwhile AOD vs PM2.5 presents similar slopes for the three intervals. If the AOD quantity is 658
estimated from the surface PM10 concentrations, a high dispersion is expected during DD outbreaks 659
although the right identification of the aerosol microphysical properties can help to reduce the 660
uncertainty. 661
3.4. Aerosol radiative properties during DD events 662
One of the most relevant aerosol parameter related to the aerosol absorption is the single scattering 663
albedo (SSA). In order to characterize this quantity during DD events, its spectral dependence is shown 664
in Figure 10a. The SSA values indicate a less absorbing power when mineral dust aerosols are 665
identified, since they increase compared to non-dusty days for all wavelengths. For instance, the SSA 666
values for D type increases with respect to the non-dusty conditions: from 0.89 to 0.94 at 675 nm and 667
from 0.85 to 0.94 at 1020 nm. The curve for the all the DD episodes (D+MD curve, with a mean SSA 668
about 0.92) is almost wavelength independent but still contains the fingerprint of the increasing values 669
from the UV to near-infrared (NIR) range that characterizes the mineral dust aerosol (see the D type 670
curve). The marked increase between 440 and 670 nm is found for Saharan dust (Dubovik et al., 2002; 671
Kim et al., 2011; García et al., 2008; Eck et al., 2010; Toledano et al., 2011, Giles et al., 2013, among 672
others) but also at various Spanish sites during desert dust events (Cachorro et al., 2008, 2010; 673
Valenzuela et al., 2012). The less absorbing character of DD aerosol still remains when analyzing the 674
MD type but SSA decreases with wavelength, similarly to the non-dusty days. In this case, the fine 675
mode becomes more relevant and the difference between SSA for MD and non-DD event days is weaker 676
(e.g., from 0.89 to 0.91 at 675 nm and from 0.85 to 0.89 at 1020 nm). 677
28 679
Figure 10. Spectral single scattering albedo: a) during DD and no DD episodes; b) for three different 680
intervals of VCF/VCT. 681
682
683
As it was shown by Eck et al. (2010) at Ilorin site, the SSA displays a strong dependence on the fine 684
mode volume fraction VCF/VCT, including its spectral behavior. Actually, the larger the fine mode 685
volume fraction, the smaller the differences among the spectral SSA values; i.e., there is a notable SSA 686
increase with wavelength for VCF/VCT up to about 0.5, while beyond this threshold there is no spectral 687
change. In order to corroborate this behavior in our study area, Figure 10b shows the SSA spectral 688
dependence in the three categories of VCF/VCT for the D+MD cases. Our results for VCF/VCT ≤ 0.2 689
change from SSA = 0.91 at 440 nm to SSA = 0.96 at 1020 nm, thus indicating the typical less absorbing 690
power at longer wavelengths. The SSA curve for the intermediate range (0.2 < VCF/VCT < 0.45) 691
remains even, about 0.91, meanwhile those conditions ruled by the fine mode (VCF/VCT ≥ 0.45) present 692
a SSA decrease from 0.93 at 440 nm to 0.89 at 1020 nm, pointing out most absorbing aerosols at longer 693
wavelengths. Focusing on SSA at 440 nm, very similar values are obtained for our three VCF/VCT 694
categories, which is in line with previous findings by Eck et al. (2010) for Kampur and XiangHe sites. 695
This effect suggests that there is not any change on absorption power at 440nm among all the DD 696
episodes in the inventory regardless the fine mode volume fraction. Another important intensive aerosol 697
quantity related to the scattering processes is the asymmetry factor (g) which gives information about 698
the angular distribution of the light scattered by particles and spans from 0.6 to 0.8 for most of the 699
aerosol types. Similarly to the SSA analysis, Figure 11 shows the g spectral dependence for different 700
DD intrusion types and VCF/VCT fractions. The non-dusty days are described by strong decreasing 701
wavelength dependence from 0.71 at 440 nm to 0.6 at 1020 nm. This decrease is softened for DD 702
outbreaks (with larger values for the D event days, about 0.70-0.72), because g increases with the 703