The effects of social networks
on tobacco use among high-school
adolescents in Mexico
Guadalupe Ramírez-Ortiz, D CS,(1) Ramiro Caballero-Hoyos, D CS,(2)Guadalupe Ramírez -López, D C,(3) Thomas W Valente, PhD.(4)
(1) Centro de Seguridad Social Manzanillo, Instituto Mexicano del Seguro Social. Colima, Mexico. (2) Unidad de Investigación en Epidemiología Clínica, Instituto Mexicano del Seguro Social. Colima, Mexico.
(3) Unidad de Investigación Epidemiológica y Servicios de Salud del Adolescente, Instituto Mexicano del Seguro Social. Jalisco, Mexico. (4) Department of Preventive Medicine, Keck School of Medicine, University of Southern California. USA.
Received on: September 19, 2011 • Accepted on: February 1, 2012
Corresponding author: Dra. María Guadalupe Ramírez-Ortiz. Centro de Seguridad Social Manzanillo, Instituto Mexicano del Seguro Social. Av. Tonalá 121. 45400 Tonalá, Jalisco, México.
E-mail: [email protected] Ramírez-Ortiz G, Caballero-Hoyos R,
Ramírez -López G, Valente TW. The effects of social networks on tobacco use among high-school adolescents in Mexico. Salud Publica Mex 2012;54:433-441.
Abstract
Objective. To identify the effect of centrality in social
net-work positions on tobacco-use among high-school adoles-cents in Tonala, Jalisco, Mexico. Materials and methods. Longitudinal sociometric social network data were collected among 486 high-school adolescents in 2003 and 399 in 2004. The survey included: social network components, smoking and sociodemographic characteristics. Social network mea-sures of centrality were calculated and multivariate logistic regression was used. Results. Ever used tobacco (OR= 44.98), marginalized-low stratum (OR= 2.16) and in-degree (OR=1.10) predicted tobacco use. Out-degree (OR= 0 .89) and out-in-degree (OR= 0.90) protected against tobacco use.
Conclusion. Nominating more friends rather than receiving
such nominations was protective for tobacco use. Popular students, those receiving many nominations, were at higher risk for tobacco use. Involvement of leaders with capacity to influence might be an efficient strategy for dissemination of preventive messages.
Keywords: social networks; tobacco use; adolescents; cen-trality; friendship; peer pressure
Ramírez-Ortiz G, Caballero-Hoyos R, Ramírez -López G, Valente TW.
Efectos de redes sociales sobre el uso de tabaco en adolescentes de preparatoria en México. Salud Publica Mex 2012;54:433-441.
Resumen
Objetivo. Identificar el efecto de posiciones de centralidad
de la red social sobre el uso de tabaco en adolescentes de preparatoria en Tonalá, Jalisco. Material y métodos. Estu-dio longitudinal de redes sociales sociométricas. Participaron 486 bachilleres (2003) y 399 (2004). La encuesta incluyó: componentes de redes sociales, tabaquismo y características sociodemográficas. Se calcularon medidas de centralidad de redes sociales y utilizó regresión logística multivariada.
Resultados. El consumo alguna vez de tabaco (RM= 44.98),
estrato socioeconómico marginado-bajo (RM= 2.16) y víncu-los recibidos (RM=1.10) predijeron el tabaquismo; mientras que los vínculos enviados (RM= 0.89) y la diferencia entre vínculos enviados y recibidos (RM= 0.90) protegieron contra el tabaquismo. Conclusión. Nombrar más amigos que ser nombrado por otros protegió contra el tabaquismo. Los estudiantes populares, aquellos con muchos nombramientos, tuvieron mayor riesgo de ser consumidores. La inclusión de líderes con influencia podría ser una estrategia eficiente en la diseminación de mensajes preventivos.
T
obacco use is a significant public health problem for adolescents. Among Mexican adults, tobacco use causes more than 60 000 deaths and generates multiple chronic diseases annually.1 The National AddictionsSurvey in Mexico2 showed that 8.9% of adolescents were
active smokers in 2002, and 8.8% in 2008.3 The Junior
and Senior High-School Student Survey in Mexico City reported “ever in your life” tobacco use in boys was 51.1% in 2003 and 47.6% in 2006, while prevalence for girls was 50.1% and 49.4% for the same years. Moreover, “current use” in boys fell from 23.4% in 2003 to 19.7% in 2006 and from 22.2% to 16.4% in girls.4,5
An important factor associated with adolescent’s smoking is having friends that smoke.6 To understand
factors associated with adolescent tobacco use, social-network methods were used to measure an adolescent’s position in the social network. Social network methods can be used to measure social relations and interactions that influence tobacco use.7-9 Also, it is a useful guide
for the development of interventions for prevention and treatment of addictions.10-12 The social network model
is based on relationship systems and communications. The basic data for analysis are the links between nodes (or actors). Studies of social network analysis on smok-ing have been analyzed from two perspectives: 1) social influence from others derived from group interaction13
or sociometric positions14 and 2) actor centrality.15,16
Social influence studies have repeatedly documented that being exposed to smokers increases smoking risk. In addition, studies have shown that tobacco use was higher among students having links with group members, being group members, liaisons,17,18 dyads,14
or even being isolated.13,14,19 In one notable 32-year
cohort study, smokers were increasingly moved to the periphery of the social network, whereas non-smokers moved to the center.20
Perhaps the most common indicator extracted from social network data is centrality. The term “cen-trality” is restricted to the idea of “central actor”. It indicates positions in which actors occupy a prominent place or strategic position in the network.21 Central
people may have a greater influence on the opinions and behaviors of others and at the same time may be influenced by others in the network.22 In this regard,
central people can induce the persuasive influence of other peers by signaling cultural acceptability for the behavior.10
Centrality, measured as the frequency a person was named as a peer, has been associated with sub-stance use. Valente23 reviewed studies on the effect
of school-based social networks on substance use and found that use is the result of the interaction
among peers and their degree of centrality.24 In this
interaction, peer influence24 and the normative effect
of substance-using friends and close relatives were important.25 Another network study considered two
different definitions of centrality: popularity, or the number of friendship nominations received from oth-ers (in-degree) and expansiveness, or the number of friendship nominations sent to others (out-degree).15
The study showed that popular people were more likely to be and to become smokers.16 Some studies
have found an effect of centrality measurements (in-degree, betweenness and Bonachich power centrality) on psychoactive drugs use.26
Whether the effect of centrality measurements such as out-in-degree and out-in-closeness may explain this relationship has not been evaluated. The aim of this study was to identify the effect of central positions (in- and out-degree, in- and out-closeness, out-in-degree and out-in-closeness) in social networks on current tobacco use among students of a high-school. The findings will provide information for planning strategies for the prevention of tobacco use.
Material and Methods
Study design and sample: A longitudinal study was con-ducted in order to collect sociometric social network data21 in one high-school in Tonalá, Jalisco, Mexico.
Tonalá is located in the Guadalajara metropolitan area but some semi-urban traits persist and the low-est strata of the social pyramid predominate. Tonalá High-school had a student body of 2,650 students in 2003, and 2,702 in 2004, from first to sixth semester. From June to July 2003, a total of 490 students from first and second semester were invited to participate in the study. Of them, 486 (99.2%) accepted and 399 were followed-up in 2004.
Procedures: School officials and students gave their written consent. The project was approved by the Lo-cal Health Research Committee at the Mexican Social Security Institute.
At the time frame of the study, school regulations prohibited smoking
A self-administered questionnaire was applied at baseline (June 2003) and approximately one year later (May 2004).
Social network data were collected by asking for the name and sex of each person’s six best friends in the school, and communication frequency according to the Pearson and Michell13 format. Social network indicators
included:
Density (D): number of links in the total networks, expressed as a proportion of the maximum number of possible relationships within the networks. Density formula is l/n (n-1)/2 where n is the number of nodes (students) and l the number of lines present.21
Subgroup density: proportion of connections between actors of an asymmetric valued matrix that share an attribute.27
Centrality measurements proposed by Freeman28
and Valente29 were calculated and included in-degree,
out-degree, in-closeness and out-closeness. Also, two variables of difference were generated: out-in-degree (difference between out-degree and in-degree) and
out-in-closeness (difference between out-closeness and in-closeness). Measurement’s definitions are described in Table I.
Peer pressure was defined as the subjective expe-rience of feeling encouraged by people of one’s own age to do certain things regardless of whether one wants to do them.30 The measure included 11 items
with a 5-point scale ranging from “strongly disagree” to “strongly agree”.
Socioeconomic stratum was evaluated according to Basic Geostatistical Areas
Statistical Analysis: Social network structure analysis was performed using NetMiner II 2.4.0.* Chi-square tests were calculated to evaluate prevalence changes
Undirected measurement
Degree
Is characterized as a local centrality measure because it can be calculated without reference to the overall structure of the network. Is the number of links to- and from a person. Measures communication activity.
Closeness
Measures the average distance a node is from all other nodes in the network.
Someone who is closer to everyone else, on average, is in a central position.
Measures the independency or efficiency of communication.
Directed measurement
In-degree
Number of ties a person receives. Identifies opinion leaders in social networks and popularity in friendship networks. Indicates influence as that is who might try to influence a person. Useful to measure social integration.
People with a high value can be recruited to establish a critical mass in favor of a new behavior because they are role models for many people.
Out-degree
Number of ties sent to others. Represents selection as it indicates whom they select as friends and measures a person’s socialness or sociality.
Out-in-degree*
Difference between out-degree and in-degree. A high value represents a person that has more connections to friends than receiving these connections from friends. Indicates a person who is more sociable than popular.
In-closeness
Measures the links directed to a person. Is the shortest path that friends go through to reach a specific friend. The highest value represents a person that others can reach in the fewest number of steps to him/her. People with a high value can be recruited to ensure diffusion spreads to the maximum number of people.
Out-closeness
Is the shortest path an actor goes through to reach his or her friends. The highest out-closeness is the person who can reach others in the fewest number of steps.
Out-in-closeness*
Difference between out-closeness and in-closeness. Is an actor closer to his/her friends than these are to the actor.
A high value represents a person that is closer to their friends than they with him. Table I
Centralitymeasurements
Adapted from Freeman L, 197928 & Valente TW, 201029
* Variables were generated for the present study
and logistic regression to evaluate associations. The dependent variable was current tobacco use in 2004 and the independent variables were the centrality mea-surements in 2003 (in-degree, out-degree, in-closeness, out-closeness, out-in-degree and out-in-closeness), peer pressure in 2003, ever tobacco use, occupation, age in 2003, socioeconomic stratum, and sex. A Hosmer-Lemeshow test was used to evaluate goodness-of-fit. Multicollinearity was not observed (variance inflation factor < 2.0 in both models). Statistical analyses were performed with SPSS 15.0 and Stata 9.0.
Results
At baseline (2003), 486 (of 490, 99.2%) freshmen high-school students participated in the study. The baseline refusal rate was less than 1.0%. After one-year (2004), 399 (of 486, 82.1%) students were followedup. Attrition was due to students exclusion due to failing grades or school absenteeism (78 or 89.6%), and voluntary withdrawal from school (9 or 10.3%).
There were no attrition differences by sex and socioeconomic level in the follow-up; however, greater attrition was observed in students working and study-ing (31.0%) in comparison with those that remained in the study (21.2%, p= 0.036). There was greater baseline ever tobacco use (63.5%) among those lost to follow-up than those who remained in the study (46.4%, p= 0.003). In-degree of those who withdrew from the study was lower (7.29), than among those who remained (8.60,
p= 0.025).
The mean age at baseline was 15.7 years (15-19 years), whereas for the follow-up, it was 16.6 years (15-19
Table II
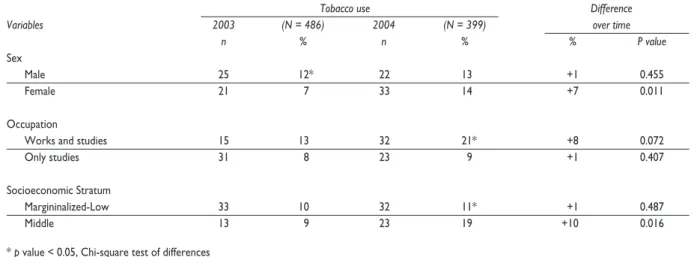
ChangeinCurrenttobaCCousebysoCio-demographiCvariables, 2003-2004
Tobacco use Difference
Variables 2003 (N = 486) 2004 (N = 399) over time
n % n % % P value
Sex
Male 25 12* 22 13 +1 0.455
Female 21 7 33 14 +7 0.011
Occupation
Works and studies 15 13 32 21* +8 0.072
Only studies 31 8 23 9 +1 0.407
Socioeconomic Stratum
Margininalized-Low 33 10 32 11* +1 0.487
Middle 13 9 23 19 +10 0.016
* p value < 0.05, Chi-square test of differences
years). The increase of students working and studying was 15.1% (p < 0.010).
Current tobacco use was 9.5% at baseline and 13.8% at follow-up, an increase of 4.3 percentage points (p=
0.029). Tobacco ever use was 49.4% at baseline, 49.9% at follow-up (0.5 percentage points increase, not statisti-cally significant).
Changes in current tobacco use by socio-demograph-ic variables during follow-up are shown in Table II.
Overall network density means increased from 0.011 + 0.14 to 0.015 + 0.16 (in 2004), indicating that 1.1% of all possible connections among network members existed during the first year, and 1.5% in the second. Table III reports sub-group density rates in 2003 and 2004 indicating that densities were greater within ho-mogeneous groups (smokers or nonsmokers only) than among heterogeneous groups (smokers-nonsmokers and nonsmokers-smokers). The differences of density among smokers and nonsmokers in both years were statistically significant.
Peer pressure was higher among smokers both years. At one year of follow-up there was a reduction of 5.37 among non-smokers (p< 0.001). Smokers had a lower out-degree in comparison with non-smokers at baseline, however at year two it was the opposite (p=
0.014) and an increase of 0.63 was found among non-smokers (p= 0.013). Smokers had a higher in-degree in comparison with non-smokers at baseline; this was the opposite in the second year (p= 0.018) with a 0.78 among non-smokers (p= 0.013).
Non-smokers had a higher out-closeness in both measurements; only in 2003 there was a difference (p
among smokers (p= 0.021). In-closeness was higher in non-smokers in both measurements with an increase of 2.46 at follow-up (p= 0.001). At baseline the out-in-degree was lower among smokers (p= 0.005). However, at follow-up it was higher, with an increase of 3.96 (p=
0.011). At both times non-smokers had higher
out-in-closeness with a reduction of 1.96 in average (p= 0.016) (Table IV).
Models of centrality positions associated with current tobacco use are shown in Table V. In the first model, in-degree, degree, in-closeness and out-closeness were evaluated. Tobacco ever use in 2003 and
Table III
tobaCCousesubgroupdensitiesbyyear
Current tobacco use
2003 (N = 486) 2004 (N = 399)
Current tobacco use No Yes P value No Yes P value
N = 440 N = 46 N = 344 N = 55
No 0.012 0.011 0.027 0.016 0.009 0.001
Yes 0.008 0.015 0.010 0.036
N: Number of nodes (students)
p value: Chi-square permutation test
Table IV
ChangeinthetimeofpeerpressureperCeptionandCentralitypositionsaCCording toCurrenttobaCCouse, 2003-2004
2003 2004 Differences
(N = 486) (N = 399) (N = 379)§
Variables c S.D. P* c S.D. P* c S.D. P‡
Social influence perception
Peer pressure Yes 29.89 5.39 0.469 26.26 8.20 0.041 -1.52 11.28 0.563
No 29.30 5.18 23.78 8.00 -5.37 9.70 0.000
Centrality positions differences
Out-degree Yes 7.74 5.06 0.264 7.72 3.66 0.014 -1.40 5.84 0.337
No 8.46 3.67 9.25 4.25 +0.63 4.51 0.013
In-degree Yes 9.68 5.65 0.074 7.55 4.19 0.018 -2.56 5.32 0.064
No 8.28 4.48 9.27 5.04 +0.78 5.66 0.013
Out-closeness Yes 6.41 3.70 0.000 7.93 4.24 0.074 +2.57 4.15 0.021
No 9.24 4.66 9.77 7.32 +0.49 7.63 0.246
In-closeness Yes 10.77 8.17 0.677 13.70 8.44 0.875 +2.19 11.38 0.438
No 11.38 9.04 13.95 11.14 +2.46 12.81 0.001
Out-in-degree Yes -1.94 4.65 0.005 0.17 3.83 0.761 +3.96 5.72 0.011
No 0.17 4.39 -0.03 4.49 -0.15 5.23 0.592
Out- in-closeness Yes -4.34 6.65 0.159 -5.78 7.97 0.353 +0.37 9.32 0.871
No -2.15 9.37 -4.18 12.08 -1.96 14.52 0.016
* Independent-samples t test
‡ Paired-samples t test according to current tobacco use category (yes/no)
in-degree were associated with current tobacco use in 2004 (OR= 42.55 and OR= 1.10, respectively). In contrast, out-degree was a protective factor for current tobacco use in 2004 (OR= 0.89). In the second model, out-in-degree and out-in-closeness were evaluated. Variables associated with tobacco use in 2004 were: tobacco ever use in 2003 (OR= 44.98), marginalized-low stratum (OR= 2.16) and out-in-degree (OR = 0.90).
Discussion
Having more nominations to peers (out-in-degree) rather than receipt of these nominations was a pro-tective factor for tobacco use. In addition, simply as naming a high number peers (out-degree) was also protective for tobacco use. On the other hand, be-ing named by peers (in-degree) was a risk factor to becoming a smoker.The protective effects of naming
Table V
faCtorsassoCiatedwithCurrenttobaCCouseatfollow-up
Prediction factors Model 1 Model 2
OR* CI 95% AOR‡ CI 95% AOR‡ CI 95%
Tobacco ever used 2003
No§ 1.00 1.00 1.00
Yes 27.49 8.42, 89.83# 42.55 9.83, 184.21# 44.98 10.43, 194.16#
Social influence perception:
Peer pressure 2003 1.01 0.95, 1.06 0.98 0.91, 1.05 0.98 0.91, 1.05
Centrality positions :
Out-degree 2003 0.94 0.86, 1.02 0.89 0.80, 0.99# – –
In-degree 2003 1.06 1.00, 1.13 1.10 1.01, 1.19# – –
Out-closeness 2003 0.88 0.88, 0.95# 0.94 0.86, 1.03 – –
In-closeness 2003 0.99 0.95, 1.03 0.99 0.95, 1.04 – –
Out-in-degree 2003 0.89 0.84, 0.97# – – 0.90 0.83, 0.97#
Out-in-closeness 2003 0.98 0.95, 1.01 – – 1.00 0.96, 1.04
Sociodemographics:
Age 2003 1.30 0.90, 1.87 1.05 0.66, 1.66 1.05 0.66, 1.66
Sex
Female§ 1.00 1.00 1.00
Male 0.95 0.54, 1.70 1.81 0.81, 4.05 2.12 0.97, 4.60
Occupation 2003
Only studies§ 1.00 1.00 1.00
Works and studies 0.68 0.35, 1.29 1.26 0.55, 2.90 1.18 0.52, 2.69
Socioeconomic Stratum
Middle§ 1.00 1.00 1.00
Marginalized-Low 1.62 0.90, 2.91 2.01 0.95, 4.25 2.16 1.04, 4.48#
Hosmer & Lemeshow Adjustment Likelihood Test c2 =7.65; p = 0.47 c2 = 9.64; p = 0.29
* OR= Crude odds ratio
peers indicates that being integrated into school-based friendship networks at this developmental stage has benefits for avoiding risky behavior. Conversely, the positive in-degree association indicates that popular students have a greater probability of becoming smok-ers. This indicates that current tobacco use is popular; therefore, widespread use is expected in this student social network in the future.
Results for out-in-degree related to tobacco con-sumption have not been reported before, and indicate that the difference between naming friends and being named may be an important indicator for social position that has an influence on risk behavior.
Our results about in-degree related to tobacco use are similar to findings reported by others.15,16 Valente
and others found that students who were popular in the sixth and seventh grades in the US had greater probability of becoming smokers than less popular ones. Moreover, popular students at schools with high tobacco-use prevalence were more at risk to smoke; this indicates that tobacco use can be attributable to the students’ position in the network structure to the extent that position indicates the person’s power and susceptibility of being influenced,15,16 or the process of
selecting peers with attributes similar to oneself.31 In
this regard, a popular person is one who receives con-nections or friendship nominations and is a vertex of high in-degree.32,33 In a cohort study, smokers moved
to the network periphery perhaps due to the advent of public health campaigns against tobacco consumption and rise in anti-tobacco norms.34 Using networks
so-ciometric positions, smoking was higher among dyads and isolates and it was lower among highercategories of popularity. Maybe, in these instances, cohesive groups applied peer pressure in the opposite direction to enforce non-smoking behavior.14
Our results about marginalized-low stratum re-lated to tobacco use are similar to others. These stud-ies demonstrated differential tobacco consumption according to socioeconomic strata, with a significant association with the consuming peer’s normative influence.35,36
Subgroup density results show that there are sub-groups of smokers and nonsmokers within the student network, allowing for the hypothesis that greater cohe-sion among current tobacco consumers over time sug-gests that dense social ties can reinforce the use norm over time.26 This hypothesis also suggests an interaction
context in which mutual influence may occur that favors
use6 leading to the formation of subcultures in which
tobacco use is a part of their identity. This may influence
adolescents in the group to have access to cigarettes, to approve use, and to have mutual emotional support, not unlike that which occurs with other substances.26,37
The subculture may also contribute to the development of other risk behaviors.38
Ever tobacco use predicted a greater risk of current tobacco use. Ever users were more likely to be lost to followup. It is possible that a higher current tobacco use in the follow-up measurement might have increased the associations we find between current tobacco use and centrality since in-degree was also associated with loss to follow-up. Current tobacco-use prevalence in this study was greater than national prevalence2,3 and less
than current-use prevalence among Mexico City high-school students4,5 which can be explained to the fact that
use is greater among youth in contexts of greater urban development.
Limitations: attrition was caused mainly by student dropouts, which was not possible to control. Also, it was not practical to follow-up adolescents who did not remain in the study, since they were no longer exposed to the student network. Attrition in the follow-up is accompanied by differences in in-degree and tobacco-ever-used participants who remained in the study and those who did not, which may cause a selection bias.39
Also, smoking, in our study, was defined as current tobacco use, while others consider it as smoking at least one cigarette every day in the past 30 days. In our case, as stated by others, we considered that any use is abuse.40
The findings of this study describe the formal stu-dent network structure that could be complemented by exploring the possible influence of networks outside the school such as the family,41,42 and neighborhood
friends.34,43,44 It would also be worthwhile to analyze the
formation of subgroups by use patterns: light smoker, moderate smoker, and heavy smoker.2
Although our results show that popular students have a higher probability of smoking, this position has been used in interventions to reduce tobacco consump-tion. Opinion leaders are selected based on in-degree position because they have a prominent position in social networks structure, and may influence towards healthy behaviors.29 In these interventions opinion
leaders are trained to direct educative interventions at the informal interactions with their peers.10-12 Also,
recently approved Mexican regulations restrict tobacco use in public places, and favor non-smoking promotion in schools, which we hope will contribute to a more effective control.
Acknowledgments
This study was supported by grant IMSS-FP-2003/148. We thank authorities, students and teachers at Tonalá High-school of University of Guadalajara.
Declaration of conflict of interests: The authors declare that they have no conflict of interests.
References
1. Kuri-Morales PA, González-Roldán FJ, Hoy MJ, Cortés-Ramírez M. Epi-demiología del tabaquismo en México. Salud Publica Mex 2006;48:91-98. 2. Secretaría de Salud. Instituto Nacional de Estadística Geografía e Informática (SS/INEGI). Encuesta Nacional de Adicciones 2002. Aguascali-entes: SS/INEGI, 2004.
3. Secretaría de Salud. Instituto Nacional de Salud Pública (SS/INSP). En-cuesta Nacional de Adicciones 2008. Cuernavaca, Morelos: SS/INSP, 2009. 4. Villatoro J, Medina-Mora ME, Fleiz C, Amador NG, Bérmdez P. La en-cuesta de estudiantes de enseñanza media y media superior de la Ciudad de México: Noviembre 2003. Prevalencias y evolución del consumo de drogas. Salud Mental 2005;28:38-51.
5. Villatoro J, Gutiérrez M, Nieves M. Encuesta de estudiantes de la Ciudad de México 2006. Prevalencias y evolución del consumo de drogas. Salud Mental 2009;32:287-297.
6. Center for Disease Control and Prevention. Youth tobacco surveil-lance United States 2000. MMWR Morb Mortal Wkly Rep 2001; 50: 1-84. 7. Hoffman BR, Sussman S, Unger JB, Valente WT. Peer Influences on Adolescent Cigarette Smoking: A Theoretical Review of the Literature. Substance Use & Misuse 2006;41:103-155.
8. Luke DA, Harris JK. Network Analysis in Public Health: History, Meth-ods, and Applications. Annu Rev Public Health 2007;28:69-93.
9. Smith KP, Cristakis NA. Social networks and health. Annu Rev Sociol 2008; 34:405-429.
10. Valente TW, Hoffman BR, Ritt-Olson A, Lichtman K, Johnson A. Effects of a social networks method for group assignment strategies on peer-led tobacco prevention programs in schools. Am J Public Health 2003;93:1837-1843.
11. Audrey S, Cordall K, Moore L, Cohen D, Campbell R. The develop-ment and impledevelop-mentation of a peer-led intervention to prevent smoking among secondary school students using their established social networks. Health Educ J 2004;63:266-284.
12. Campbell R, Starker F, Holliday J, Audrey S, Bloor M, Parry-Landgon N, et al. An informal school-based peer-led intervention for smoking prevention in adolescence (ASSIST): a cluster randomized trial. Lancet 2008;371:1595-1602.
13. Pearson M, Michelle L. Smoke rings: social networks analysis of friends groups, smoking and drug-taking. Drugs Educ Prev 2000;7:21-37. 14. Pearson M, Sweeting H, West P, Young R, Gordon J, Turner K. Ado-lescent substance use in different social and peer contexts: A social net-work analysis. Drugs: education, prevention and policy 2006;13:519-536. 15. Valente TW, Unger JB, Johnson A. Do popular student smoke? The association between popularity and smoking among middle school students. J Adolesc Health 2005;37:323-329.
16. Alexander C, Piazza M, Mekos D, Valente T. Peer, school, and adoles-cent cigarette smoking. J Adolesc Health 2001;29:23-30.
17. Fang X, Li X, Stanton B, Dong Q. Social networks position and smok-ing experimentations among Chinese adolescents. Am J Health Behav 2003;27:257-267.
18. Henry DV, Kobus K. Early adolescent social networks and substance use. J Early Adolescence 2007;23:346-362.
19. Ennett ST, Bauman KE. Peer group structure and adolescent cigarette smoking: A social networks analysis. J Health Soc Behav 1993;34:226-236. 20. Christakis NA, Fowler JH. The collective dynamics of smoking in a large social network. N Engl J Med 2008;358:2249-2258.
21. Scott J, ed. Social networks analysis. A Handbook. Second ed. Lon-don: Sage Publications, 2000.
22. Valente TW, Davis RL. Accelerating the diffusion of innovations using opinion leaders. Ann Am Acad Polit Soc Sci 1999;566:55-67.
23. Valente TW. Social networks influences on adolescent substance use: An introduction. Connections 2003;25:11-16.
24. Malcon Mc, Menezes B, Maia S, Chatkin M, Victora CG. Prevalên-cia e factore de risco para tabagismo em adolescentes na América do Soul: uma revisão sistemática da literatura. Pan Am J Public Health 2003;13:222-228.
25. Urquieta J, Hernández-Ávila M, Hernández B. El consumo de tabaco y alcohol en jóvenes de zonas urbanas marginadas de México. Un análisis de decisiones relacionadas. Salud Publica Mex 2006;48:30-40.
26. Ennett ST, Bauman KE, Hussong A, Fairs R, Foshee VA, Cai L. The peer context of adolescent substance use: Findings from social networks analysis. J Res Adolesc 2006;16:159-186.
27. McPherson M, Smith-Lovin L, Cook JM. Birds of a feather: Homophily in social networks. Annu Rev Sociol 2001;27:415-444.
28. Freeman L. Centrality in social networks. Conceptual clarification. Social Networks 1979;1:215-239.
29. Valente TW. Social networks and health: Models, methods and ap-plications. New York: Oxford University Press, 2010.
30. Santor DA, Messervey D, Kusumarca V. Measuring peer pressure, popularity, and conformity in adolescent boys and girls: predicting school performance, sexual attitudes, and substance abuse. J Youth Adolescence 2000;29:163-182.
31. Hall JA, Valente TW. Adolescent smoking networks; the effects of influ-ence and selection on future smoking. Addict Behav 2007;32:3054-3059. 32. Jansson I. Popularity structure in friendship networks. Soc Networks 1999;21:339-359.
33. Dingues MM, Oetting ER. Similarity in drug use patterns between adolescents and their friends. Adolescence 1993; 8:253-266.
36. Mathur Ch, Stigler MH, Cheryl L, Perry, Arora M, Reddy KS. Differ-ences in prevalence of tobacco use among Indian urban youth: The role of socioeconomic status. Nicotine Tob Res 2008; 10(1):109-116. 37. Pearson M, West P. Drifting smoke rings: Social networks analysis and Markov Processes in a longitudinal study of friendship groups and risk-taking. Connections 2003; 25:56-76.
38. Kelsey YL, Whittemore AS, Evens AS, Thompson WD, ed. Methods in observational epidemiology. New York: Oxford University Press, 1996. 39. Kirke DM. Chain reactions in adolescents’ cigarette, alcohol and drug use: Similarity through peer influence or the patterning of ties in peer networks? Soc Networks 2004;26:3-28.
40. Medina-Mora ME. Los conceptos de uso, abuso, dependencia y su medición. En: Tapia-Conyer R, ed. Las adicciones:dimensión, impacto y perspectivas. México: El Manual Moderno, 2001:21-44.
41. Leatherdale ST, McDonald PW, Cameron R, Brown KS. A multilevel analysis examining the relationship between social influences for smoking and smoking onset. Am J Health Behav 2005;29:520-530.
42. Kaduri P, Gilreath T, Mbwambo J, Kilonzon G, Flisher AJ, Matthews SA. Social networks’ influence on tobacco use among students in Dar Es Salaam, Tanzania. Promot Educ 2005;12:66-70.