Vaspin, resistin, retinol-binding protein-4,
interleukin-1
αα
αα
α
and interleukin-6 in patients
with nonalcoholic fatty liver disease
Stergios A. Polyzos,* Jannis Kountouras,* Vaia Polymerou,** Kassiani G. Papadimitriou,* Christos Zavos,* Panagiotis Katsinelos*
* Department of Medicine, Second Medical Clinic, Aristotle University of Thessaloniki, Ippokration Hospital, Thessaloniki, Greece. ** Biomedicine Laboratories, Athens, Greece. September-October, Vol. 15 No. 5, 2016: 705-714
INTRODUCTION
Nonalcoholic fatty liver disease (NAFLD), ranges from nonalcoholic simple steatosis (SS) to nonalcoholic steatohepatitis (NASH), NASH-related cirrhosis and hepatocellular carcinoma.1 Its distribution is global, since
NAFLD affects both developed and developing world populations, possibly due to the adoption of western life-style in the latter. Its worldwide prevalence in the general population is estimated to be 20-30% in western countries and 5-18% in Asia, and it is increasing over time.2
Adipokines, polypeptides produced by adipose tissue, af-fect hepatic and systematic metabolism.3 It seems that
adi-pokine alterations, occurring during the expansion of adipose tissue, may contribute to the development of SS and to the progression to NASH.3 Examples of adipokines
related to NAFLD are adiponectin and leptin. In two meta-analyses, adiponectin levels were shown to progressively decrease,4 whereas leptin levels to progressively increase5
in the sequence non-NAFLD controls - SS patients – NASH patients. There is limited and inconclusive evidence for other adipokines, including resistin, retinol-binding protein (RBP)-4 and vaspin, as well as conventional cy-tokines, including interleukin (IL)-1α and IL-6, partly pro-duced by immune cells infiltrating adipose tissue when it expands.3 A limitation of the most previous relevant studies
was that controls were of lower body mass index (BMI) and/or waist circumference (WC), and an adjustment for BMI or WC had been performed only in a minority of them. However, adiposity is an important confounding, when considering the interplay between adipokines/cy-tokines and NAFLD or any obesity-related disease.3
The Official Journal of the Mexican Association of Hepatology, the Latin-American Association for Study of the Liver and
the Canadian Association for the Study of the Liver
Manuscript received: Manuscript received:Manuscript received:
Manuscript received:Manuscript received: October 31, 2015. Manuscript accepted:Manuscript accepted:Manuscript accepted:Manuscript accepted:Manuscript accepted: January 16, 2016.
DOI:10.5604/16652681.1212429. A B S T R A C T A B S T R A C T A B S T R A C T A B S T R A C T A B S T R A C T
Background and rational. Background and rational.Background and rational. Background and rational.
Background and rational. Data on newer adipokines and interleukins in patients with nonalcoholic fatty liver disease (NAFLD) are inconclusive. The primary aim of this study was the evaluation of serum vaspin, resistin, retinol-binding protein (RBP)-4, inter-leukin (IL)-1α and IL-6 levels in NAFLD patients compared to matched controls, and their association with disease severity. Mate-Mate-Mate-Mate- Mate-rial and methods.
rial and methods.rial and methods. rial and methods.
rial and methods. Twenty-nine consecutively enrolled NAFLD patients with histologically confirmed nonalcoholic simple steatosis (SS; n = 15) or steatohepatitis (NASH; n = 14) and 25 matched controls without NAFLD were recruited. Serum vaspin, resistin, RBP-4, IL-1α and IL-6 and biochemical tests were measured. Results.Results.Results.Results.Results. Serum vaspin levels were lower and IL-6 levels higher in NASH patients than controls, but similar between controls and SS patients, or NASH and SS patients (vaspin, controls: 728.5 ± 39.3; SS: 634.6 ± 63.7; NASH: 531.5 ± 52.0 pg/mL; p for trend 0.028; IL-6, controls: 1.5 ± 0.2; SS: 2.5 ± 0.6; NASH: 3.0 ± 0.6 pg/mL; p for trend 0.032). However, after adjustment for body mass index or waist circumference, both vaspin and IL-6 did not re-main significantly different between groups. Resistin, RBP-4 and IL-1α were not statistically different between groups. None of the selected adipokines or interleukins could independently differentiate NAFLD from SS, or patients with more severe from less severe histological lesions. Conclusion.Conclusion.Conclusion.Conclusion.Conclusion. Lower circulating vaspin, but higher IL-6 levels were observed in NASH patients than controls, whereas resistin, RBP-4 and IL-1α levels were similar between groups. However, these differences did not remain robust after ad-justment for body mass index or waist circumference.
Key words. Key words.Key words. Key words.
The primary aim of this study was the evaluation of se-rum vaspin, resistin, RBP-4, IL-1α and IL-6 levels in pa-tients with histologically confirmed SS and NASH compared to controls of similar gender, age, BMI and WC. Secondary aims were:
• The evaluation of studied adipokines and interleukins within specific hepatic histological lesions.
• The association of the studied adipokines and inter-leukins with other metabolic and inflammatory param-eters, and liver function tests.
MATERIAL AND METHODS
This was a single-center, cross-sectional study. NAFLD patients and controls were consecutively recruit-ed on an outpatient basis between June 2008 and Novem-ber 2010 at the Second Medical Clinic (Aristotle University of Thessaloniki, Ippokration Hospital, Thessa-loniki, Greece). Determination of eligibility was based on medical history, physical examination, and liver function tests (serum aspartate transaminase [AST], alanine transaminase [ALT], gamma-glutamyl transferase [GGT], alkaline phosphatase [ALP], total and direct bilirubin) and liver ultrasound imaging performed during the screening visit. The study protocol conformed to the ethical guide-lines of the Declaration of Helsinki and was approved by the local ethics committee. All participants provided a written informed consent.
Inclusion criteria for the NAFLD patients were:
• Age > 18 years.
• Bright liver on ultrasound imaging and increased liver function tests for at least 6 months before liver biopsy. • Patient’s consent for liver biopsy.
NAFLD patients were subdivided into those with SS or NASH according to the criteria of NASH Clinical Research Network [NAFLD Activity Score (NAS)].6
Steatosis grade, fibrosis stage, lobular and portal inflam-mation, and ballooning were categorized based on the classification of NASH Clinical Research Network.6
Regarding fibrosis stage, cirrhosis (grade 4) was not included (exclusion criterion).
Individuals without NAFLD, undergoing regular check-up for professional needs at the same hospital, were recruit-ed as controls. The controls were living in the same region, and were selected to be of similar gender, age, BMI and WC with patients. Inclusion criteria for the controls were:
• Age >18 years.
• No history of abnormal liver ultrasound imaging or ab-normal liver function tests.
• Currently normal liver ultrasound imaging. • Currently normal liver function tests.
The controls were not subjected to liver biopsy, due to obvious ethical considerations.
Exclusion criteria for both NAFLD patients and con-trols, as described in details elsewhere,7 were:
• Ethanol consumption > 20 g/day. • Liver cirrhosis.
• Other liver disease (viral hepatitis, autoimmune hepa-titis, primary sclerosing cholangitis, primary biliary cirrhosis [currently termed as primary biliary cholan-gitis] and overlap syndromes, drug-induced liver disease, hemochromatosis, Wilson’s disease, α1-antit-rypsin deficiency).
• Type I diabetes mellitus. • Pancreatitis.
• Uncontrolled hypothyroidism or hyperthyroidism. • Adrenal insufficiency.
• Renal failure.
• Thrombotic disorders. • Cancer.
• Pregnancy.
• Addiction to any drug.
• Use of the following medications within a 12-month period before screening: estrogens, progestins, gluco-corticosteroids, thiazolidinediones, insulin, sibu-tramine, orlistat, rimonabant, vitamin E, vitamin C, ursodeoxycholic acid, ferrum, interferon, tamoxifene, amiodarone, biologic agents, folate or vitamin B sup-plements, antibiotic, any medication against tuberculo-sis, epilepsy or viruses, or any medication affecting hemostasis, such as antiplatelet agents, aspirin or oral anticoagulants.
• Use of intravenous glucose administration or parenter-al nutrition within a 1-month period before screening.
measured in one batch at the end of the study. hsCRP was measured with latex-enhanced immunonephelometry on a BNII analyzer (Siemens Healthcare Diagnostics, Deerfield, IL, USA). Insulin was measured with immuno-chemiluminescence on an Immulite 2500 immunoassay system (Siemens Healthcare Diagnostics, Deerfield, IL, USA). IL-6 was measured with electrochemilumines-cence on a Modular Analytics E170 (Roche Diagnostics, Basel, Switzerland; sensitivity 0.7 pg/mL). Vaspin (sensi-tivity 26 pg/mL), resistin (sensi(sensi-tivity 2 pg/mL), RBP-4 (sensitivity 0.1 ng/mL), IL-1α (sensitivity 0.2 pg/mL) were measured with enzyme-linked immunosorbent assay (ELISA; RayBiotech, Norcross, GA, USA): vaspin (intra-assay coef-ficient of variation (CV)< 10% ; inter-assay CV < 15%); re-sistin (intra-assay CV < 10%; inter-assay CV < 12%); RBP-4 (intra-assay CV < 10%; inter-assay CV < 15%); IL-1α (intra-assay CV < 10%; inter-assay CV < 12%).
BMI was calculated by the formula:
IR was quantified by homeostasis model of assessment insulin resistance (HOMA-IR) using the formula:
(AST/ALT) ratio was also calculated.
Statistical analysis
Continuous variables are presented as mean ± standard error of the mean (SEM). Categorical variables are pre-sented as frequencies. Kolmogorov-Smirnov test was used to check the normality of distributions of continuous vari-ables. χ2 test was used for between group comparisons, in
case of categorical variables. Spearman’s coefficient (rs) was used for binary correlations. In case of continuous variables, between groups comparisons were performed with independent samples T-test or Mann-Whitney test, when the compared groups were two, or one-way analysis of variance (ANOVA) or Kruskal-Wallis test, when the compared groups were more than two. In case of statisti-cally significant difference in ANOVA or Kruskal-Wallis test, Bonferroni post-hoc correction was used for multiple pairwise comparisons. Analysis of covariance (ANCOVA) was used to adjust between group comparisons for covari-ates. Multiple logistic regression analysis (method “en-ter”) was used within NAFLD patients to identify whether the studies adipokines or interleukins were inde-pendently associated with NASH (dependent variable
SS = 0 or NASH = 1) or specific histological lesions (e.g., dependent variable for steatosis grade: ≤ 33% = 0 or > 33% = 1). For the need of logistic regression anal-ysis, included variables that did not follow normal distri-bution were logarithmically transformed. Statistical analysis was performed with SPSS 21 for Macintosh (IBM Corporation, Armonk, NY, USA). Significance was set at p<0.05 (two-tailed) in all tests.
RESULTS
Comparisons between groups
Twenty-nine patients with biopsy-proven NAFLD (15 with SS and 14 with borderline or definite NASH) and 25 controls were included in this study. Serum vaspin levels were lower in NAFLD patients (n = 29) compared with the controls (586.8 ± 42.2 vs. 728.5 ± 39.3 pg/mL, respective-ly; P = 0.018) and IL-6 levels higher (2.7 ± 0.4 vs. 1.5 ± 0.2 pg/mL, respectively; P = 0.009). Resistin, RBP-4 and IL-1α levels were similar between NAFLD patients and controls.
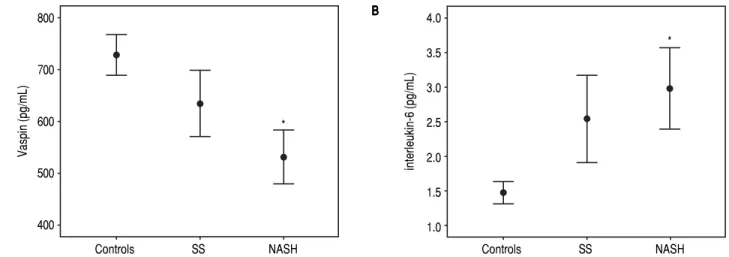
Subsequently, comparisons among controls (n = 25), SS (n = 15) and NASH (n = 14) patients were performed. Comparative data of the study groups are presented in Ta-ble 1. Sex, age, BMI and WC were similar between groups. There was a statistically significant trend towards lower vaspin levels and higher IL-6 levels, from controls to SS patients and to NASH patients (Table 1). In pair-wise comparisons, serum vaspin levels were statistically lower in NASH patients than controls (p = 0.025), but similar between SS patients and controls, or SS and NASH patients (Figure 1A). Conversely, serum IL-6 lev-els were statistically higher in NASH patients than con-trols (p = 0.046), but similar between SS patients and controls, or SS and NASH patients (Figure 1B). There was not a statistically significant trend regarding resistin, RBP-4 and IL-1α. As expected, there were statistically sig-nificant trends in ALT, AST, ALT/AST ratio, GGT, ALP, triglycerides, HDL-C, glucose, insulin and HOMA-IR between groups, with NASH generally being the group with the higher metabolic burden (Table 1). ESR was higher in NASH patients than either controls or SS pa-tients. Despite a similar trend in hsCRP, the difference did not reach the level of statistical significance.
After adjustment for BMI, both vaspin (estimated margin-al means; controls: 728.4 ± 43.3; SS: 634.6 ± 55.2; NASH: 541.0 ± 62.8 pg/mL; p = 0.057) and IL-6 (estimated marginal means; controls: 1.5 ± 0.3; SS patients: 2.5 ± 0.4; NASH pa-tients: 2.5 ± 0.5 pg/mL; p = 0.138) did not remain significantly different between groups. Non-significant comparative results between groups did not change for resistin, RBP-4 and IL-1α, after adjustment for BMI. Similar results were re-trieved after adjustment for WC instead of BMI.
HOMA-IR =
[
glucose (mmol/L) x insulin (μU/mL)22.5 BMI =[
body weight (kg)height2 (m2)Table 1. Comparative data of the study groups.
Control group SS patients NASH patients p-value Reference range
for trend*
Patients/Women (N) 25/20 15/10 14/12 0.438
-Age (years) 53.6 ± 1.8 53.9 ± 2.6 54.8 ± 1.6 0.921
-BMI (kg/m2) 30.5 ± 0.8 31.9 ± 1.3 33.9 ± 1.6 0.109 20-25
WC (cm) 99.8 ± 1.7 105.1 ± 3.3 107.3 ± 2.7 0.083 Male < 94
Female < 80
AST (U/L) 20.0 ± 0.8 27.4 ± 2.0a 41.5 ± 3.9a,b <0.001 10-31
ALT (U/L) 19.4 ± 1.7 41.7 ± 5.5 65.0 ± 15.0a <0.001 10-34
AST/ALT ratio 1.14 ± 0.06 0.76 ± 0.07a 0.79 ± 0.07a <0.001
-GGT (U/L) 19.4 ± 3.3 46.5 ± 11.7 60.9 ± 13.9a <0.001 0-38
ALP (U/L) 62.8 ± 2.8 83.8 ± 7.5a 79.0 ± 7.1 0.012 30-120
Creatinine (mg/dL) 0.90 ± 0.02 0.94 ± 0.04 0.83 ± 0.03 0.066 0.6-1.1
Triglycerides (mg/dL) 119.5 ± 11.6 162.3 ± 21.9 210.8 ± 29.3a 0.006 < 150
HDL-C (mg/dL) 58.2 ± 3.0 50.7 ± 2.8 47.2 ± 1.6a 0.022 Male > 40
Female > 50
Glucose (mg/dL) 89.0 ± 2.3 99.9 ± 7.3 110.6 ± 5.3a 0.007 60-100
Insulin (μU/mL) 5.2 ± 3.6 10.2 ± 1.8 15.1 ± 2.8a 0.002 6-27
HOMA-IR 1.20 ± 0.21 2.49 ± 0.45 4.48 ± 0.94a,b 0.001 na
ESR 1h (mm) 17.7 ± 2.1 14.8 ± 3.0 35.4 ± 8.4a,b 0.020
hsCRP (mg/L) 3.8 ± 0.4 3.5 ± 0.4 6.0 ± 1.4 0.096
Vaspin (pg/mL) 728.5 ± 39.3 634.6 ± 63.7 531.5 ± 52.0a 0.028 na
Resistin (pg/mL) 72.6 ± 12.6 48.3 ± 12.9 44.6 ± 10.5 0.235 na
RBP-4 (ng/mL) 15.9 ± 2.2 13.9 ± 2.7 8.3 ± 1.9 0.076 na
IL-1α (pg/mL) 2.8 ± 0.6 1.5 ± 0.5 1.4 ± 0.6 0.203 na
IL-6 (pg/mL) 1.5 ± 0.2 2.5 ± 0.6 3.0 ± 0.6a 0.032 na
Data are presented in mean ± standard error of the mean (SEM). * Between group comparisons (ANOVA or Kruskal-Wallis test). a p<0.05 compared to the control group. b p<0.05 compared to SS patients (Bonferroni post-hoc correction). ALP: alkaline phosphatase. AST: aspartate transaminase. ALT: alanine transaminase. BMI: body mass index. ESR: erythrocyte sedimentation rate. HDL-C: high-density lipoprotein cholesterol. HOMA-IR: homeostasis model of assessment insulin resistance. hsCRP: high-sensitivity C-reactive protein. IL: interleukin. GGT: gamma glutamyl transferase. NAFLD: nonalcoholic fatty liver disease. NASH: nonalcoholic steatohepatitis. RBP: retinol-binding protein. SS: simple steatosis. WC: waist circumference.
Figure 1. Figure 1. Figure 1. Figure 1.
Figure 1. Serum vaspin (AAAAA) and interleukin-6 (BBBBB) levels (mean ± standard error of the mean) in patients with simple steatosis (SS), nonalcoholic steatohepa-titis (NASH) and controls. Serum vaspin levels was significantly higher, whereas interleukin-6 lower in NASH patients than controls. * p < 0.05 compared to control group.
In logistic regression analysis within NAFLD patients (n = 29), the presence or not of NASH was selected as de-pendent variable. None of the studied adipokines or
inter-leukins was associated with NASH independently from BMI (or WC) (model 1), or BMI (or WC), age, log(ALT) and log(HOMA-IR) (model 2).
800
700
600
500
400
Vaspin (pg/mL)
Controls SS NASH
* A
A A A A
4.0
3.5
3.0
2.5
2.0
1.5
1.0
interleukin-6
(pg/mL)
Controls SS NASH
B BB BB
Comparisons within specific histological lesions
Circulating adipokines and interleukins were com-pared within specific histological lesion of NAFLD pa-tients (n = 29). No statistically significant difference was observed in vaspin, resistin, RBP-4, IL-1α and IL-6 be-tween groups of low vs. high grade of steatosis, fibrosis, lobular inflammation, portal inflammation or ballooning (Table 2). These results did not change for any histologi-cal lesion after adjustment for each adipokine or inter-leukin for BMI.
In logistic regression analysis within each histological lesion (i.e., steatosis, fibrosis, lobular inflammation, portal inflammation and ballooning), none of the studied adi-pokines or interleukins was associated with none histo-logical lesion independently from BMI (or WC) (model 1), or BMI (or WC), age, log(ALT) and log(HOMA-IR) (model 2).
Correlations between adipokines, interleukins and other parameters
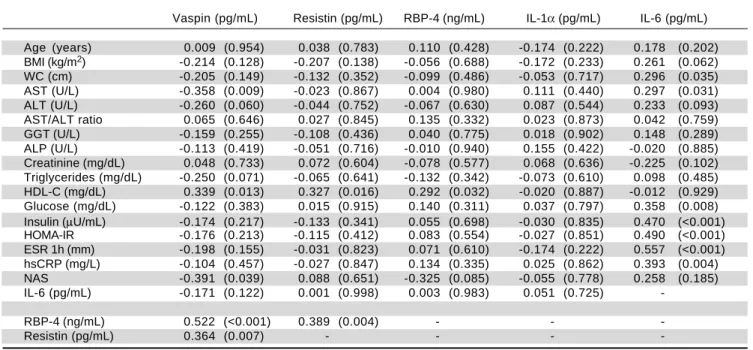
Correlations between adipokines, interleukins and other parameters of the study are presented in table 3. Vaspin was positively correlated with resistin, RBP-4 and HDL-C, whereas negatively with AST and NAS. Resistin was positively correlated with RBP-4, IL-1α and HDL-C. RBP-4 was positively correlated with IL-1α and HDL-C. IL-6 was positively correlated with WC, AST, glucose, insulin, HOMA-IR, ESR and hsCRP.
Apart from the aforementioned positive correlations with resistin and RBP-4, no other correlation was ob-served for IL-1α.
DISCUSSION
In this series, lower circulating vaspin, but higher IL-6 levels were observed in NASH patients than controls; however, both vaspin and IL-6 levels were similar in SS and NASH patients and were not independently associated with NASH. Resistin, RBP-4 and IL-1α levels were simi-lar between groups and were also not independently asso-ciated with NASH. None of the studied adipokines or interleukins showed a distinct distribution within specific hepatic histological lesions (i.e., steatosis, fibrosis, lobular and portal inflammation, and ballooning).
Data on the selected adipokines and interleukins are limited and/or inconclusive in NAFLD populations, as we have recently reviewed.3 Regarding the pleiotropic
proinflammatory cytokine, IL-6, it is produced by various tissues, including the spleen,8 visceral adipose tissue and
the liver;9 its primary physiological function involves
in-duction of acute phase reactions by stimulating hepato-cytes. In studies with histologically confirmed NAFLD, most authors reported higher IL-6 levels in NAFLD10-13
or NASH11-17 patients than controls, whereas few authors
reported similar levels between NASH patients and con-trols.18,19 In relative comparisons between SS and NASH
patients, higher IL-6 levels in NASH than SS patients were observed in some studies,15-17,20,21 whereas similar
IL-6 levels in other studies.10,12-14,19,22 Although there was a
Table 2. Vaspin, resistin, RBP-4, IL-1α and IL-6 levels between groups of specific histological lesions in NAFLD patients (n = 29).
Histological lesion Patients Vaspin Resistin RBP-4 IL-1α IL-6
(N) (pg/mL) (pg/mL) (ng/mL) (pg/mL) (pg/mL)
Steatosis grade (p-value)* 0.249 0.492 0.272 0.669 0.903
≤ 33% 18 623.6 ± 54.4 44.8 ± 10.9 12.8 ± 2.3 1.3 ± 0.5 2.7 ± 0.6
> 33% 11 520.4 ± 64.6 49.3 ± 12.9 8.8 ± 2.3 1.7 ± 0.7 2.8 ± 0.6
Fibrosis stage (p-value)* 0.710 0.730 0.731 0.206 0.725
Absent 10 565.1 ± 68.7 43.2 ± 18.8 10.4 ± 3.1 0.9 ± 0.4 2.5 ± 0.8
Present 19 598.8 ± 54.8 48.3 ± 8.2 11.7 ± 2.1 1.8 ± 0.6 2.8 ± 0.5
Lobular inflammation (p-value)* 0.670.274 0.1050.550 0.151
Absent 18 644.6 ± 58.4 53.7 ± 12.7 13.4 ± 2.4 1.6 ± 0.5 2.4 ± 0.6
Present 11 497.4 ± 50.1 34.8 ± 5.5 7.7 ± 2.0 1.2 ± 0.6 3.3 ± 0.7
Portal inflammation (p-value)* 0.141 0.098 0.108 0.776 0.465
None to minimal 18 637.1 ± 58.4 55.2 ± 12.8 13.4 ± 2.4 1.4 ± 0.5 2.4 ± 0.5
Greater than minimal 11 508.9 ± 53.1 32.3 ± 3.1 7.7 ± 2.0 1.6 ± 0.7 3.3 ± 0.8
Ballooning (p-value)* 0.226 0.246 0.255 0.545 0.228
Absent 6 686.0 ± 117.5 28.7 ± 5.7 15.1 ± 4.0 1.3 ± 0.6 1.9 ± 0.8
Present 23 559.7 ± 43.1 51.2 ± 10.1 10.2 ± 1.9 1.5 ± 0.5 3.0 ± 0.5
trend towards higher IL-6 levels in NASH compared with SS in our study (Table 1; Figure 1), this did not reach the level of statistical significance, possibly owing to small sample size and histological classification. Regarding spe-cific hepatic histological lesions, most authors did not re-port an association with IL-6, whereas a few authors reported positive association between IL-6 and steato-sis,16,21 lobular inflammation16,20 or fibrosis.16,19 However, a
limitation of most observational studies is the fact that the controls were of lower BMI than NAFLD patients, and adjustment for adiposity was rarely performed. Notably, in a 3-year prospective cohort study, neither IL-6 levels nor their change (baseline to month 36) was associated with NAFLD or fibrosis progression.23 Currently, the
proin-flammatory IL-6 is associated with the development of IR, but its exact role in the pathogenesis of NAFLD is still re-maining to be determined.
Vaspin, regarded as an insulin sensitizing and anti-orex-igenic adipokine, is expressed in human adipose tissue (predominantly visceral) and the liver;24 it is related to
obesity and insulin sensitivity. In studies with histologi-cally confirmed NAFLD, some authors reported higher circulating vaspin levels in NAFLD25,26 or NASH27
pa-tients than controls, whereas other authors reported simi-lar vaspin levels between NAFLD patients and controls.28
This controversy may be attributed to the fact that the controls were of lower BMI than patients in all previous
studies,25-27 contrary to our study, in which BMI and WC
were similar between groups. Indeed, when we adjusted vaspin levels for BMI (or WC), between group differenc-es were not different. In the comparison between SS and NASH patients, similar vaspin levels were observed in two studies,25,28 similarly to our findings.
Resistin, regarded as a proinflammatory adipokine, is produced by macrophages infiltrating human adipose tissue rather than adipocytes.29 Peripheral blood mononuclear
cells are also main producers of human resistin.30 Although
a positive association of resistin with IR, inflammation and NAFLD are documented in rodents, the topic remains in-conclusive in human NAFLD.3 In histologically confirmed
NAFLD, some authors have reported higher circulating re-sistin levels in NAFLD,31,32 SS,33,34 or NASH34 patients than
controls (of lower BMI than NAFLD patients in most studies). However, other authors reported similar resistin levels between NAFLD,12,35-37 SS,12,37,38 or NASH12,37-39
patients and controls, similarly to our findings. In the comparison between NASH and SS patients, some authors reported higher resistin levels in NASH,31,40 whereas
oth-ers reported similar levels.12,34,36-38 There is also one study
with pediatric NAFLD, in which lower resistin levels were observed in NASH than SS patients.41 An inverse
correlation between resistin and steatosis was also shown in another study with ultrasonographically confirmed NAFLD.42
Table 3. Correlations between adipokines, interleukins and other study parameters.
Vaspin (pg/mL) Resistin (pg/mL) RBP-4 (ng/mL) IL-1α (pg/mL) IL-6 (pg/mL)
Age (years) 0.009 (0.954) 0.038 (0.783) 0.110 (0.428) -0.174 (0.222) 0.178 (0.202) BMI (kg/m2) -0.214 (0.128) -0.207 (0.138) -0.056 (0.688) -0.172 (0.233) 0.261 (0.062)
WC (cm) -0.205 (0.149) -0.132 (0.352) -0.099 (0.486) -0.053 (0.717) 0.296 (0.035) AST (U/L) -0.358 (0.009) -0.023 (0.867) 0.004 (0.980) 0.111 (0.440) 0.297 (0.031) ALT (U/L) -0.260 (0.060) -0.044 (0.752) -0.067 (0.630) 0.087 (0.544) 0.233 (0.093) AST/ALT ratio 0.065 (0.646) 0.027 (0.845) 0.135 (0.332) 0.023 (0.873) 0.042 (0.759) GGT (U/L) -0.159 (0.255) -0.108 (0.436) 0.040 (0.775) 0.018 (0.902) 0.148 (0.289) ALP (U/L) -0.113 (0.419) -0.051 (0.716) -0.010 (0.940) 0.155 (0.422) -0.020 (0.885) Creatinine (mg/dL) 0.048 (0.733) 0.072 (0.604) -0.078 (0.577) 0.068 (0.636) -0.225 (0.102) Triglycerides (mg/dL) -0.250 (0.071) -0.065 (0.641) -0.132 (0.342) -0.073 (0.610) 0.098 (0.485) HDL-C (mg/dL) 0.339 (0.013) 0.327 (0.016) 0.292 (0.032) -0.020 (0.887) -0.012 (0.929) Glucose (mg/dL) -0.122 (0.383) 0.015 (0.915) 0.140 (0.311) 0.037 (0.797) 0.358 (0.008) Insulin (μU/mL) -0.174 (0.217) -0.133 (0.341) 0.055 (0.698) -0.030 (0.835) 0.470 (<0.001) HOMA-IR -0.176 (0.213) -0.115 (0.412) 0.083 (0.554) -0.027 (0.851) 0.490 (<0.001) ESR 1h (mm) -0.198 (0.155) -0.031 (0.823) 0.071 (0.610) -0.174 (0.222) 0.557 (<0.001) hsCRP (mg/L) -0.104 (0.457) -0.027 (0.847) 0.134 (0.335) 0.025 (0.862) 0.393 (0.004)
NAS -0.391 (0.039) 0.088 (0.651) -0.325 (0.085) -0.055 (0.778) 0.258 (0.185)
IL-6 (pg/mL) -0.171 (0.122) 0.001 (0.998) 0.003 (0.983) 0.051 (0.725)
-IL-1α (pg/mL) 0.244 (0.088) 0.412 (0.003) 0.293 (0.037) -
-RBP-4 (ng/mL) 0.522 (<0.001) 0.389 (0.004) - -
-Resistin (pg/mL) 0.364 (0.007) - - -
RBP-4, regarded as a proinflammatory adipokine, is pre-dominantly expressed in visceral rather than subcutaneous adipose tissue43 and the liver;44 RBP-4 levels were found to
be connected with the inflammatory response in obese in-dividuals. Data regarding RBP-4 in studies with histologi-cally confirmed NAFLD are inconclusive.3 Some authors
reported higher circulating RBP-4 levels in SS,33,45 or
NASH45 patients than controls. In the comparison between
NASH and SS patients, some authors reported similar lev-els,45-48 whereas others reported lower levels in NASH than
SS.49,50 We previously published similar RBP-4 levels
be-tween NAFLD patients and obese controls, but also a trend towards higher levels in either NAFLD patients or obese controls compared with lean controls; notably, this differ-ence became robustly significant after adjustment for BMI.48 Although we measured RBP-4 with another kit in
this study that the previous one (Biovendor Research and Diagnostic Products, Candler, NC, USA),48 this study
rep-licated the same results regarding RBP-4 between patients with SS, NASH and controls of similar BMI.
IL-1α, regarded as a proinflammatory cytokine, for which information about its distinct role in various diseas-es, including NAFLD, is limited, since most clinical stud-ies have focused on the role of IL-1β.51 To the best of our
knowledge, there is only one previous study in morbidly obese patients with NAFLD, in which, as in our study, similar IL-1α levels were observed in patients with SS, NASH and controls (of normal BMI).52 However, when
peripheral blood cells were stimulated with lipopolysac-charide, IL-1α production was higher in SS and NASH patients than controls.52 Another experimental study
showed a critical role of IL-1α (and IL-1β) in the transfor-mation of SS to NASH and liver fibrosis in hypercholes-terolemic mice. Therefore, apart from IL-1β, the possible neutralizing of IL-1α to inhibit the development of NASH should be explored.53
In this series, circulating levels of resistin, RBP-4 and IL-1α were positively associated each other. Furthermore, vaspin was positively associated with resistin and RBP-4. Although correlations cannot prove causality, we could speculate that resistin, RBP-4 and IL-1α increase each other in a vicious cycle of inflammation in NAFLD, whereas vaspin is increased in response to resistin and RBP-4, as a counterbalancing factor targeting to limit inflammation. The inverse association between vaspin levels and NAS, possibly implying a protective effect of vaspin in the liver, also needs further research. Finally, the positive association between IL-6 and other markers of inflammation (ESR, hsCRP) or glucose metabolism (glucose, insulin, HOMA-IR) are expected, since IL-6 is a key player in liver inflam-mation, but also inhibits insulin receptor.9
Based on the design of this study, we could hardly pro-pose the use of a single adipokine or a combination of
them for the noninvasive diagnosis or treatment of NAFLD. As we have proposed elsewhere,3 a certain
pro-file of adipokines/cytokines (e.g, a combination of high leptin, resistin, RBP-4, IL-6, and low adiponectin) would favour NASH over SS, but its diagnostic value remains to be elucidated. Furthermore, the deeper knowledge on the interplay between adipokines/cytokines and NAFLD may lead to clinical trials investigating the effect of adipokine-targeted interventions on NAFLD treatment, which is currently an unmet medical need.54
Strength of this study was that patients with SS and NASH and controls were of similar BMI and WC; despite this, we further adjusted the crude results for BMI or WC. This is considered to be of importance, because we con-sider that adiposity is the most important confounding when evaluating adipokine levels. Nevertheless, in most relevant studies, the controls were of lower BMI and WC, and adjustment for BMI or WC was rarely performed. Furthermore, NAFLD was histologically confirmed in our patients; despite its limitations, including sampling error, intra-and inter-individual variability, liver biopsy is currently considered to be the best available method for the diagnosis of NAFLD. However, this study has also certain limitations. The sample size was small, but it was sufficient to accurately replicate prior established associa-tions of NAFLD with HOMA-IR and liver function tests, and to demonstrate significant associations with IL-6 and vaspin. Furthermore, the cross-sectional design of the study cannot prove causality, but can certainly raise credi-ble hypotheses to be confirmed and extended by future prospective cohort as well as mechanistic studies. Moreo-ver, the controls were not subjected to liver biopsy, due to obvious ethical considerations.
In conclusion, in this series, lower circulating vaspin, but higher IL-6 levels were observed in NASH patients than controls, whereas resistin, RBP-4 and IL-1α levels were similar between the groups. Although none of the studied adipokines or interleukins could independently differentiate SS from NASH patients, or patients with more severe than less severe hepatic histological lesions, large-scale prospective cohort studies are needed, mainly to elucidate the role of IL-6, which possibly promotes in-flammation, and vaspin, being possibly beneficial, in NAFLD. The association between IL-6 and NASH, if val-idated, may also have a therapeutic potential in NASH, since antibodies against IL-6 or its receptors have been ap-proved for the treatment of inflammatory diseases, other than NASH.
ABBREVIATIONS
• ALP: alkaline phosphatase.
• AST: aspartate transaminase.
• BMI: body mass index.
• ELISA: enzyme-linked immunosorbent assay.
• ESR: erythrocyte sedimentation rate.
• GGT: gamma-glutamyl transferase.
• HDL-C: high-density lipoprotein cholesterol.
• HOMA-IR: homeostatic model of assessment insulin resistance.
• hsCRP: high-sensitivity C-reactive protein.
• IL: interleukin.
• IR: insulin resistance.
• NAFLD: non-alcoholic fatty liver disease.
• NAS: NAFLD Activity Score.
• NASH: nonalcoholic steatohepatitis.
• RBP: retinol-binding protein.
• SS: simple steatosis.
• WC: waist circumference.
FUNDING
No grant or financial support for this study.
DISCLOSURE STATEMENT
No potential conflict of interest relevant to this article is declared.
ACKNOWLEDGMENTS
The authors feel more than grateful to Dr Efthimia Za-feiriadou (experienced radiologist), who performed the liver biopsies under computed tomography-guidance, and to Dr Kalliopi Patsiaoura and Dr Evangelia Katsiki (expe-rienced pathologists), who interpreted the histological specimens.
REFERENCES
1. Polyzos SA, Kountouras J, Zavos C. Nonalcoholic fatty liver disease: the pathogenetic roles of insulin resistance and adi-pocytokines. Curr Mol Med 2009; 72: 299-314.
2. Masarone M, Federico A, Abenavoli L, Loguercio C, Persico M. Non alcoholic fatty liver: epidemiology and natural history.
Rev Recent Clin Trials 2014; 9: 126-33.
3. Polyzos SA, Kountouras J, Mantzoros CS. Adipokines in nonalcoholic fatty liver disease. Metabolism 2016; 10.1016/ j.metabol.2015.11.006.
4. Polyzos SA, Toulis KA, Goulis DG, Zavos C, Kountouras J. Serum total adiponectin in nonalcoholic fatty liver disease: a systematic review and meta-analysis. Metabolism 2011; 60: 313-26.
5. Polyzos SA, Kountouras J, Mantzoros CS. Leptin in nonalco-holic fatty liver disease: A narrative review. Metabolism
2015; 64: 60-78.
6. Kleiner DE, Brunt EM, Van NM, Behling C, Contos MJ, Cum-mings OW, Ferrell LD, et al. Design and validation of a
histo-logical scoring system for nonalcoholic fatty liver disease.
Hepatology 2005; 41: 1313-21.
7. Polyzos SA, Kountouras J, Slavakis A, Zafeiriadou E, Pat-siaoura K, Katsiki E, Zavos C, et al. A novel noninvasive in-dex for nonalcoholic steatohepatitis: a pilot study.
Biomarkers 2013; 18: 607-13.
8. Tarantino G, Savastano S, Capone D, Colao A. Spleen: A new role for an old player? World J Gastroenterol 2011; 17: 3776-84.
9. Abenavoli L, Peta V. Role of adipokines and cytokines in non-alcoholic fatty liver disease. Rev Recent Clin Trials
2014; 9: 134-40.
10. Genc H, Dogru T, Kara M, Tapan S, Ercin CN, Acikel C, Kars-lioglou Y, et al. Association of plasma visfatin with hepatic and systemic inflammation in nonalcoholic fatty liver disease.
Ann Hepatol 2013; 12: 308-87.
11. Das SK, Balakrishnan V. Role of cytokines in the pathogene-sis of non-alcoholic Fatty liver disease. Indian J Clin Bio-chem 2011; 26: 202-9.
12. Jarrar MH, Baranova A, Collantes R, Ranard B, Stepanova M, Bennett C, Fang Y, et al. Adipokines and cytokines in non-alcoholic fatty liver disease. Aliment Pharmacol Ther 2008; 27: 412-21.
13. Haukeland JW, Damas JK, Konopski Z, Loberg EM, Haaland T, Goverud I, Torjesen PA, et al. Systemic inflammation in nonalcoholic fatty liver disease is characterized by elevated levels of CCL2. J Hepatol 2006; 44: 1167-74.
14. Coulon S, Francque S, Colle I, Verrijken A, Blomme B, Hein-dryckx F, De Munter S, et al. Evaluation of inflammatory and angiogenic factors in patients with non-alcoholic fatty liver disease. Cytokine 2012; 59: 442-9.
15. Tarantino G, Conca P, Pasanisi F, Ariello M, Mastrolia M, Are-na A, Tarantino M, et al. Could inflammatory markers help di-agnose nonalcoholic steatohepatitis? Eur J Gastroenterol Hepatol 2009; 21: 504-11.
16. Wieckowska A, Papouchado BG, Li Z, Lopez R, Zein NN, Feldstein AE. Increased hepatic and circulating interleukin-6 levels in human nonalcoholic steatohepatitis. Am J Gastro-enterol 2008; 103: 1372-9.
17. Abiru S, Migita K, Maeda Y, Daikoku M, Ito M, Ohata K, Na-gaoka S, et al. Serum cytokine and soluble cytokine receptor levels in patients with non-alcoholic steatohepatitis. Liver Int
2006; 26: 39-45.
18. Krawczyk K, Szczesniak P, Kumor A, Jasinska A, Omulecka A, Pietruczuk M, Orszulak-Michalak D, et al. Adipohormones as prognostric markers in patients with nonalcoholic steato-hepatitis (NASH). J Physiol Pharmacol 2009; 60(Suppl. 3): 71-5.
19. Lemoine M, Ratziu V, Kim M, Maachi M, Wendum D, Paye F, Bas-tard JP, et al. Serum adipokine levels predictive of liver injury in non-alcoholic fatty liver disease. Liver Int 2009; 29: 1431-8. 20. Grigorescu M, Crisan D, Radu C, Grigorescu MD, Sparchez
Z, Serban A. A novel pathophysiological-based panel of bi-omarkers for the diagnosis of nonalcoholic steatohepatitis. J Physiol Pharmacol 2012; 63: 347-53.
21. Garcia-Galiano D, Sanchez-Garrido MA, Espejo I, Montero JL, Costan G, Marchal T, Membrives A, et al. IL-6 and IGF-1 are independent prognostic factors of liver steatosis and non-alcoholic steatohepatitis in morbidly obese patients.
Obes Surg 2007; 17: 493-503.
22. Vuppalanchi R, Troutt JS, Konrad RJ, Ghabril M, Saxena R, Bell LN, Kowdley KV, et al. Serum hepcidin levels are asso-ciated with obesity but not liver disease. Obesity 2014; 22: 836-41.
liver disease: a prospective study with paired liver biopsies at 3 years. Gut 2010; 59: 969-74.
24. Bluher M. Vaspin in obesity and diabetes: pathophysiological and clinical significance. Endocrine 2012; 41: 176-82. 25. Aktas B, Yilmaz Y, Eren F, Yonal O, Kurt R, Alahdab YO,
Ce-likel CA, et al. Serum levels of vaspin, obestatin, and apelin-36 in patients with nonalcoholic fatty liver disease.
Metabolism 2011; 60: 544-9.
26. Yilmaz Y, Kurt R, Gurdal A, Alahdab YO, Yonal O, Senates E, Polat N, et al. Circulating vaspin levels and epicardial adi-pose tissue thickness are associated with impaired coronary flow reserve in patients with nonalcoholic fatty liver dis-ease. Atherosclerosis 2011; 217: 125-9.
27. Genc H, Dogru T, Tapan S, Kara M, Ercin CN, Aslan F, Kantarcioglu M, et al. Circulating vaspin and its relationship with insulin sensitivity, adiponectin, and liver histology in subjects with non-alcoholic steatohepatitis. Scand J Gastro-enterol 2011; 46: 1355-61.
28. Kukla M, Zwirska-Korczala K, Hartleb M, Waluga M, Chwist A, Kajor M, Ciupinska-Kajor M, et al. Serum chemerin and vaspin in non-alcoholic fatty liver disease. Scand J Gastro-enterol 2010; 45: 235-42.
29. Curat CA, Wegner V, Sengenes C, Miranville A, Tonus C, Busse R, Bouloumie A. Macrophages in human visceral adi-pose tissue: increased accumulation in obesity and a source of resistin and visfatin. Diabetologia 2006; 49: 744-7. 30. Savage DB, Sewter CP, Klenk ES, Segal DG, Vidal-Puig A,
Considine RV, O’Rahilly S. Resistin / Fizz3 expression in lation to obesity and peroxisome proliferator-activated re-ceptor-gamma action in humans. Diabetes 2001; 50: 2199-202.
31. Pagano C, Soardo G, Pilon C, Milocco C, Basan L, Milan G, Donnini D, et al. Increased serum resistin in nonalcoholic fatty liver disease is related to liver disease severity and not to in-sulin resistance. J Clin Endocrinol Metab 2006; 91: 1081-6. 32. Senates E, Colak Y, Yesil A, Coskunpinar E, Sahin O,
Kahra-man OT, Erkalma Senates B, et al. Circulating resistin is ele-vated in patients with non-alcoholic fatty liver disease and is associated with steatosis, portal inflammation, insulin resist-ance and nonalcoholic steatohepatitis scores. Minerva Med
2012; 103: 369-76.
33. Cengiz C, Ardicoglu Y, Bulut S, Boyacioglu S. Serum retinol-binding protein 4 in patients with nonalcoholic fatty liver dis-ease: does it have a significant impact on pathogenesis? Eur J Gastroenterol Hepatol 2010; 22: 813-9.
34. Shen C, Zhao CY, Wang W, Wang YD, Sun H, Cao W, Yu WY, et al. The relationship between hepatic resistin overex-pression and inflammation in patients with nonalcoholic stea-tohepatitis. BMC Gastroenterol 2014; 14: 39.
35. Auguet T, Terra X, Porras JA, Orellana-Gavalda JM, Martinez S, Aguilar C, Lucas A, et al. Plasma visfatin levels and gene expression in morbidly obese women with associated fatty liver disease. Clin Biochem 2013; 46: 202-8.
36. Wong VW, Hui AY, Tsang SW, Chan JL, Tse AM, Chan KF, So WY, et al. Metabolic and adipokine profile of Chinese pa-tients with nonalcoholic fatty liver disease. Clin Gastroen-terol Hepatol 2006; 4: 1154-61.
37. Argentou M, Tiniakos DG, Karanikolas M, Melachrinou M, Makri MG, Kittas C, Kalfarentzos F. Adipokine serum levels are related to liver histology in severely obese patients un-dergoing bariatric surgery. Obes Surg 2009; 19: 1313-23. 38. Koehler E, Swain J, Sanderson S, Krishnan A, Watt K,
Charlton M. Growth hormone, dehydroepiandrosterone and adiponectin levels in non-alcoholic steatohepatitis: an endo-crine signature for advanced fibrosis in obese patients. Liv-er Int 2012; 32: 279-86.
39. Musso G, Gambino R, Durazzo M, Biroli G, Carello M, Faga E, Pacini G, et al. Adipokines in NASH: postprandial lipid metab-olism as a link between adiponectin and liver disease. Hepa-tology 2005; 42: 1175-83.
40. Charlton M, Angulo P, Chalasani N, Merriman R, Viker K, Charatcharoenwitthaya P, Sanderson S, et al. Low circulat-ing levels of dehydroepiandrosterone in histologically ad-vanced nonalcoholic fatty liver disease. Hepatology 2008; 47: 484-92.
41. Fitzpatrick E, Dew TK, Quaglia A, Sherwood RA, Mitry RR, Dhawan A. Analysis of adipokine concentrations in paediat-ric non-alcoholic fatty liver disease. Pediatr Obes 2012; 7: 471-9.
42. Abenavoli L, Luigiano C, Guzzi PH, Milic N, Morace C, Stelitano L, Consolo P, et al. Serum adipokine levels in overweight patients and their relationship with non-al-coholic fatty liver disease. Panminerva Med 2014; 56: 189-93.
43. Kloting N, Graham TE, Berndt J, Kralisch S, Kovacs P, Wason CJ, Fasshauer M, et al. Serum retinol-binding protein is more highly expressed in visceral than in subcutaneous adipose tissue and is a marker of intra-abdominal fat mass. Cell Me-tab 2007; 6: 79-87.
44. Blaner WS. Retinol-binding protein: the serum transport pro-tein for vitamin A. Endocr Rev 1989; 10: 308-16.
45. Terra X, Auguet T, Broch M, Sabench F, Hernandez M, Pas-tor RM, Quesada IM, et al. Retinol binding protein-4 circulating levels were higher in nonalcoholic fatty liver disease vs. his-tologically normal liver from morbidly obese women. Obesity
2013; 21: 170-7.
46. Milner KL, van der Poorten D, Xu A, Bugianesi E, Kench JG, Lam KS, Chisholm DJ, et al. Adipocyte fatty acid binding pro-tein levels relate to inflammation and fibrosis in nonalcoholic fatty liver disease. Hepatology 2009; 49: 1926-34.
47. Kashyap SR, Diab DL, Baker AR, Yerian L, Bajaj H, Gray-McGuire C, Schauer PR, et al. Triglyceride levels and not adi-pokine concentrations are closely related to severity of nonalcoholic fatty liver disease in an obesity surgery cohort.
Obesity 2009; 17: 1696-701.
48. Polyzos SA, Kountouras J, Anastasilakis AD, Geladari EV, Mantzoros CS. Irisin in patients with nonalcoholic fatty liver disease. Metabolism 2014; 63: 207-17.
49. Alkhouri N, Lopez R, Berk M, Feldstein AE. Serum retinol-binding protein 4 levels in patients with nonalcoholic fatty liv-er disease. J Clin Gastroenterol 2009; 43: 985-9.
50. Nobili V, Alkhouri N, Alisi A, Ottino S, Lopez R, Manco M, Feldstein AE. Retinol-binding protein 4: a promising circu-lating marker of liver damage in pediatric nonalcoholic fat-ty liver disease. Clin Gastroenterol Hepatol 2009; 7: 575-9.
51. Rider P, Carmi Y, Voronov E, Apte RN. Interleukin-1alpha.
Semin Immunol 2013; 25: 430-8.
52. Poniachik J, Csendes A, Diaz JC, Rojas J, Burdiles P, Malu-enda F, Smok G, et al. Increased production of IL-1alpha and TNF-alpha in lipopolysaccharide-stimulated blood from obese patients with non-alcoholic fatty liver disease. Cytokine
2006; 33: 252-7.
53. Kamari Y, Shaish A, Vax E, Shemesh S, Kandel-Kfir M, Ar-bel Y, Olteanu S, et al. Lack of interleukin-1alpha or inter-leukin-1beta inhibits transformation of steatosis to steatohepatitis and liver fibrosis in hypercholesterolemic mice. J Hepatol 2011; 55: 1086-94.
Correspondence and reprint request:
Stergios A. Polyzos, M.D., M.Sc., Ph.D.
13 Simou Lianidi, 551 34 Thessaloniki, Macedonia, Greece Tel. and Fax: +302310424710