Application of molecular techniques to the diagnosis and epidemiology of Haemophilus parasuis
100
0
0
Texto completo
(2) “Application of molecular techniques to the diagnosis and epidemiology of Haemophilus parasuis” Memòria redactada per Alexandre Olvera van der Stoep, inscrit al programa de doctorat en Bioquímica i Biologia Molecular del Departament de Bioquímica i Biologia Molecular de la Universitat Autonoma de Barcelona per optar al grau de doctor. El present treball a estat realitzat sota la direcció de la Dra. Virginia Aragón Fernández al Centre de Recerca en Sanitat animal (CReSA, Esfera UAB), finançat per la Comisión Interministerial de Ciencia y Tecnología (CICYT) com a part del projecte: “Estudio de la variabilidad, genética, funcional y patológica de cepas de campo de Haemophilus parasuis (AGL-2004-07349/GAN)”.. Vist-i-plau, El director de la tesis. Autor. Dra. Virginia Aragón Fernández. Alexandre Olvera van der Stoep. Bellaterra, Octubre 2006..
(3) “Clairvoyance” by René Magritte, 1936 (Galerie Isy Brachot, Brussels). “Well, I've been in the city for twenty years and I must admit - I'm lost.” The monty python flying circus … and now for something completely different..
(4) Acknowledgments La extensió que tenen normalment els agraïments a les tesis doctorals es molt indicativa de fins a quin punt ens impliquem en elles. L’obsessió pot arribar a un extrem en que acabes parlant del sub-món de la recerca i de la tesis a pares, germanes, amics i, fins i tot, algun desconegut imprudent. En tot cas, al final hi ha molta gent a qui estar agraït, bàsicament per que en recerca, com en tots els aspectes de la vida, una persona sola no fa gaire feina... provaré no allargar-me massa i no endescuidar-me ningú, però coneixent-me de ben segur que hem deixaré algú molt important. Primerament, voldria agrair a la Dra. Maria Calsamiglia (la meva primera directora de tesis) haver-me vist capaç de començar una tesis y a la Dra. Virginia Aragón (la meva segona directora de tesis) haver-me vist capaç d’acabar-la. A la Marta i la Núria haver fet bona part de la feina i a tota la gent del CReSA el saludable ambient de treball, i no queixar-se quan poso la música a tot drap al laboratori. A tots els becaris els sopars del dijous (qui convoca el següent?, jo encara diria mes, hi haurà un següent sopar?). Haig d’agrair molt especialment la paciència mostrada en acte de servei a la Maria, l’Stone i la Rousie, com hagués pogut acabar la tesis sense algú a qui emprenyar!? (me aburro!!) Després haig agrair a tots els de casa, no només haver-me deixat fer el que volgués, sinó haver-me incitat a fer-ho. No puc deixar de mencionar les llargues hores d’avorriment que he ocasionat als meus amics bacanars, faig unes dissertacions sobre l’apassionant món del bacteris a altes hores de la matinada... santa paciència! Finalment, agrair als meus companys de promoció, tant de Girona com de Barcelona, uns quants sopar mono-temàtics sobre la becarietat dels precaris! I per acabar, agrair a August Kuentzmann Damm i Sergei Ivanovich Popov (inventor del tuberculo nacional ruso, la patata) la seva guia i inspiració..
(5) Application of molecular techniques to the diagnosis and epidemiology of Haemophilus parasuis. Index Summary. 9. Introduction 1- Infections by Haemophilus parasuis 2- Haemophilus parasuis: general description 3- Pathogenic mechanisms of Haemophilus parasuis 4- Diagnosis of infections by Haemophilus parasuis 4.1- Clinical and pathological diagnosis 4.2- Laboratory diagnosis 4.2.1- Bacterial isolation 4.2.2- H. parasuis identification: biochemical tests and PCR 5- Haemophilus parasuis epidemiology 5.1- Serotyping 5.2- Genotyping 5.2.1- Restriction Endonuclease Pattern (REP) 5.2.2- Enterobacterial Repetitive Intergenic Consensus (ERIC)-PCR 5.2.3- Restriction Fragment Length Polymorphism-PCR 5.2.4- Analysis of electrophoretic patterns. 11 11 13 15 16 17 17 17 18 20 21 23 24 25 26 27. Hypothesis. 29. Objectives. 30. Results Chapter 1: “Genotypic diversity of Haemophilus parasuis Field Strains” Chapter 2: “Study of the population structure of Haemophilus parasuis by multilocus sequence typing”. 31 33 43. Discusion 1- Genotyping of H. parasuis 2- Recombination and lateral gene transfer 3- H. parasuis diversity and control of disease 4- Subpopulations in H. parasuis 5- Population structure of H. parasuis 6- Taxonomic implications 7- Final remarks. 57 58 61 62 64 65 66 67. Conclusions. 69. Annex I- Supplementary figure S1 II- Protocols IIA. ERIC-PCR IIB. hsp60-SLST IIC. 16S rRNA gene sequencing IID. MLST. 71 71 73 73 77 81 85. References. 91. 7.
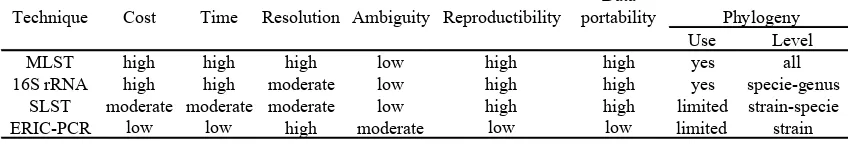
(6) Application of molecular techniques to the diagnosis and epidemiology of Haemophilus parasuis. Tables index Pg 12 Table 1. Bacterial findings in pigs inoculated with a pericardium isolate of H. parasuis. Pg 19. Table 2. Biochemical test for H. parasuis differentiation from other Pastereullaceae isolated from swine.. Pg 21. Table 3. Experimental challengues with different H. parasuis.. Pg 22. Table 4. Serotype prevalence in different countries.. Pg 22. Table 5. Vaccination tests with heterologous serovars. Results of challengues with homologous serovars are only included when protection failed.. Pg 24. Table 6. Comparison of common bacterial typing techniques. Pg 53. Table S1. Supplementary table. Pg 60. Table 7. Comparison of the four techniques applied to the typing of H. parasuis.. Pg 74. Table A. ERIC-PCR reaction and cycling conditions. Pg 78. Table B. hsp60-PCR reaction and cycling conditions. Pg 82. Table C. 16S rRNA gene PCR reaction and cycling conditions. Pg 87. Table D. Genes, primer sequences and amplicon sizes of the MLST for H. parasuis. Pg 87. Table E. Reactions and thermocycling conditions of the MLST PCR’s. Figures index Pg 13 Fig 1. Diagram of the relationship between: colonization, natural immunity and Glässer disease outcome Pg 14. Fig 2. Taxonomic position (a) and phylogeny (b), using the 16S rRNA gene of H. parasuis. Pg 18. Fig 3. Colony morphology and gram staining of H. parasuis. Pg 25. Fig 4. ERIC-PCR fingerprint of different H. parasuis strains. Pg 59. Fig 5. Burst representation of the MLST group 2 (Chapter 2). Pg 71. Fig S1. 16S rRNA gene tree of the chapter 2 isolates. Pg 77. Fig A. Different genes and the taxonomic level at which are used to differentiate bacteria.. Pg 85. Fig B. Flow-trough diagram of a multilocus sequence typing scheme (MLST). 8.
(7) Application of molecular techniques to the diagnosis and epidemiology of Haemophilus parasuis. Summary Haemophilus parasuis is the etiological agent of Glässer’s disease, but this bacterium causes other clinical outcomes and can also be isolated from the upper respiratory tract of healthy pigs. Isolates of H. parasuis differ in phenotypic features (e.g. protein profiles, colony morphology or capsule production) and pathogenic capacity. Differences among strains have also been demonstrated at the genetic level. Several typing methods have been used to classify H. parasuis field strains, but they showed resolution or implementation problems. To overcome these limitations, different DNA sequence based techniques were evaluated. Consequently, the final goal of this study was to improve H. parasuis typing and examine the association of groups of strains with disease outcome. In the first chapter of this work, a partial sequence from the heat shock protein 60 KDa (hsp60) gene was assessed as epidemiological marker in a single locus sequence typing (SLST). We compared enterobacterial repetitive intergenic consensus (ERIC)-PCR patterns, partial sequences of hsp60 and 16S rRNA genes from 103 strains of H. parasuis and other related species. In the second chapter of this work, we developed a multilocus sequence typing (MLST) system using partial sequences of the house-keeping genes mdh, 6pgd, atpD, g3pd, frdB, infB and rpoB. Eleven reference strains and 120 field strains were included in this latter study. Our results showed that hsp60 is a reliable marker for epidemiological studies in H. parasuis, and the analysis of its sequence is a better approach than fingerprinting methods. Surprisingly, the 16S rRNA gene showed enough variability to be used, not only for species identification, but also for typing. Furthermore, the analysis of the hsp60 and 16S rRNA sequences revealed the presence of a separated lineage of diseaseassociated strains. Both SLST and MLST studies indicated the occurrence of lateral gene transfer among H. parasuis and Actinobacillus strains invalidating the use of single gene approaches in the phylogenetic analysis of these species. MLST analysis revealed the existence of 6 clusters. When the clinical background of the isolates was examined, one cluster was statistically associated with nasal isolation, while another cluster was associated with isolation from lesions. The latter cluster was the same disease-associated cluster identified by hsp60 and 16S rRNA gene analysis. Finally, although a freely recombining population structure was reported, two divergent branches were found when a neighbour-joining tree was constructed with the 9.
(8) Application of molecular techniques to the diagnosis and epidemiology of Haemophilus parasuis. concatenated sequences. The latter, supports the results obtained by 16S rRNA gene sequencing and indicate that H. parasuis is more likely to have a cryptic speciation than a true panmictic population structure.. 10.
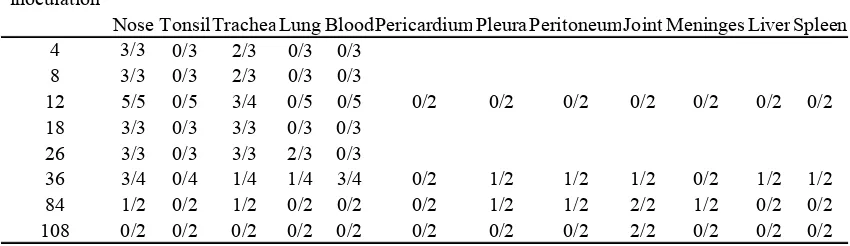
(9) Introduction. Introduction 1. Infections by Haemophilus parasuis Swine production has dramatically changed in recent years. New trends in production, which include the early weaning of piglets and the management of specific pathogen free herds, have contributed to an increase in the prevalence and severity of several bacterial diseases, including those caused by Haemophilus parasuis (RappGabrielson et al., 2006). Pigs can be colonized by different microorganisms before weaning (Pijoan & Trigo, 1990), but some of these microorganisms are potentially pathogenic. In the last years, H. parasuis, Streptococcus suis and Actinobacillus suis have emerged as significant pathogens for the swine industry, especially in high health status farms. H. parasuis is one of those “early colonizer agents”, which, with the appropriate conditions, can cause severe outbreaks (Pijoan et al., 1997). Moreover, infections with H. parasuis and S. suis are considered two of the most common and costly problems in swine herds. In fact, the terminology “suis-ide diseases” has been used to describe the serious impact of these bacteria (MacInnes & Desrosiers, 1999). H. parasuis is well known as the etiological agent of Glässer’s disease. This swine disease is a systemic infection by H. parasuis, which produces fibrinous inflammation of membranes lining the large body cavities, joints and meninges. Replication of the bacteria in serosal surfaces produces the typical fibrinoporulent polyserositis, polyarthritis and meningitis. Besides, petechiae or ecchymoses in the liver, kidney and meninges can also be found. Fibrinous thrombi can also be observed in many organs and high levels of endotoxin are detected in plasma (Amano et al., 1994). Endotoxin and disseminated intravascular coagulation may be involved in cases of sudden death (Amano et al., 1997). Vahle et al. studied the sequential events of infection in caesarean-derived, colostrum-deprived (CDCD) pigs (Vahle et al., 1995; Vahle et al., 1997) by intranasal inoculation with a strain previously isolated from a pericardium lesion. The infection resulted in H. parasuis isolation from nose and trachea after 12 hours, from blood after 36 hours and from systemic tissues after 36-108 hours (Table 1).. 11.
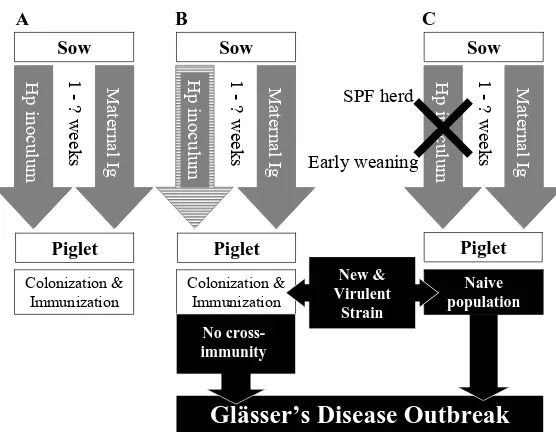
(10) Introduction. Necropsy speciment. Hours postinoculation 4 8 12 18 26 36 84 108. Nose TonsilTrachea Lung BloodPericardiumPleuraPeritoneumJoint Meninges LiverSpleen 3/3 0/3 2/3 0/3 0/3 3/3 0/3 2/3 0/3 0/3 5/5 0/5 3/4 0/5 0/5 0/2 0/2 0/2 0/2 0/2 0/2 0/2 3/3 0/3 3/3 0/3 0/3 3/3 0/3 3/3 2/3 0/3 3/4 0/4 1/4 1/4 3/4 0/2 1/2 1/2 1/2 0/2 1/2 1/2 1/2 0/2 1/2 0/2 0/2 0/2 1/2 1/2 2/2 1/2 0/2 0/2 0/2 0/2 0/2 0/2 0/2 0/2 0/2 0/2 2/2 0/2 0/2 0/2. Table 1. Bacterial findings in pigs inoculated with a pericardium isolate of H. parasuis {Adapted from (Vahle et al., 1995; Vahle et al., 1997)}. Results are indicated as Nº of isolation positive animals/Nº total animals. Several reports (Oliveira et al., 2003; Smart et al., 1988; Smart et al., 1989) have demonstrated that more than one strain can be isolated in a herd (up to 6 in a single farm) and even from a single animal. However, it is commonly accepted that one single strain is responsible of a disease outbreak, although there are some studies where more than one strain were implicated in clinical outbreaks (Oliveira et al., 2003; Smart et al., 1993; Smart et al., 1989). Historically, Glässer’s disease was a sporadic disease of young pigs (1-4 months) compromised by stress. In conventional herds, the piglets are infected by the sows while they are protected by the maternal immunity, allowing them to develop natural immunity to the prevalent strains of H. parasuis in the farm. The elimination of the bacterium from the population in the case of SPF herds, or the low rate of transmission between sow and piglets due to early weaning, eliminates natural immunity in all or a part of the herd (Fig 1). Therefore, in SPF and high health status herds, late infection with H. parasuis, when maternal immunity is no longer present, can have severe consequences, with high morbidity and mortality affecting pigs at any stage of production (Baehler et al., 1974; Menard & Moore, 1990; Nielsen & Danielsen, 1975; Smart & Miniats, 1989) (Fig 1). In consequence, H. parasuis is a major problem when mixing pigs of different origin or introducing new breading stock into a herd. The entry of a new virulent strain in the population with no cross-immunity with the prevalent strains may result in disease outcome. For these reasons, farms using multisite production, which generally also use early weaning, are specially affected.. 12.
(11) Introduction. A. B. C. Sow. Sow. Maternal Ig. Early weaning. 1 - ? weeks. SPF herd. Hp inoculum. Maternal Ig. Colonization & Immunization. 1 - ? weeks. Hp inoculum. Maternal Ig. 1 - ? weeks. Hp inoculum. Piglet. Sow. Piglet. Piglet Colonization & Immunization. New & Virulent Strain. Naive population. No crossimmunity. Glässer’s Disease Outbreak Fig 1. Diagram of the relationship between: colonization, natural immunity and Glässer disease outcome. A. Equilibrium between colonization and immunity acquisition. B. Disease outcome due to the entry of a new strain. C. Disease outcome due to the elimination of the bacteria from the population and the subsequent introduction of a virulent strain. On the other hand, H. parasuis can also cause other clinical outcomes, such as pneumonia and sudden death. Although not fully demonstrated in animal challenges (Rapp-Gabrielson et al., 1992), H. parasuis is consistently isolated from pneumonic lungs, but usually not from normal lungs (Gutierrez et al., 1993; Little, 1970; Moller et al., 1993; Morrison et al., 1985). Moreover, there are several reports supporting that virulent strains of H. parasuis can be a primary cause of pneumonia in swine (Barigazzi et al., 1994; Brockmeier, 2004; Muller et al., 2003; Pöhle et al., 1992; Solano et al., 1997). Even so, more in vitro and in vivo evidence is needed to elucidate this point (Cooper et al., 1995; Narita et al., 1990; Narita et al., 1989; Segales et al., 1999; Segales et al., 1998; Solano et al., 1997)). Besides, this microorganism can also act as an opportunistic pathogen in pneumonia after infection with other viral (porcine respiratory and reproductive syndrome virus, pseudorabies, swine influenza virus, porcine. respiraotry. coronavirus). or. bacterial. (Mycoplasma. hyopneumoniae,. Mycoplasma hyorhinis) pathogens.. 2. Haemophilus parasuis: general description Although K. Glässer found an association between fibrinous polyserositis in swine and a small gram negative rod in 1910 (Rapp-Gabrielson et al., 2006), the causative agent of the disease was likely isolated for the first time by Schermer and. 13.
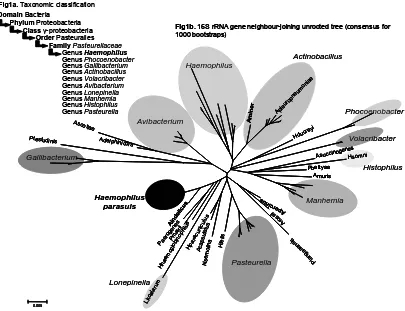
(12) Introduction. Ehrlich in 1922 (Little, 1970). However, it was not until 1943 when the bacterium was characterized by Hjärre and Wramby (Hjärre & Wramby, 1943) and it was called Haemophilus suis. Following the accepted nomenclature for the Haemophilus genus, the prefix para- was added to indicate the need of factor V (Nicotine adenosine dinucleotide or NAD Phosphate) but not of factor X (protoporphirin IX or protoheme) (Biberstein & White, 1969). Fig1a. Taxonomic classification Domain Bacteria Phylum Proteobacteria Class γ-proteobacteria Order Pasteuralles Family Pasteurellaceae Genus Haemophilus Genus Phocoenobacter Genus Gallibacterium Genus Actinobacillus Genus Volacribacter Genus Avibacterium Genus Lonepinella Genus Manhemia Genus Histophilus Genus Pasteurella. Actinobacillus. Adelph inic. Amino r. Ap le ur. op ne um. on ia e. Haemophilus. Avibacterium. Asco tiae Ptestudini s. Fig1b. 16S rRNA gene neighbour-joining unrooted tree (consensus for 1000 bootstraps). Phocoenobacter Hd. e ucr. yi. ola. Volacribacter enes cinog Asuc Hsomni. Gallibacterium. Pbettyae Amuris. 0.005. Hfelis. Pa er mo o glo Pm gen Ain bin ai es do op rii lic hil us us Hp ar a Aca cunic psu latu ulus Nsem s olina. Lk o. ala. rum. Hh ae. is. Pasteurella. Pl an g aa en s. Lonepinella. Manhemia. Ar os s Ap ii orc inu s. Haemophilus parasuis. Histophilus. Fig 2. Taxonomic position (a) and phylogeny (b), using the 16S rRNA gene of H. parasuis. Actually, H. parasuis is included in the genus Haemophilus, within the family Pasteurellaceae of the γ-proteobacteria (Fig 2a). However, the phylogeny and taxonomy of the family Pasteurellaceae are clearly problematic and the taxonomic position of H. parasuis is uncertain (Olsen et al., 2005). To illustrate the difficulties in defining different monophyletic taxons inside the Pasteurellaceae, we have constructed an updated (August 2006) neighbour-joining consensus tree (1,000 bootstraps) using 16S rRNA gene sequences available at the Ribosomal Database Project II (http://rdp.cme.msu.edu/) (Fig 2b). The species within the different genera do not form monophyletic clusters, and many sequences remain in segregated branches.. 14.
(13) Introduction. In addition to H. parasuis, other NAD-dependent Pasteurellaceae can be isolated from swine. Six species of porcine origin have been defined on the basis of DNA-DNA hybridization and 16S rRNA gene sequencing (Kielstein et al., 2001; Moller & Kilian, 1990; Moller et al., 1996; Rapp-Gabrielson & Gabrielson, 1992). With 16S rRNA gene analysis, Actinobacillus indolicus seems to have diverged very recently from H. parasuis, and actually, they form a separate monophyletic branch that has been called the “parasuis” cluster (Olsen et al., 2005). The pig is the natural host of H. parasuis, where this bacterium is a common inhabitant of the upper respiratory tract (Bertschinger & Nicod, 1970; Cu et al., 1998; Harris et al., 1969; Moller et al., 1993; Smart et al., 1989). In conventional herds, H. parasuis is one of the earliest and most prevalent isolates from nasal swabs of pigs of 1 week of age (Kott, 1983). This indicates that H. parasuis colonizes pigs at a very young age, most likely from the sow (Oliveira et al., 2004; Pijoan, 1995; Pijoan et al., 1997). Although colonization of the (mid) nasal cavity and the trachea has been fully demonstrated, its presence in the tonsils is still controversial (Amano et al., 1994; Moller & Kilian, 1990; Oliveira et al., 2001b; RabBach, 1992; Vahle et al., 1997).. 3. Pathogenic mechanisms of Haemophilus parasuis Although the immunologic status of the animal and the pathogenic capacity of the strains are important determinants for disease outcome, microbial and host factors that allow systemic infection are not known. There are differences in virulence and lack of cross-immunity between strains that have a great impact in disease outcome and control. From the clinical data, we can assume that virulent strains of H. parasuis have mechanisms of adhesion and invasion, and recently, several studies have attempted to identify the specific virulence factors. Some studies concentrated in gene expression under conditions that mimicked the in vivo environment (Hill et al., 2003; Melnikow et al., 2005), and albeit some differently expressed genes were identified {e.g. homologs of fatty acil-CoA synthetase (fadD), diadenosine tetraphosphatase (apaH), cysteine synthetase (cysK) , PTS system, spermidine/putrescine transporter (potD) or glycerol-3phosphate uptake (GlpT)}, more extensive studies are needed to determine the real role of these candidate genes in the virulence of H. parasuis. Genes involved in iron-uptake have also been identified in two different genomic regions (ferric hydroxamate uptake and transferring binding protein) (Bigas et al., 2006; del Rio et al., 2005; del Rio et al., 15.
(14) Introduction. 2006a). The comparison of protein profiles of strains with different virulence identified a 37KDa protein as candidate virulence marker, but no role for this protein has been proposed (Oliveira & Pijoan, 2004b; Rosner et al., 1991). Endotoxin, lipoligosaccharide (LOS) in the case of H. parasuis (Zucker et al., 1994; Zucker et al., 1996), is known to have a role in pathogenesis (Amano et al., 1997), and the production of anti-LOS monoclonal antibodies and their protective role in a mouse model infection supported the implication of LOS in the pathogenesis of H. parasuis (Tadjine et al., 2004a). In addition, this monoclonal antibody was species-specific and could be useful for diagnosis. Later, Vanier et al. demonstrated the capacity of invasion of endothelial cells by virulent strains (Vanier et al., 2006), but the factor/s involved in this function need to be determined. On the other hand, production of capsule and fimbria-like structures was detected after in vivo passage, but it has not been clearly associated with virulence (Munch et al., 1992; Rapp-Gabrielson et al., 1992). Also, the enzyme neuraminidase has been purified and characterized (Lichtensteiger & Vimr, 1997; Lichtensteiger & Vimr, 2003) and >90% of the field isolates showed neuraminidase activity. Once again, its role as a virulence factor is not clear since it may be related either to virulence potential or to nutrient limitation. Recently, differences in biofilm formation have been reported; and indicated that strains recovered from lung or systemic sites usually lost the ability to form biofilms in vitro (Jin et al., 2006). The understanding of Glässer’s disease will benefit from information from genome sequencing projects and identification of virulence and host tropism factors, which will be crucial to explain disease outcome, susceptibility and spread (Holmes, 1999). Thus, the recombinant expression of specific genes as well as the production of defined mutants will establish their role in H. parasuis virulence.. 4. Diagnosis of infections by Haemophilus parasuis The diagnosis of Glässer’s disease presents significant challenges due to the existence of strains that have been proven non-virulent in experimental challenges (Kielstein & Rapp-Gabrielson, 1992) and the early colonization of healthy piglets by H. parasuis strains. Virulent and non-virulent strains can coexist, and therefore it is important to evaluate the potential virulence of the isolated strains, especially if treatment strategies have failed. Unfortunately, the virulence factors of H. parasuis are. 16.
(15) Introduction. not known and only the organ of isolation gives an indication of the virulence of a strain. Differential diagnosis should include septicaemic bacterial infections caused by Streptococcus suis, Erysipelothrix rhushiopatiae, Actinobacillus suis, Salmonella cholerasuis var. kunzendorf and Escherichia coli. Mycoplasma hyorhinis produces similar polyserositis lesions in 3-10 weeks old pigs.. 4.1. Clinical and pathological diagnosis Pathological outcomes associated with H. parasuis infection include fibrinous polyserositis. and. arthritis,. septicaemia. without. polyserositis. lesions. and. bronchopneumonia (Hoefling, 1994). Also, although only described once, H. parasuis has been linked to acute miositis of masseter muscles in gilts (Hoefling, 1991) and ear panniculitis in growing-finishing pigs (Drolet et al., 2000). When lesions of fibrinous polyserositis and polyarthritis develop (acute presentation), clinical signs may include high fever (41.5°C), severe coughing, abdominal breathing, swollen joints, and central nervous system clinical signs such as lateral decubitus, paddling, and trembling (Nielsen & Danielsen, 1975; Solano et al., 1997; Vahle et al., 1995). Chronically affected animals may have a reduced growth rate as a result of severe fibrous polyserositis and arthritis. Dyspnea and coughing not associated to Glässer’s disease have been described together with H. parasuis isolation from lungs with catarrhal-purulent bronchopneumonia and even fibrino-hemorrhagic pneumonia (Dungworth, 1993; Little, 1970; Narita et al., 1994).. 4.2. Laboratory diagnosis Diagnosis is based on herd history, clinical signs and necropsy, although bacterial isolation is needed for confirmation. The isolation of the strain responsible of an outbreak is of great interest since it allows the implementation of other tests, primarily antimicrobial sensitivity, serotyping or genotyping.. 4.2.1. Bacterial isolation Since the first description of H. parasuis, the gold standard for the diagnosis of Glässer’s disease continues to be the isolation of H. parasuis from lesions of a pig showing the clinical signs of the disease. Necropsy should be performed not only on severely affected animals, but also on animals in the acute phase of the disease, prior to 17.
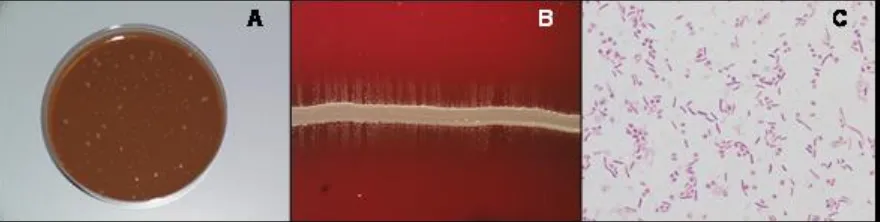
(16) Introduction. treatment with antibiotics. The best samples for bacterial isolation are swabs and body fluids from systemic lesions in cases of fibrinous polyserositis, including cerebrospinal fluid when central nervous signs are present (Solano et al., 1997; Vahle et al., 1995). The significance of lung isolates is a controversial subject. On one hand, H. parasuis can be involved in pneumonia, but on the other hand, the presence of the bacterium in the lung could be a consequence of post-mortem invasion from the upper respiratory tract, where H. parasuis is commonly found (Harris et al., 1969; Moller & Kilian, 1990). Consequently, lung samples should not be used to diagnose systemic infection. The transportation of samples to the laboratory should be in Amies medium (del Rio et al., 2003b) as fast as possible and under refrigeration.. Fig 3.A. Strain showing double morphology growing on agar chocolate. B. Staphylococcus nurse steak and H. parasuis satellite growth. C. Gram staining. In the laboratory, H. parasuis grows on enriched chocolate agar but not in blood agar. Traditionally, it has been isolated in blood agar by satellite growth around a Staphylococcus nurse steak, which provides the required Factor V. It requires 24 to 72 hours to grow at 37ºC and 5% CO2. Colonies on chocolate agar plates are smooth, greyish to brown, translucent, reaching a diameter of 0.5–2 mm. Some strains produce colonies of different sizes, but the significance of this phenomenon is not known. When a liquid culture is needed (e.g. for biochemical tests), H. parasuis can be cultured in BHI or PPLO broth supplemented with NAD.. 4.2.2. H. parasuis identification: biochemical tests and PCR. H. parasuis is microscopically characterized by small, pleomorphic, non-motile, gram negative rods varying from single coccobacilli to long, thin filamentous chains. Many biochemical tests to discriminate H. parasuis have been assayed in previous works (Kielstein et al., 2001; Moller & Kilian, 1990; Rapp-Gabrielson et al., 2006), although only a few of them are really characteristic of H. parasuis. Table 3 includes 18.
(17) Introduction. the biochemical test used to differentiate H. parasuis from other Pasteurellaceae that can be isolated from the upper respiratory tract of pigs (Actinobacillus minor, A. porcinus, A. indolicus, Taxon C and A. pleuropneumoniae). In our experience, catalase, indole, urease and β-galactosidase tests are the most helpful to differentiate them. The introduction of molecular methods, mostly PCR, was a major advance for the diagnosis of infectious diseases, in particular when dealing with poorly growing microbes. Due to the fastidious growth of H. parasuis, the development of a specific PCR supposed an improvement in the detection of this bacterium (Oliveira et al.,. Actinobacillus suis. + - d + d d - + + - - - + - d - d - - d + - - - + + d + d - d + + d d + - d - + - - d +. d + + + -. + + + N + + N N N N. Nitrate reduction ONPG (beta-galactosidase) Alkaline phosphatase H2S production Ornithine decarboxilase Esculin hydrolysis NAD requirement X- factor requirement beta-haemolysis of sheep blood cells Lysine descarboxilase. + + + d + -. + + + + + -. + + + + + + + - - + - + - -. + > 90% positive strains - < 10% positive strains d 89-11% positive strains N non tested. + + + + + -. d + d d + -. + + + + + -. Arginine dihydrolase cAMP reaction D-Glucose, gas production Dulcinol, acid Fructose, acid D-Galactose, acid D-Glucose, acid Lactose, acid Maltose, acid D-Manitol, acid D-Manose, acid L-Rhamhose Salicin, acid D-Sorbitol, Acid Starch, acid Sucrose, acid Threalose, acid D-Xylose, acid beta-Glucoronidase Neuroaminidase CO2 improved growth D-(+)-Melibiose gamma-aminoleulinic, acid. Actinobacillus indolicus Actinobacillus minor Actinobacillus porcinus Taxon C Actinobacillus pleuropneumoniae Actinobacillus suis. Taxon C. Actinobacillus pleuropneumoniae. + d + + + -. Actinobacillus porcinus. Actinobacillus indolicus. Catalase Oxidase Indole production Urease alpha-fucosidase L-arabinose, acid Inulin, acid Raffinose, acid D-Ribose alpha.Glucosidase Nitrite reduction Inositol. Actinobacillus minor. Haemophilus parasuis. General characteristics: Type strain 1372 of Shorpe. NCTC 4557. 16s rRNA gene sequence (NCBI) M75065. Gram negative. Mol % G+C = 41-42 Tm. Haemophilus parasuis. 2001a).. + + + d + + N + d d +. + + + d + d + d d + d d d +. + + + + + + d d + d d d +. d d d d d d d d d + d d d d +. N N + + + + N + d. + + + + + + + + + d. + + + + + + + d + + + N N N N. References: Rapp-Gabrielson et al. 2006 Moller et al. 1990 Kielstein et al. 2001. Table 2. Biochemical test for H. parasuis differentiation from other Pastereullaceae isolated from swine. The first twelve tests have been described in the literature as the most discriminative. The primers for this PCR were designed to amplify a fragment of 821 bp from the 16S rRNA gene. The sensitivity of this PCR was 102 CFU/ml and was proven to be useful on clinically significant samples. On the other hand, it can not be used in nasal swabs due to the presence of H. parasuis in the upper respiratory tract of healthy 19.
(18) Introduction. animals and a weak positive reaction with A. indolicus, which is also a colonizer of the upper respiratory tract of pigs. Both aspects limit the use of this PCR for living animals. A recent development of a nested-PCR increased the sensitivity of the technique (Jung et al., 2004). They used the specific conventional PCR described above followed by amplification of an internal 313 bp fragment. With these conditions, the sensitivity was increased to 3 CFU/ml, but the specificity was not improved.. 5. H. parasuis epidemiology There is a general need for techniques to unambiguously characterize strains for bacterial epidemiology. The differentiation of strains is particularly important in today’s world to track virulent strains, new disease causing strains, monitor vaccination strategies or antibiotic resistance (Clarke, 2002). Thus, the identification of bacterial strains has applications in local and global epidemiology. Local epidemiology study the strains involved in a specific outbreak or, in the case of persistent infection, if the treatment failed or new virulent strains have been introduced. Global epidemiology studies the relationship of particular strains with those isolated in other areas or times; i.e. the relationships between different clonal lines, their global distribution and the determinants that cause those distributions. There are many approaches to bacterial typing, but all of them must fulfil several criteria (Olive & Bean, 1999): - All organisms within a species must be typeable. - It must have high power of discrimination. - It should be reproducible. - Unrelated strains must be clearly differentiated and, at the same time, demonstrate the relationship between them. Finally, the ability to analyze large numbers of samples in a timely manner is also important, since epidemiologic studies usually involve large numbers of samples. In summary, the strengths and weakness of a typing technique depend on its relative discriminatory power, reproducibility, cost and timing (Foxman et al., 2005). Heterogeneity of H. parasuis strains has already been reported by phenotypic traits, such as whole cell and outer-membrane protein profiles (Oliveira & Pijoan, 2004a; Rapp et al., 1986; Ruiz et al., 2001), multilocus enzyme electrophoresis (Blackall et al., 1997) and experimental infections (Table 3). Therefore, differentiation 20.
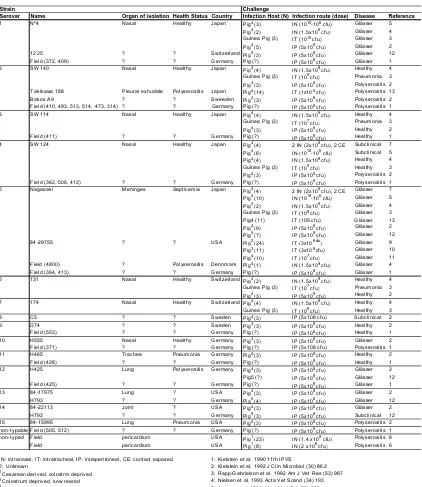
(19) Introduction. of strains is also important in H. parasuis diagnosis and control, since it is essential to differentiate between “colonizer” and “disease-causing” strains. The association between phenotypic or genotypic features and the virulence of different H. parasuis strains has been widely studied. Strain Serovar 1. Name Nº4. Organ of isolation Health Status Country Nasal Healthy Japan. Challenge Infection Host (N) 4 Pig (3) 4 Pig (2) Guinea Pig (3). 2. 1225 Field (372, 409) SW140. ? ? Nasal. ? ? Healthy. Pig (5) Switzerland Pig5 (3) Germany Pig (?) 4 Japan Pig (4) Guinea Pig (3). 3. Takikawa 188 Bakos A9 Field (410, 493, 513, 514, 473, 314) SW114. Pleural exhudate ? ? Nasal. Polyserositis ? ? Healthy. Japan Sweeden Germany Japan. 4. Field (411) SW124. ? Nasal. ? Healthy. Germany Japan. 5. Field (362, 506, 412) Nagasaki. ? Meninges. ? Septicemia. Germany Japan. 84-29755. ?. ?. USA. 6. Field (4800) Field (364, 413) 131. ? ? Nasal. Polyserositis ? Healthy. Dennmark Germany Switzerland Pig4 (2) Guinea Pig (3). 7. 174. Nasal. Healthy. 8 9. C5 D74 Field (553) H555 Field (371) H465 Field (428) H425. ? ? ? Nasal ? Trachea ? Lung. ? ? ? Healthy ? Pneumonia ? Polyserositis. ? Lung ? Joint ? Lung ? pericardium pericardium. ? ? ? ? ? Pneumonia ?. 4. 4. Pig (3) 4 Pig (14) 4 Pig (3) Pig (?) 4. Pig (4) Guinea Pig (3) 4. Pig (3) Pig (?) 4. Pig (4) 4 Pig (6) 4 Pig (4) Guinea Pig (3) 4. Pig (3) Pig (?) 4. Pig (4) 4 Pig (10) 4 Pig (2) Guinea Pig (3) Pig4 (11) 4 Pig (9) 5 Pig (?) 2 Pig (24) 3 Pig (11) 4 Pig (10) 4 Pig (1) Pig (?). 4. 10 11 12. Field (425) 84-17975 H793 14 84-22113 H792 15 84-15995 non-typable Field (505, 512) non-typed Field Field 13. IN: intranasal, IT: intratracheal, IP: intraperitoneal, CE: contact exposed. ?: Unknown Cesarean derived, colostrm deprived 2 Colostrum deprived, sow reared 3 Naturally farrowed, artificially reared 4 Specific pathogen free 5 Seronegative pigs 1. Pig (3) Switzerland Pig4 (4) Guinea Pig (3) 4 Sweden Pig (3) 4 Sweden Pig (3) Germany Pig (?) 4 Germany Pig (3) Germany Pig (?) 4 Germany Pig (3) Germany Pig (?) 4 Germany Pig (3) Pig5 (?) Germany Pig (?) 4 USA Pig (3) 5 Germany Pig (4) 4 USA Pig (3) 5 Germany Pig (3) 4 USA Pig (3) Germany Pig (?) 1 USA Pig (23) 1 USA Pig (8). Infection route (dose) 10 6 IN (10 -10 cfu) 9 IN (1.5x10 cfu) 10 IT (10 cfu) 8 IP (5x10 cfu) 8 IP (5x10 cfu) 8 IP (5x10 cfu) 9 IN (1.5x10 cfu) 9 IT (10 cfu) 8 IP (5x10 cfu) 5 IT (1x10 cfu) 8 IP (5x10 cfu) 8 IP (5x10 cfu) 9 IN (1.5x10 cfu) 7 IT (10 cfu) 8 IP (5x10 cfu) 8 IP (5x10 cfu) 8 2 IN (2x10 cfu), 2 CE 10 6 IN (10 -10 cfu) 9 IN (1.5x10 cfu) 9 IT (10 cfu) 8 IP (5x10 cfu) 8 IP (5x10 cfu) 8 2 IN (2x10 cfu), 2 CE 10 6 IN (10 -10 cfu) 9 IN (1.5x10 cfu) 9 IT (10 cfu) IT (105 cfu) 8 IP (5x10 cfu) 8 IP (5x10 cfu) 9 cfu IT (3x10 ) 9 IT (3x10 cfu) 7 IT (10 cfu) 9 IN (1.5x10 cfu) 8 IP (5x10 cfu) 9 IN (1.5x10 cfu) 7 IT (10 cfu) 8 IP (5x10 cfu) 9 IN (1.5x10 cfu) 9 IT (10 cfu) IP (5x10⁸ cfu) 8. IP (5x10 cfu) 8 IP (5x10 cfu) 8 IP (5x10 cfu) IP (5x10⁸ cfu) 8 IP (5x10 cfu) 8 IP (5x10 cfu) 8 IP (5x10 cfu) 8 IP (5x10 cfu) 8 IP (5x10 cfu) 8 IP (5x10 cfu) 8 IP (5x10 cfu) 8 IP (5x10 cfu) 8 IP (5x10 cfu) 8 IP (5x10 cfu) 8 IP (5x10 cfu) 8 IN (1.4 x10 cfu) 8 IN (2 x10 cfu). Disease Glässer Glässer Glässer Glässer Glässer Glässer Healthy Pneumonia Polyserositis Polyserositis Polyserositis Polyserositis Healthy Pneumonia Healthy Healthy Subclinical Subclinical Healthy Healthy Polyserositis Polyserositis Glässer Glässer Glässer Glässer Glässer Glässer Glässer Glässer Glässer Glässer Glässer Glässer Healthy Pneumonia Healthy Healthy Healthy Subclinical Healthy Healthy Glässer Polyserositis Healthy Healthy Glässer Glässer Glässer Glässer Glässer Glässer Subclinical Polyserositis Polyserositis Polyserositis Polyserositis. Reference 5 4 3 2 12 1 4 3 2 13 2 1 4 3 2 1 7 5 4 3 2 1 7 5 4 3 13 2 12 9 10 11 4 1 4 3 2 4 3 2 2 1 2 1 2 1 2 12 1 2 12 2 12 2 1 8 6. 1: Kielstein et al. 1990 11th IPVS 2: Kielstein et al. 1992 J Clin Microbiol (30) 862 3: Rapp-Gabrielson et al. 1992 Am J Vet Res (53) 987 4: Nielsen et al. 1993 Acta Vet Scand (34) 193 5: Amano et al. 1994 J Vet Med Sci (56) 639 6: Vahle et al. 1995 J Vet Diagn Invest (7) 476 7: Amano et al. 1996 J Vet Med Sci (58) 559. Table 3. Experimental challengues with different H. parasuis strains using different experimental models. 5.1. Serotyping Traditionally, the classification of H. parasuis strains has been performed by serotyping. In 1992, Kielstein and Rapp-Gabrielson defined 15 serovars based on heat-. 21.
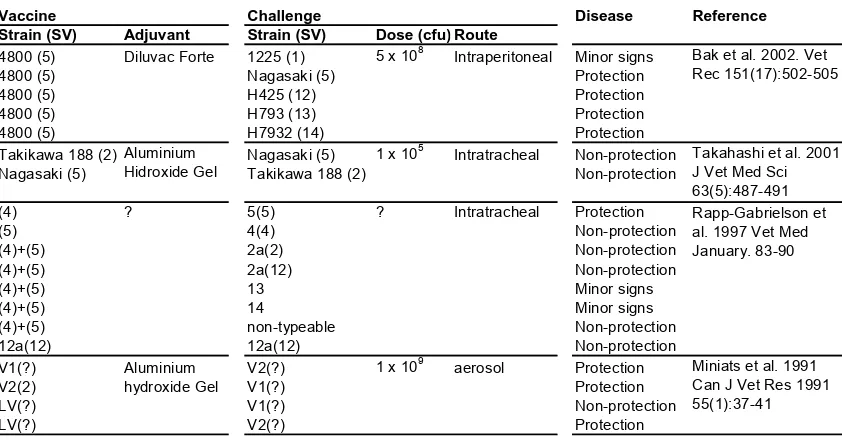
(20) Introduction. stable somatic antigen and using immunodiffusion. Unfortunately, up to a 41% of field strains were non-typeable (Kielstein & Rapp-Gabrielson, 1992). The reference strains for each serotype were also tested in animal infections and differences in virulence were demonstrated (Table 3). Later, the same serotyping scheme was improved by using indirect haemagglutination (Del Rio et al., 2003a; Tadjine et al., 2004b), but still, a 15% of the strains remained non-typeable (Oliveira & Pijoan, 2004b). Year. Country (N). Method. 2004-2002 China (281). IHA+IMD. Serovar 1 2 <0.1 2.5. Published Austalia (72) China (9) in 2005 Published Australia (46) in 2000 1992-1989 Australia (31). IHA+IMD. 1.2. IMD. 3.2. 3.2. 12.9 22.6. 2002-1991 Canada (250) USA (50). IMD. 3.0. 8.0. 1.0 27.0 15.0. 2001-1999 USA (98). IMD. IMD. 1990-1982 Canada (108) USA (120) IMD Australia (10) Brazil (5) 2002-1998 Dennmark (103) IHA+IMD 2003. 1.2. 3. 1.2 25.9 17.3. 4.3. 4 5 24.2 19.2. 2.2. 6 7 <0.1 2.1. 8. 9 10 11 <0.1 <0.1 1.8. 39.1 6.5 11.0. 7.1. 4.1. 8.2 38.8 2.0. 8.3. 1.2 16.1 24.3. 0.4. 3.7. 1.2. 1.0. 2.0. 14.0 36.0. 2.0. 3.0. 2.0. 8.2. 13 14 12.5 7.1. 2.5. 3.7. 4.3. 8.7. 3.2. 19.3. 8.0. 13.0 3.0. 6.0. 2.0. 1.0. 15 2.5. 1.2. Reference NT 12.1 Cai et al. 2005 25.9 Turni et al. 2005 41.3 Raffie et al. 2000. 29.0 Blackall et al. 1996 10.0 Tadjine et al. 2004 7.1 1.0 3.1 26.5 Oliveira et al. 2003 0.8 6.6 11.1 8.6 0.4 15.2 Rapp-Gabrielson et al. 1992 3.0 22.0 1.0 2.0 15.0 Angen et al. 2004 <0.1 <0.1 <0.1 14.3 30.1 Docic et al. 2004. 1.0. 2.1. 12 6.8. 2.0. Hungary Romania Servia (total= 903) 2002-1998 Spain (67). IMD. <0.1 11.5. IHA. 6.0. 4.0. 2.0 13.0 15.0. 30.5 1.0. 7.0. 2.0. 1997-1993 Spain (174). IHA. 2.8. 9.2. 16.0 18.4. 2.3. 4.0. 0.6 1.7. 0.6. 1.2. 2.9. 8.0. 2.9. 1991-1987 Germany (290). IHA. 4.1. 5.5. 1.4 17.2 23.8. 1.7. 2.1. 4.1. 2.4. 2.4. 2.8. 4.5. 1.7. 2.0. 0.7. 9.0. del Rio et al. 2003 29.3 Rubies et al. 1999 26.2 Kielstein et al. 1992. Table 4. Serotype prevalence in different countries. Vaccine Strain (SV) 4800 (5) 4800 (5) 4800 (5) 4800 (5) 4800 (5) Takikawa 188 (2) Nagasaki (5) (4) (5) (4)+(5) (4)+(5) (4)+(5) (4)+(5) (4)+(5) 12a(12) V1(?) V2(2) LV(?) LV(?). Adjuvant Diluvac Forte. Aluminium Hidroxide Gel ?. Aluminium hydroxide Gel. Challenge Strain (SV) Dose (cfu) Route 8 5 x 10 Intraperitoneal 1225 (1) Nagasaki (5) H425 (12) H793 (13) H7932 (14) 5 1 x 10 Nagasaki (5) Intratracheal Takikawa 188 (2). Disease. Reference. Minor signs Protection Protection Protection Protection Non-protection Non-protection. Bak et al. 2002. Vet Rec 151(17):502-505. 5(5) 4(4) 2a(2) 2a(12) 13 14 non-typeable 12a(12) V2(?) V1(?) V1(?) V2(?). Protection Non-protection Non-protection Non-protection Minor signs Minor signs Non-protection Non-protection Protection Protection Non-protection Protection. ?. Intratracheal. 9. 1 x 10. aerosol. Takahashi et al. 2001 J Vet Med Sci 63(5):487-491 Rapp-Gabrielson et al. 1997 Vet Med January. 83-90. Miniats et al. 1991 Can J Vet Res 1991 55(1):37-41. Table 5. Vaccination and protection to homologous and heterologous serovars challenges.. This could be indicative of the existence of additional antigenic diversity as suggested by subsequent studies (Blackall et al., 1996; Blackall et al., 1997). Besides, serotyping does not provide enough discrimination of isolates for epidemiological studies. Despite 22.
(21) Introduction. these limitations, serotyping has been the typing technique most widely used so far and many efforts have been made to correlate serotype with virulence and cross-immunity. Consequently, there are many reports on serotype prevalence in several countries (Table 4). Serotyping has also been commonly used to assist in vaccine implementation and failure, but the cross-protection between different serotypes is variable and difficult to predict. A summary of the studies on cross-protection is presented in Table 5.. 5.2. Genotyping The use of phenotypic traits for typing, such as serotype, can present typeability problems. To overcome those limitations several typing methods based on DNA have been developed. A brief description of all the techniques available is summarized in Table 6. Molecular techniques represent a major advance for epidemiological studies, since they allow the unambiguous identification of every isolate in a timely manner. However, they do not offer any direct functional information, and genotypes have to be correlated with immunological or virulence features using complementary data. Genotyping is carried out by fingerprinting or sequencing methods (Table 6). Fingerprints (or electrophoretic band patterns) can be obtained from whole bacterial genome or from a single gene. In whole genome techniques, band patterns are produced by digestion of genomic DNA with restriction endonucleases or by PCR amplification with primers targeted against loci spread throughout the genome (Foxman et al., 2005). The potential of obtaining a representation of the whole genome is the strongest point of these methods. Actually, there are serious doubts about the characterization of bacteria by a single gene. The reason is that in species with high recombination rates, they can lead to misleading results. Single gene patterns usually employ an initial gene-specific PCR followed by digestion of the amplicon with restriction endonucleases. While whole genome patterns evolve mainly by genome rearrangements, which imply mobile genetic elements (Gurtler & Mayall, 2001); single gene patterns evolve by single point mutation. Obviously, all typing techniques have to be validated with enough number of strains to demonstrate their level of resolution. Although the information on the genomic sequence of H. parasuis is limited and complicates the development of improved diagnostic and control tools, several research 23.
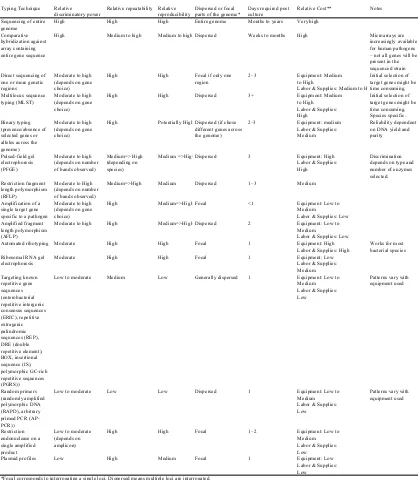
(22) Introduction. groups have attempted to improve the differentiation of field strains by the following genotyping techniques. Typing Technique. Relative discriminatory power High. High. Days required post culture Months to years. Very high. High. Medium to high. Medium to high Dispersed. Weeks to months. High. Direct sequencing of one or more genetic regions Multilocus sequence typing (MLST). Moderate to high (depends on gene choice) Moderate to high (depends on gene choice). High. High. Focal if only one region. 2–3. High. High. Dispersed. 3+. Binary typing (presence/absence of selected genes or alleles across the genome) Pulsed-field gel electrophoresis (PFGE). Moderate to high (depends on gene choice). High. Potentially High Dispersed (if chose different genes across the genome). 2–3. Moderate to high (depends on number of bands observed). Medium=> High (depending on species). Medium =>HighDispersed. 3. Equipment: High Labor & Supplies: High. Restriction fragment length polymorphism (RFLP) Amplification of a single target gene specific to a pathogen Amplified fragment length polymorphism (AFLP) Automated ribotyping. Moderate to High (depends on number of bands observed) Moderate to high (depends on gene choice) Moderate to high. Medium=>High. Medium. 1–3. Medium. High. Medium=>High Focal. <1. High. Medium=>High Dispersed. 2. Moderate. High. High. Focal. 1. Ribosomal RNA gel electrophoresis. Moderate. High. High. Focal. 1. Targeting known repetitive gene sequences (enterobacterial repetitive intergenic consensus sequences (ERIC), repetitive extragenic palindromic sequences (REP), DRE (double repetitive element), BOX, insertional sequence (IS), polymorphic GC-rich repetitive sequences (PGRS)) Random primers (randomly amplified polymorphic DNA (RAPD), arbitrary primed PCR (APPCR)) Restriction endonuclease on a single amplified product Plasmid profiles. Low to moderate. Medium. Low. Generally dispersed. 1. Equipment: Low to Medium Labor & Supplies: Low Equipment: Low to Medium Labor & Supplies: Low Equipment: High Labor & Supplies: High Equipment: Low Labor & Supplies: Medium Equipment: Low to Medium Labor & Supplies: Low. Low to moderate. Low. Low. Dispersed. 1. Equipment: Low to Medium Labor & Supplies: Low. Low to moderate (depends on amplicon). High. High. Focal. 1–2. Low. High. Medium. Focal. 1. Equipment: Low to Medium Labor & Supplies: Low Equipment: Low Labor & Supplies: Low. Sequencing of entire genome Comparative hybridization against array containing entire gene sequence. Relative repeatability Relative Dispersed or focal reproducibility parts of the genome* High Entire genome. Dispersed. Relative Cost**. Notes. Microarrays are increasingly available for human pathogens – not all genes will be present in the sequenced strain Equipment: Medium Initial selection of to High target genes might be Labor & Supplies: Medium to H time consuming. Equipment: Medium Initial selection of to High target genes might be Labor & Supplies: time consuming. High Species specific. Equipment: medium Reliability dependent Labor & Supplies: on DNA yield and Medium purity. Discrimination depends on type and number of enzymes selected.. Works for most bacterial species. Patterns vary with equipment used. Patterns vary with equipment used. *Focal corresponds to interrogating a single loci. Dispersed means multiple loci are interrogated. **Per isolate costs in US dollars in 2005, assuming all equipment are available, and the investigator has access to automatic sequencing, for PCR reactions are ~$5, PFGE~$20, MLST ~$140, comparative hybridization~$1000 to $2000 and total genomic sequencing (assuming a strain has already been sequenced)~$100,000 to $500,000. Note: For a summary and details of these techniques, and assessments of repeatability and reproducibility, see Tenover, 1997 [1], Gurtler and Mayall 2001 [2] and VanBelkum, 2003 [3]. In general, sequence-based methods are most repeatable and reproducible. Gel-based methods are less so, because of the inherent variability of the technique.. Table 6. Comparison of common bacterial typing techniques based on relative discriminatory power, reproducibility, repeatability, time required, cost and whether they give information on dispersed or focal parts of the genome. Taken from (Foxman et al., 2005). 5.2.1. Restriction Endonuclease Pattern (REP) The first DNA-based typing technique for H. parasuis was developed by Smart et al. (Smart et al., 1988). This technique consists in the digestion of highly pure. 24.
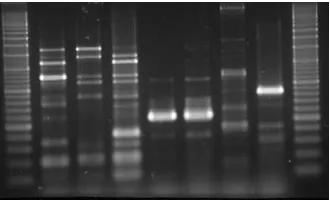
(23) Introduction. genomic DNA with restriction endonucleases and the subsequent analysis of the fragments by polyacrylamide gel electrophoresis (SDS-PAGE). In summary, 24 genotypes out of 69 isolates were detected using restriction endonuclease polymorphism. Moreover, using this scheme different strains isolated from the same herd were identified (from 2 to 4 in a farm), and even from a single animal (Smart et al., 1988; Smart et al., 1993; Smart et al., 1989). When compared to SPF herds, conventional herds had a more heterogeneous population of H. parasuis strains. Interestingly, strains isolated from systemic sites of diseased animals were different than those found in the upper respiratory tract of healthy animals. The same scheme was used to assess vaccination failure in a Glässer’s outbreak (Smart et al., 1993). It was found that nasal isolates and isolates from diseased animals were different from the commercial bacterin used. The lack of cross-protection between H. parasuis strains is well known, and the outbreak was controlled using an autogenous bacterin (Smart & Miniats, 1989; Smart et al., 1988; Smart et al., 1993; Smart et al., 1989).. 5.2.2. Enterobacterial Repetitive Intergenic Consensus (ERIC)-PCR Repetitive element polymorphism-PCR typing methods are based on the presence of DNA elements that are repeated throughout the genome of different bacterial species (Versalovic & Lupski, 2002). These sequences are used to design primers for PCR amplification, so different size amplicons are generated in the same reaction. Several set of repetitive elements have been detected and used in different bacterial genomes: REP, BOX, and ERIC (Versalovic et al., 1991).. Fig 4. ERIC-PCR fingerprint of different H. parasuis strains. In 2000, Raffie et al. applied two primers directed against enterobacterial repetitive intergenic consensus (ERIC) to generate band patterns from H. parasuis strains (Rafiee et al., 2000). The optimal conditions for the ERIC primers were established and DNA of H. parasuis strains was amplified, with the generation of random patterns (Fig 4). This technique uses primers whose targets are repetitive. 25.
(24) Introduction. sequences in non-coding regions (Versalovic et al., 1991) and produce the amplification of the sequences between them. The patterns evolve mainly by deletion and insertion of different mobile elements and genomic rearrangements. ERIC-PCR is especially suitable for outbreak studies, since it is fast, with a low cost, and allows the confirmation of the source of infection and the number of strains involved. On the other hand, ERIC-PCR patterns present a very high variation, which makes complex to establish the relationship between strains if they are not closely related. Moreover, the poor reproducibility and portability of the ERIC-PCR results makes very difficult to share this information between laboratories (Foxman et al., 2005). On the other hand, ERIC-PCR is more convenient than REP, since REP patterns are considerably complex (up to 100 bands) and its implementation is highly demanding. ERIC-PCR has been used in several local epidemiological studies (Oliveira et al., 2003; Ruiz et al., 2001). Using ERIC-PCR, 34 genotypes out of 98 isolates were reported. Those studies confirmed previous results by REP, and identified a common origin for systemic isolates in an outbreak affecting several farms. Interestingly, profiles from systemic isolates suggested a clonal origin and were different from other nonsystemic isolates or reference strains. They also showed that few strains are involved in clinical outbreaks and their fingerprints were rarely found in isolates from the upper respiratory tract. Controversially, it was also established that the ERIC patterns of isolates from systemic and pneumonic sites were related. Furthermore, this study confirmed the high heterogeneity of H. parasuis already reported by REP and serotyping (Blackall et al., 1997; Del Rio et al., 2003a; Kielstein & Rapp-Gabrielson, 1992; Tadjine et al., 2004b). Interestingly, a high genetic diversity was also described within serovar groups and non-typeable strains. ERIC-PCR pattern was found to be a reasonable predictor of serotype, although there was no complete agreement.. 5.2.3. Restriction Fragment Length Polymorphism-PCR Recently, several restriction fragment length polymorphism (RFLP)-PCR protocols have been developed. These techniques consist in the amplification of a specific gene and its subsequent digestion with restriction endonucleases. The fragments are then analyzed by electrophoresis in agarose. The main advantage of this strategy is that, if the PCR is species-specific, it eliminates the need for bacterial isolation and the technique can be performed directly on clinical samples. Furthermore, RFLP-PCR is more repetitive than ERIC-PCR due to the use of higher stringency conditions. Three 26.
(25) Introduction. RFLP-PCR schemes have been developed for H. parasuis. The selected genes were the transferin binding protein A (tbpA) (de la Puente Redondo et al., 2003), the 16s rRNA gene (amplified by the above described diagnostic PCR) (Lin, 2003) and the 5enolpyruvylshikimate-3-phosphate synthase (aroA) (del Rio et al., 2006b). Using RFLP-PCR of the tbpA gene 33 genotypes were defined in 101 clinical isolates. The RFLP-PCR schemes for the tbpA and the 16s rRNA gene confirmed once more the high heterogeneity of H. parasuis and the lack of a clear correlation between genotype and serotype. In addition, some different serovars were indistinguishable by those RFLP techniques. The aroA RFLP-PCR uses a non-species specific PCR that amplifies this gene from H. parasuis and several members of the genus Actinobacillus; therefore, isolation and identification is strictly necessary to use this genotyping technique. Curiously, some of the reference strains of H. parasuis shared RFLP patterns with those of A. pleuropneumoniae. Although the causes for this finding are not discussed, a lateral gene transfer can not be discarded.. 5.2.4. Analysis of electrophoretic patterns To obtain information about the relationships among different isolates from fingerprinting data, dendograms are often constructed. With this purpose, several specialized algorithms have been developed and very sophisticated software is available (Applied. Maths,. BioNumerics,. BioRad,. Biosystematics,. Media. Cybernetics,. Scanalytics). Before the analysis, the creation of digital pictures is required in order to detect bands and compare the different profiles. A distance pairwise matrix can be constructed based on the bands present (or absent) between each fingerprint pair. Many algorithms for the calculation of those distances have been proposed (van Ooyen, 2001) and they can be based on band presence or intensity. Frequently, the use of Pearson correlation to construct the matrix and UPGMA to construct the dendogram is recommended (van Ooyen, 2001); although the latter can not detect zero length branches and NJ will probably be better (Hall & Barlow, 2006). Almost all software includes normalization modules to optimize comparisons between different gels. Still, the variability between gels makes these comparisons less than optimal and it is an important pitfall. To avoid those limitations sequencing methods have been proposed, since chromatograms are easy to share and compare.. 27.
(26) Application of molecular techniques to the diagnosis and epidemiology of Haemophilus parasuis. 28.
(27) Application of molecular techniques to the diagnosis and epidemiology of Haemophilus parasuis. Hypothesis All the typing techniques developed to date for H. parasuis are based on different band size patterns comparisons. Even though recent developments have enhanced the reproducibility of these techniques, they do not get around the fact that the data generated is difficult to share and compare globally (Clarke, 2002). On the other hand, the genotype has indirectly been related with virulence in H. parasuis strains, since genotypes isolated from systemic lesions were unusually found in respiratory isolates. But fingerprinting methods can hardly be used in global epidemiological studies, since they are poorly portable and provide reduced information on the relationship between clusters. Thus, an improved typing method useful for global studies was needed. Sequencing based methods are probably the best choice, mainly when DNA sequencing is becoming more accessible and inexpensive every day. Besides, chromatograms are easy to share between laboratories and the phylogenetic analysis of DNA sequences provides an adequate framework to elucidate distant relationships among strains (Hall & Barlow, 2006). Although several conserved genes of H. parasuis can be amplified and have been used in taxonomic studies (Christensen et al., 2004), they have never been evaluated in genotyping studies. Summarizing, a better understanding of the relationship between different strains and virulence potential or protective immunity is needed to control disease, since H. parasuis strains differ in phenotypic and genotypic features, and, more importantly, in virulence. In addition, it has been shown that strains isolated from the upper respiratory tract of healthy animals are genetically different from those isolated from systemic lesions of diseased animals. Therefore, our hypothesis is that differences in pathogenic capacity are reflected at the genomic level: the genetic background of strains with different clinical origin should be divergent enough to be differentiated with the appropriate technique.. 29.
(28) Application of molecular techniques to the diagnosis and epidemiology of Haemophilus parasuis. Objectives The main goal of this work was to develop a typing method with enough resolution, unambiguous, and easy to share between laboratories to differentiate H. parasuis subpopulations with different clinical significance. Genotyping methods fulfil those requirements, and especially sequence-based techniques. Therefore, we specifically aimed to: 1. Establish the applicability of a single locus sequence typing method, using partial sequencing of the hsp60 gene, for the classification of H. parasuis strains from different clinical backgrounds. 2. Develop a multilocus sequence typing method for fine epidemiological studies of H. parasuis strains from different clinical backgrounds. 3. Study the correlation between specific genomic clusters, established in aim 1 and 2, and the virulence of the strains.. 30.
(29) Results. Results. Chapter 1. “Genotypic diversity of Haemophilus parasuis Field Strains”. 31.
(30) Results. 32.
(31) Results. 33.
(32) Results. 34.
(33) Results. 35.
(34) Results. 36.
(35) Results. 37.
(36) Results. 38.
(37) Results. 39.
(38) Results. 40.
(39) Results. 41.
(40) Results. 42.
(41) Results. Chapter 2. “Study of the population structure of Haemophilus parasuis by multilocus sequence typing”. 43.
(42) Results. 44.
(43) Results. 45.
(44) Results. 46.
(45) Results. 47.
(46) Results. 48.
(47) Results. 49.
(48) Results. 50.
(49) Results. 51.
(50) Results. 52.
(51) Results. Supplemented table S1. List of strains with their correspondent sequence type (ST), allelic profile, clonal complex (in numbers), UPGMA cluster (in letters), organ and country of isolation.. 53. Strain. ST. Burst. UPGMA. Organ. Country. 279/03. 92. rpoB 6pgd mdh 22. 31. 7. infB 16. frdB g3pd atpD 11. 1. 6. 1. A. Trachea. Spain. AZ6-3. 99. 26. 1. 7. 16. 11. 1. 6. 1. A. Nasal. Spain. AZ8-5. 99. 26. 1. 7. 16. 11. 1. 6. 1. A. Nasal. Spain. CN8-1. 59. 12. 1. 13. 16. 11. 1. 6. 1. A. Nasal. Spain. VC8-3. 56. 12. 1. 13. 16. 14. 3. 6. 1. A. Nasal. Spain. IQ7N-7. 56. 12. 1. 13. 16. 14. 3. 6. 1. A. Nasal. Spain. IQ9N-3. 56. 12. 1. 13. 16. 14. 3. 6. 1. A. Nasal. Spain. NU5-3. 57. 12. 1. 10. 16. 1. 1. 6. 1. A. Nasal. Spain. ND14-1. 97. 26. 1. 10. 16. 12. 1. 6. 1. A. Nasal. Spain. ND19-2. 97. 26. 1. 10. 16. 12. 1. 6. 1. A. Nasal. Spain. PM2-2b. 97. 26. 1. 10. 16. 12. 1. 6. 1. A. Nasal. Spain. VC3-1. 58. 12. 1. 10. 16. 14. 1. 6. 1. A. Nasal. Spain. PM1-1. 98. 26. 1. 10. 8. 12. 1. 6. 1. A. Nasal. Spain. F9. 43. 9. 13. 10. 14. 11. 1. 6. 6. A. Nasal. Spain. VB5-5. 44. 9. 13. 10. 16. 11. 1. 6. 6. A. Nasal. Spain. 416-1. 44. 9. 13. 10. 16. 11. 1. 6. 6. A. Nasal. Spain. VS6-10. 44. 9. 13. 10. 16. 11. 1. 6. 6. A. Nasal. Spain. VS7-6. 44. 9. 13. 10. 16. 11. 1. 6. 6. A. Nasal. Spain. FL1-3. 39. 7. 29. 16. 14. 12. 1. 6. 8. A. Nasal. Spain. N139/05-4. 34. 7. 19. 16. 16. 12. 1. 6. 8. A. Nasal. Spain. N140/05-4. 34. 7. 19. 16. 16. 12. 1. 6. 8. A. Nasal. Spain. SR103-1. 34. 7. 19. 16. 16. 12. 1. 6. 8. A. Nasal. Spain. SC12-1. 71. 16. 21. 13. 17. 12. 1. 9. 13. A. Nasal. Spain. SC18-4. 71. 16. 21. 13. 17. 12. 1. 9. 13. A. Nasal. Spain. SC14-1. 72. 16. 21. 13. 16. 12. 1. 9. 13. A. Nasal. Spain. CC2-2. 69. 16. 10. 13. 33. 12. 1. 11. Singleton. A. Nasal. Spain. 7204167-1. 93. 22. 33. 8. 16. 12. 1. 20. Singleton. A. Unknown. Denmark. CN9-2. 109. 31. 21. 13. 17. 14. 1. 11. Singleton. A. Nasal. Spain. MU21-2. 66. 14. 18. 15. 16. 14. 1. 6. Singleton. A. Nasal. Spain. MU25-5. 66. 14. 18. 15. 16. 14. 1. 6. Singleton. A. Nasal. Spain. MU26-2. 66. 14. 18. 15. 16. 14. 1. 6. Singleton. A. Nasal. Spain. ND19-4. 96. 25. 35. 10. 13. 9. 1. 22. Singleton. A. Nasal. Spain. RU9-1. 108. 31. 10. 10. 32. 14. 1. 11. Singleton. A. Nasal. Spain. VC8-4. 86. 21. 9. 14. 16. 1. 1. 6. Singleton. A. Nasal. Spain. 4590. 88. 21. 16. 6. 1. 9. 1. 12. Singleton. B. Lung. Germany. 9904791. 95. 24. 16. 19. 1. 15. 1. 6. Singleton. B. Unknown. Denmark. 256/04. 87. 21. 16. 9. 1. 1. 1. 11. Singleton. B. Lung. Spain. 7211027-2. 94. 23. 16. 19. 1. 18. 1. 19. Singleton. B. Unknown. Denmark. SR2-2. 102. 27. 16. 9. 13. 19. 1. 21. Singleton. B. Nasal. Spain. LH9N-4. 6. 1. 22. 13. 17. 11. 1. 10. 4. C. Nasal. Spain. SL4-1. 91. 22. 22. 10. 17. 11. 1. 10. 4. C. Nasal. Spain. PM5-4. 62. 12. 22. 10. 17. 11. 1. 10. 4. C. Nasal. Spain. PM8-3. 62. 12. 22. 10. 17. 11. 1. 10. 4. C. Nasal. Spain. 3023. 85. 21. 2. 1. 20. 1. 5. 1. 7. C. Lung. Germany. PV1-12. 101. 27. 2. 1. 20. 1. 2. 1. 7. C. Systemic. Spain. 9904574. 23. 4. 27. 9. 26. 15. 1. 6. 12. C. Unknown. Denmark. 7204122. 22. 4. 27. 9. 20. 15. 1. 6. 12. C. Unknown. Denmark. 9904108. 89. 21. 27. 1. 29. 26. 1. 6. Singleton. C. Unknown. Denmark. 167/03. 1. 1. 1. 1. 1. 1. 1. 1. Singleton. C. Lung. Spain. 23/04. 42. 8. 12. 9. 13. 1. 1. 1. Singleton. C. Systemic. Spain. 233/03. 7. 2. 2. 1. 2. 2. 1. 1. Singleton. C. Lung. Spain. 61/03. 82. 19. 9. 9. 1. 18. 1. 1. Singleton. C. Lung. Spain.
(52) Results AZ1-1. 100. 26. 41. 19. 23. 27. 1. 1. Singleton. C. Nasal. Spain. AZ2-1. 60. 12. 1. 1. 8. 11. 1. 10. Singleton. C. Nasal. Spain. CA36-2. 104. 27. 27. 4. 20. 30. 1. 1. Singleton. C. Nasal. Spain. CT-175-L. 64. 13. 16. 14. 34. 1. 13. 1. Singleton. C. Lung. Spain. GN-256. 50. 10. 8. 19. 20. 27. 1. 5. Singleton. C. Unknown. Spain. P2418. 81. 18. 34. 19. 10. 1. 1. 21. Singleton. C. Unknown. Spain. 55. 11. 14. 12. 15. 1. 1. 1. Singleton. C. Systemic. Argentina. 3. 1. 10. 1. 12. 11. 1. 6. Singleton. C. Nasal. Japan. 37. 63. 13. 16. 14. 15. 15. 2. 1. Singleton. C. Unknown. Spain. 4857. 67. 15. 2. 1. 1. 16. 5. 1. Singleton. C. Meninges. Germany. SC11-4. 106. 29. 37. 3. 13. 1. 1. 1. Singleton. C. Nasal. Spain. SC19-1. 80. 18. 26. 19. 20. 18. 1. 5. Singleton. C. Nasal. Spain. P555/04 sw114. NV. sw124. HV. 31. 5. 9. 9. 11. 10. 5. 1. Singleton. C. Nasal. Japan. sw140. MV. 30. 5. 5. 5. 6. 5. 1. 1. Singleton. C. Nasal. Japan. VB4-1. 77. 17. 25. 9. 13. 1. 2. 1. Singleton. C. Nasal. Spain. VC6-2. 74. 16. 25. 6. 20. 1. 10. 5. 2. D. Nasal. Spain. N67/01. 73. 16. 25. 13. 20. 1. 1. 5. 2. D. Nasal. Spain. 112/02. 73. 16. 25. 13. 20. 1. 1. 5. 2. D. Systemic. Spain. 19/04. 79. 17. 25. 6. 19. 1. 1. 5. 2. D. Trachea. Spain. 32-2. 76. 17. 25. 6. 19. 17. 1. 5. 2. D. Nasal. Spain. CA32-1. 65. 13. 25. 6. 20. 1. 1. 5. 2. D. Nasal. Spain. VC1-3. 78. 17. 25. 6. 20. 1. 10. 5. 2. D. Nasal. Spain. FL3-1. 83. 19. 27. 19. 21. 1. 4. 5. Singleton. D. Nasal. Spain. FL8-3. 68. 15. 27. 6. 1. 1. 7. 11. Singleton. D. Nasal. Spain Spain. N459/05-1. 90. 21. 40. 8. 20. 31. 12. 5. Singleton. D. Nasal. 46080. 103. 27. 25. 6. 16. 4. 12. 5. Singleton. D. Lung. Spain. PC3-2P. 70. 16. 16. 19. 20. 1. 7. 1. Singleton. D. Systemic. Spain. RU15-5P. 75. 17. 9. 16. 13. 4. 14. 5. Singleton. D. Systemic. Spain. 2620. 45. 9. 16. 19. 23. 1. 7. 5. Singleton. D. Systemic. Germany. NV. 32. 6. 6. 6. 7. 6. 1. 5. Singleton. D. Nasal. Switzerland. 34. 61. 12. 15. 13. 8. 14. 3. 6. 1. E. Unknown. Spain. CD10-4. 46. 9. 17. 8. 8. 12. 3. 6. 5. E. Nasal. Spain. CD11-4. 46. 9. 17. 8. 8. 12. 3. 6. 5. E. Nasal. Spain. CD7-3. 46. 9. 17. 8. 8. 12. 3. 6. 5. E. Nasal. Spain. CD8-1. 46. 9. 17. 8. 8. 12. 3. 6. 5. E. Nasal. Spain. CD9-1. 46. 9. 17. 8. 8. 12. 3. 6. 5. E. Nasal. Spain. CN10-1. 47. 9. 17. 8. 16. 12. 3. 6. 5. E. Nasal. Spain. 2784. 38. 7. 27. 8. 31. 9. 1. 1. 9. E. Lung. Germany. 4959. 37. 7. 27. 8. 22. 9. 1. 1. 9. E. Unknown. Germany. 7710. 35. 7. 24. 8. 15. 1. 1. 1. 10. E. Lung. Germany. 2757. 36. 7. 24. 8. 20. 1. 4. 1. 10. E. Lung. Germany. 03/05. 5. 1. 20. 7. 8. 11. 1. 6. Singleton. E. Lung. Spain. 58g. 174. 40. 7. 30. 8. 25. 1. 9. 6. Singleton. E. Unknown. Spain. NV. 2. 1. 7. 7. 8. 7. 3. 6. Singleton. E. Unknown. Sweden. CA36-1. 41. 7. 39. 22. 14. 29. 11. 6. Singleton. E. Nasal. Spain. 4. 1. 11. 8. 8. 12. 1. 6. Singleton. E. Unknown. Sweden. C5. D74. NV NV. 33. 7. 8. 8. 10. 9. 4. 1. Singleton. E. Lung. Germany. IQ1N-6. 84. 20. 20. 22. 8. 11. 3. 6. Singleton. E. Nasal. Spain. IQ7N-8. 84. 20. 20. 22. 8. 11. 3. 6. Singleton. E. Nasal. Spain. IQ8N-6. 84. 20. 20. 22. 8. 11. 3. 6. Singleton. E. Nasal. Spain. 264/99. 20. 4. 8. 21. 10. 20. 8. 13. 3. F. Systemic. Spain. GN-255. 49. 10. 8. 21. 10. 20. 8. 23. 3. F. Unknown. Spain. LH10N-2. 21. 4. 8. 21. 10. 20. 8. 23. 3. F. Nasal. Spain. PC4-6P. 21. 4. 8. 21. 10. 20. 8. 23. 3*. F. Systemic. Spain. RU15-4P. 51. 10. 8. 23. 10. 33. 8. 23. 3. F. Systemic. Spain. CC6-7. 27. 4. 28. 4. 17. 32. 2. 21. 11. F. Nasal. Spain. ER-6P. 28. 4. 28. 4. 13. 32. 2. 21. 11. F. Systemic. Spain. H465. 54.
(53) Results 2725. 15. 3. 28. 20. 24. 19. 2. 12. Singleton. F. Systemic. Germany. 4503. 53. 10. 28. 9. 24. 22. 2. 15. Singleton. F. Unknown. Germany. 7204123. 54. 10. 28. 4. 26. 1. 2. 17. Singleton. F. Unknown. Denmark. 7204226. 25. 4. 28. 4. 28. 24. 2. 17. Singleton. F. Unknown. Denmark. 7403746. 26. 4. 28. 4. 30. 9. 2. 12. Singleton. F. Unknown. Denmark. 9904336. 24. 4. 28. 4. 27. 1. 1. 18. Singleton. F. Unknown. Denmark. 29. 4. 32. 4. 26. 25. 1. 18. Singleton. F. Unknown. Denmark. 12. 3. 4. 3. 4. 3. 2. 3. Singleton. F. Systemic. USA. 228/04. 52. 10. 23. 17. 13. 1. 2. 11. Singleton. F. Lung. Spain. 230/03. 107. 30. 8. 4. 10. 20. 2. 23. Singleton. F. Trachea. Spain. 34/03. 48. 10. 3. 11. 10. 13. 2. 8. Singleton. F. Systemic. Argentina. 16. 3. 28. 2. 13. 23. 2. 16. Singleton. F. Systemic. Spain. 8. 3. 3. 2. 3. 1. 1. 2. Singleton. F. Lung. USA. 11. 3. 3. 2. 35. 18. 1. 4. Singleton. F. Nasal. Spain. 9904809 1A-84-22113. HV. 373/03ª 5D-84-15995 AZ1-5. MV. CA38-4. 17. 3. 38. 2. 24. 28. 2. 13. Singleton. F. Nasal. Spain. GN-254. 105. 28. 36. 9. 20. 18. 2. 11. Singleton. F. Unknown. Spain. GN-257. 14. 3. 23. 19. 20. 1. 2. 11. Singleton. F. Unknown. Spain Germany. H367. 13. 3. 8. 8. 9. 8. 2. 7. Singleton. F. Unknown. 19. 4. 4. 4. 5. 4. 2. 4. Singleton. F. Systemic. Japan. P015/96. 9. 3. 3. 18. 18. 1. 6. 4. Singleton. F. Lung. Argentina. P462/03. 10. 3. 3. 21. 18. 21. 2. 14. Singleton. F. Lung. Argentina. SL7-2. 18. 4. 3. 24. 36. 1. 1. 13. Singleton. F. Nasal. Spain. Nagasaki. HV. * Predicted founder For reference strains the virulence is indicated by: NV, non virulent; MV, moderated virulent; HV, Highly virulent. 55.
(54) Results. 56.
(55) Discussion. Discussion The first part of this work (Chapter 1: “Genotypic diversity of Haemophilus parasuis Field Strains”) reported a single locus sequence typing method (SLST), based on a partial sequence (596 bp) of the hsp60 gene, for H. parasuis epidemiology. Also, partial 16S rRNA gene sequences (~1400 bp) were used to confirm H. parasuis identification. Surprisingly, we found more variability in 16S rRNA gene than expected and therefore, this gene could also be used for strain typing. ERIC-PCR fingerprints were included in the study to compare the resolution of the different methods. Unfortunately, this SLST scheme was limited by the disturbing effects of lateral gene transfer (LGT) and more resolution was needed to clarify the existence of lineages associated to septicaemia outcome. The second part of the work (Chapter 2: “Study of the population structure of Haemophilus parasuis by multilocus sequence typing”) reported the development of a multilocus sequence typing (MLST) scheme for H. parasuis to overcome these limitations. The use of sequences (470-600 bp) from seven loci for typing provides increased robustness against LGT. Moreover, the use of several sequences generates representative phylogenetic studies to elucidate distant historical relationships. Accordingly, this thesis represents an evaluation of different genotyping techniques for H. parasuis, using more than 100 isolates. Noteworthy, an effort was made to have a representative panel of strains. Consequently, nasal isolates form animals from farms with and without Glasser’s disease, and clinical isolates, from lung and systemic sites, were included. Nasal isolates were included to avoid the problem of many pathogen databases that represent a biased sample of the natural populations since they contain mainly virulent isolates (Perez-Losada et al., 2006 25). Actually, isolates from healthy carriers can constitute the bulk of the population of many species, since colonization is common but disease is rare (Enright & Spratt, 1999). The detailed protocols of the procedures used in the studies included in both chapters can be found in annex II. In microbiology, typing methods are used to differentiate isolates of the same species. Phenotypic characteristics, such as serotype or MLEE, have been used in H. parasuis typing, but both methodologies have limitations (Blackall et al., 1997; Kielstein & Rapp-Gabrielson, 1992). Serotyping does not achieve the typing of all. 57.
(56) Discussion. strains, and the use of MLEE is laborious and produces results that are difficult to share (Enright & Spratt, 1999). In contrast, genotyping allows the typing of all strains in a reasonable time, although it does not report functional characteristics of the isolates; functional characteristics have to be linked to specific genotypes afterwards. Once the data is analysed by clustering methods, groups of related strains can be identified either by setting an arbitrary threshold or by deducing them from the additional information (van Ooyen, 2001). The interpretation of H. parasuis genomic clusters can be difficult when exploring a relationship with virulence. The virulence factors of this bacterium are not known and we indirectly inferred the pathogenic potential of an isolate by the site of isolation. Thus, systemic isolates are likely virulent, but with lung isolates the establishment of the putative virulence is more controversial. Although H. parasuis is not isolated from healthy lungs, it is difficult to discard that isolation from this organ is not caused by a post-mortem contamination. As aforementioned, lung isolates are only useful for diagnosis of pneumonia, but for Glässer’s disease, only systemic isolates are valid. Furthermore, the presence of virulent clones in healthy animals can not be ruled out if equilibrium between colonization and immunity is maintained. An additional problem that we found was the lack of clinical information from many isolates. To help in the interpretation, we included the reference strains because their virulence has been tested in experimental animal challenges.. 1. Genotyping of H. parasuis ERIC-PCR is probably the technique most frequently reported for H. parasuis genotyping. Although ERIC-PCR is useful for local epidemiology, it presents problems of reproducibility, which depends even in the thermocycler used (Foxman et al., 2005). This technique is also not suitable for the analysis of distant relationships between divergent strains, and the poor portability of the results prevents the construction of global epidemiological databases. As an alternative, sequence typing provides enough level of discrimination while allowing the identification of relationships between different strains. In consequence, a SLST was developed by partial sequencing of hsp60, since, with the current technology, the amplification and sequencing of fragments up to 600 bp is a straightforward task. The hsp60 gene was chosen because it was previously used to develop typing and diagnostic tools for several animal and 58.
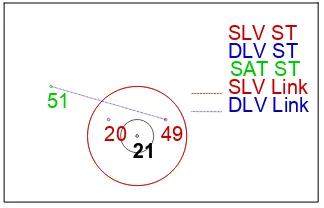
(57) Discussion. human pathogens (Brousseau et al., 2001; Goh et al., 1996; Goh et al., 1998; Hill et al., 2005; Hung et al., 2005; Lee et al., 2003; Reen & Boyd, 2005; Teng et al., 2002). Moreover, the hsp60 gene has been reported to be a potential antigen, present in the cell surface and somehow related to virulence (Ausiello et al., 2005; Fares et al., 2004; Fares et al., 2002; Fernandez et al., 1996; Garduno et al., 1998; Hennequin et al., 2001; Hoffman & Garduno, 1999; Kamiya et al., 1998; Macchia et al., 1993; Yamaguchi et al., 1997; Zhang et al., 2001). Therefore, it is possible that this gene was divergent between virulent and non-virulent strains. Interestingly, two clusters were differentiated, one of them showing a higher frequency of clinical isolates and virulent reference strains (disease-associated cluster, cluster 1; chapter 1). Surprisingly, we detected significant 16S rRNA gene sequence diversity among H. parasuis strains (95 to 100% identity). This level of variability is useful in strain typing, and actually, the diseaseassociated cluster was also identified by 16S rRNA sequence analysis (cluster A; chapter 1). This high variability in the 16S rRNA gene is not unique to H. parasuis and was already reported in Haemophilus influenzae (Sacchi et al., 2005) and other bacteria (Harrington & On, 1999; Martinez-Murcia et al., 1999; Yap et al., 1999). The disadvantage of 16S rRNA gene sequencing is the long fragment (aprox. 1,500 bp) that should be sequenced in order to obtain enough resolution (Stackebrandt, 1994), forcing to perform several reactions with the consequent increase in cost. Unfortunately, the hsp60 tree was incongruent with the 16S rRNA tree, and a LGT was the most likely explanation.. SLV ST DLV ST SAT ST SLV Link DLV Link. 51 20. 21. 49. Fig 5. Burst representation of the MLST group 2 (Chapter 2) with the predicted founder in a central position (ST21). Single locus variants are indicated in red, double locus variants in blue and satellites in green.. To improve the classification of H. parasuis strains, we developed a MLST. MLST is an attractive methodological option because it is reproducible, has enough discrimination power and produces portable results. Interestingly, the resolution can be increased by adding more loci or changing them for more variable ones, but the high. 59.
Figure
+7
Documento similar
The faculty may have uploaded some file with the complete timetable by subjects.. 7) Scroll down and click on the academic course. You will find all the classes grouped by
They exhibit VARIETY as a result of the different communicative situations, the degree of abstraction or specialization, the type of text (oral or written), the users, the various
Keywords: iPSCs; induced pluripotent stem cells; clinics; clinical trial; drug screening; personalized medicine; regenerative medicine.. The Evolution of
análisis de varios marcadores (el gen 16S rRNA, los 5 loci del MLST, y el gen wsp), así como su distribución geográfica. 28.2 Inferencia filogenética del gen 16S rRNA. El
Astrometric and photometric star cata- logues derived from the ESA HIPPARCOS Space Astrometry Mission.
The photometry of the 236 238 objects detected in the reference images was grouped into the reference catalog (Table 3) 5 , which contains the object identifier, the right
Analysis of microbiota composition (q-PCR and 16S rRNA gene sequence analyses) and microbial metabolic activity (ammonium production and microbial-derived
In addition, precise distance determinations to Local Group galaxies enable the calibration of cosmological distance determination methods, such as supernovae,
