, México a
INSTITUTO TECNOLÓGICO Y DE ESTUDIOS SUPERIORES DE
MONTERREY
PRESENTE.
Por medio de la presente hago constar que soy autor y titular de la obra
denominada
, en los sucesivo LA OBRA, en virtud de lo cual autorizo a el Instituto
Tecnológico y de Estudios Superiores de Monterrey (EL INSTITUTO) para que
efectúe la divulgación, publicación, comunicación pública, distribución,
distribución pública y reproducción, así como la digitalización de la misma, con
fines académicos o propios al objeto de EL INSTITUTO, dentro del círculo de la
comunidad del Tecnológico de Monterrey.
El Instituto se compromete a respetar en todo momento mi autoría y a
otorgarme el crédito correspondiente en todas las actividades mencionadas
anteriormente de la obra.
Optimization of Fresnel Lens by Genetic Algorithms for Passive
Solar Tracking and Solar Thermal Concentration
Purposes-Edición Única
Title
Optimization of Fresnel Lens by Genetic Algorithms for
Passive Solar Tracking and Solar Thermal Concentration
Purposes-Edición Única
Authors
Jesús Alán Anaya Peralta
Affiliation
Tecnológico de Monterrey, Campus Monterrey
Issue Date
2010-12-01
Item type
Tesis
Rights
Open Access
Downloaded
18-Jan-2017 15:50:11
INSTITUTO TECNOLÓGICO Y DE ESTUDIOS
SUPERIORES DE MONTERREY
C A M PU S M O N T ER R EY
zyxwvutsrqponmlkjihgfedcbaZYXWVUTSRQPONMLKJIHGFEDCBA
DIVISIÓN DE INGENIERÍA Y ARQUITECTURA
PROGRAMA DE GRADUADOS EN INGENIERÍA
O PTIM IZ A TIO N O F A FRESN EL L EN S BY
G EN ET IC A LG O R ITH M S FO R PA SSIV E SO LA R
T R A C K IN G A N D SO LA R T H ER M A L
C O N C EN T R A T IO N PURPO SES
T ES I S
P R ESEN T A D A C O M O REQ UISITO PA R C IA L
P A R A O BT EN ER EL G R A D O A CA DÉMICO D E:
M A EST R O E N CIEN CIA S
ESPEC IA LID A D E N SISTEM A S D E M A N U F A C T U R A
POR
JESÚS ALÁN A N A Y A P ER A L T A
INSTITUTO TECNOLÓGICO Y D E ESTUDIOS
SUPERIORES D E M O N TERREY
CA M PUS M O N TERREY
DIVISIÓN D E INGENIERÍA Y A RQ UITECTURA
PROGRAMA DE GRADUADOS EN INGENIERÍA
OPTIM IZA TION OF A FRESN EL LEN S BY G EN ETIC A LG O RITHM S FOR PA SSIV E SO LA R TRA CKIN G A N D SO LA R TH ERM A L CO N CEN TRA TIO N PURPOSES
TESIS
PRESEN TA D A CO M O REQUISITO PA RCIA L PA RA O BTEN ER EL G RA D O
ACADÉM ICO D E:
M A ESTRO EN CIENCIAS
ESPECIA LID A D SISTEM AS D E M A N UFA CTURA
POR
JESÚS A LÁ N A N A Y A PERA LTA
INSTITUTO TECNOLÓGICO Y DE ESTUDIOS SUPERIORES DE MONTERREY
CAMPUS MONTERREY
zyxwvutsrqponmlkjihgfedcbaZYXWVUTSRQPONMLKJIHGFEDCBA
DIVISIÓN DE INGENIERÍA Y ARQUITECTURA
PROGRAM A DE GRADUADOS EN INGENIERÍA
Los miembros del comité de tesis recomendamos que el presente proyecto de tesis presentado
por el Ing. Jesús Alán Anaya Peralta sea aceptado como requisito parcial para obtener el grado
académico de:
M AESTRO EN CIENCIAS CON ESPECIALIDAD EN SISTEMAS DE M ANUFACTURA
Dr. Ciro Ángel Rodríguez González
Director del Programa de M aest ría en Ciencias
con especialidad en Sistemas de M anufactura
ACKNOW LEDGEM ENTS
I would like to thank to...
... Dr. Noel Leon for making possible this thesis.
... Dr. Humberto Aguayo and Dr. Julio Cesar Gutierrez for t heir time and advice.
... Esther Huckabay for reviewing this document.
... M y family, for their constant support from home.
... ITESM and CONACYT for economic support.
ABSTRACT
A passive solar tracker and concentrator device must be able to effectively concentrate solar radiation into a constant area throughout the day, without any mobile mechanism. The objective is to achieve >1000 "C on the receptor area with concentrated solar energy, and to accomplish this target a compound Fresnel lens has been designed.
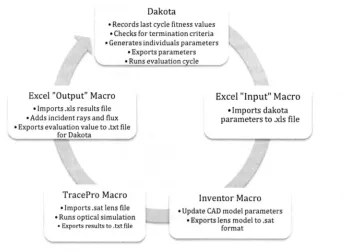
Utilizing multidisciplinary CAE software, an integrated multiobjective optimization process based on genetic algorithms was developed and a novel design solution has been achieved. The process consists of integrating genetic algorithms using optimization software Dakota from Sandia National Laboratories with Autodesk Inventor for parametric variat ion of the lens 3DCAD geometry, Lambda Research TracePro software for ray tracing simulat ion, and M icrosoft Excel to manage data input and output.
A manufacturing feasibility analysis was done for the proposed Fresnel lens and the implications of scaling 10 times the size of the lens were studied. Several simulation scenarios were developed, such as a solar tracker and concentrator device for twodimensional (linear) concent rat ion and threedimensional (spot) concentration on equatorial and nonequatorial locations.
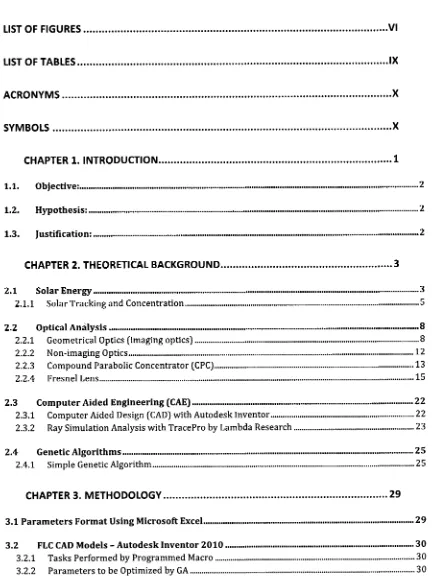
TABLE OF CONTENTS
LIST OF FIGURES VI
LIST OF TABLES IX
ACRONYM S X
SYM BOLS X
CHAPTER 1. INTRODUCTION 1
1.1. Obje ctive : • 2
1.2. Hypothe sis: 2 1.3. Justification: 2
CHAPTER 2. THEORETICAL BACKGROUND 3
2.1 Solar Ene rgy 3
2.1.1 Solar Tracking and Concentration 5
2.2 Optical Analys is 8
2.2.1 Geometrical Optics (imaging optics) 8
2.2.2 Nonimaging Optics 12 2.2.3 Compound Parabolic Concentrator (CPC) 13
2.2.4 Fresnel Lens 15
2.3 Compute r Aide d Engine e ring (CAE) 22
2.3.1 Computer Aided Design (CAD) with Autodesk Inventor 22 2.3.2 Ray Simulation Analysis with TracePro by Lambda Research 23
2.4 Genetic Algo rithm s 2 5
2.4.1 Simple Genetic Algorithm 25
CHAPTER 3. M ETHODOLOGY 29
3.1 Parame te rs Format Using Microsoft Excel 2 9 3.2 FLC CAD Mode ls - Autode sk Inventor 2010 30
3.2.1 Tasks Performed by Programmed Macro 30 3.2.2 Parameters to be Optimized by GA 30
3.2.3 Parameter Management and Linkage to Excel 34
3.3 Individuals (CAD Models) Evaluation Using Trace Pro 3 6 3.4 Results Data Management Using Microsoft Excel 4 0 3.5 Optimization Process Integration Using Dakota and Window s Batch Scripts 4 2
3.5.1 Dakota's Input File 43 3.5.2 Evaluation Program for Optimization Process 45
3.5.3 Batch Commands to Execute Software M acros 46
CHAPTER 4. OPTIM IZATION RESULTS 49
4.2 Optimization Proce ss Using SOGA Me thod 4 9 4.3 Optimization Proce ss using MOGA Me thod 53
4.4 FLC Conce ntration Ratio 6 1 4.5 Optimization Using MOGA Method of the Reflector Mode l w ith Spline Co ntro lle d Surface
63
4.6 Line ar (2D) Conce ntration to Spot (3D) Conce ntration 6 7
CHAPTER 5. M ANUFACTURING FEASIBILITY OF INCREASING THE FLC SIZE 71
5.1 Design and Optical Implications of Scaling the FLC Profile 7 1 5.2 Design and Optical Implications of Adding Prisms Line s to the FLC Profile 7 1
5.3 FLC Manufacturing Proce ss Fe asibility 72 5.4 Incre asing FLC Size Conclusions 7 4
CHAPTER 6. CONCLUSIONS AND FUTURE WORK 75
6.1 Conclusions 7 5 6.2 Future Wo rk 7 5
6.2.1 Simulation 75 6.2.2 Research 76
REFERENCES 77
APPENDIX B RESULTS OF OPTIM IZATION PROCESS 99
APPENDIX C PAPER SUBM ITTED FOR WORLD CONGRESS OF COM PUTER AIDED
INNOVATION 2011 (W CCAI'll) 100
LIST OF FIGURES
Figure 1. Solar radiat ion int ensit y kW h/ (m2year) around t he w orld [Albuisson et al. 2006] 4
Figure 2. The Solar Spect rum, radiat ion int ensit y by w avelengt h. [Lund et al. 2008]. 5
Figure 3. Direct solar irradiance in W / m 2 (vert ical axis] from 7:00 t o 17:00 hours (horizont al axis) on
different dat es of t he year in M ont errey, M exico 6
Figure 4. Linear focus (single axis t racking) solar elect ric energy-generat ing syst em s at Kramer Junct ion in
California, USA 7
Figure 5. Spot focus (Double axis t racking) parabolic dish w it h St irling engine and solar t racker at
" Plat aforma Solar de Almeria" (PSA) in Spain 7
Figure 6. Refract ion and reflect ion of a beam. [NASA Dat a Glossary] 9
Figure 7. Diagram of a concent rat or's geomet ric relat ions. [Leut z et al. 2001]. 10
Figure 8. Relat ion of t hermodynamic t emperat ure in °C (vert ical axis) Tr,m ax and concent rat ion level in
suns (horizont al axis) C. No t hermal losses w ere considered in t his m odel. [Leut z et al. 2001]. 12
Figure 9. Diagram of a Compound parabolic collect or. [Leut z et al 2001] 14
Figure 10. Hist ory ofFresnel lenses. [Leut z et al 2001]. 15
Figure 11. Table of major development s in Fresnel lenses suit able for solar applicat ions. [Leut z et al 1999]. 16
Figure 12. Fresnel profile show ing prism 's facet s [Davis et al 2007]. 16
Figure 13. Comparison ofFresnel lenses w it h grooves facing out w ard and grooves facing inw ard. 17
Figure 14. Sim ple Fresnel lens w it h grooves facing inw ard. Analyt ical solut ion.[Leut z et al. 1999] 18
Figure 15. Accept ance half angles for Fresnel Lenses. [Leut z et . a! 2001], 19
Figure 16. Shaped Fresnel lens profile diagram. Im age does not show t he t hickness of t he ext erior surface
of t he lens. [Delgadillo 2008] 20
Figure 17. Dome-shaped Fresnel lens w it h grooves facing inw ard. Analyt ical solut ion for const ant focal
lengt h. [Leut z et al. 1999]. 22
Figure 18. Different versions of a paramet erized 3D m odel. [Villarreal, 2008] 23
Figure 19. M odificat ions t o a paramet erized m odel creat ed w it h splines. [Cuevas, 2006]. 23
Figure 20. Ray t race of a Carl Zeiss lenses done in TracePro. [TracePro user guide 5.0,2009]. 24
Figure 21. Basic GA process. [Valenzuela 2004] 25
Figure 22. Genot ype represent at ions w it h t hree variables. 26
Figure 23. GA process diagram. [Arcos, 2006] 27
Figure 24. Delgadillo's facet ed FLC sect ion profile and general dimensions in millimet ers 31
Figure 25. Chosen dimensions ofFLC's prism s. 31
Figure 26. Sket ched const raint s on FLC profile in Aut odesk Invent or. 32
Figure 27. Delgadillo's FLC m odel w it h mult i-focus orient at ions displayed. 32
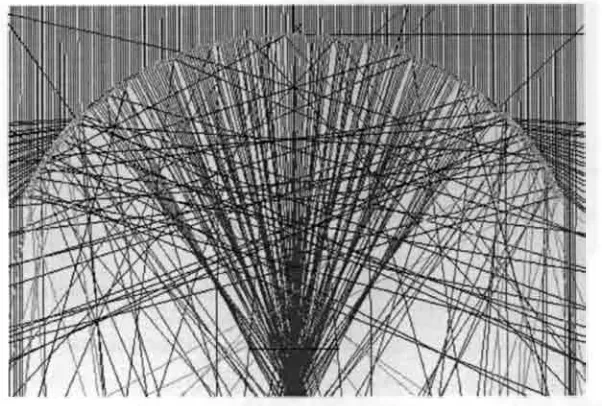
Figure 29. Ray-t race of t he developed single focus FLC t emplat e m odel. Rays source at t he left images has a
75° inclinat ion angle t o t he horizont al plane and t he right image has a 90° angle. 33
Figure 30. FLC m odel's profile w it h dimensions bet w een prism s and t he horizont al and vert ical axes. 34
Figure 31. General dimensions (millimet ers) of paramet erized FLC m odel. 34
Figure 32. Paramet ers M anager of Aut odesk Invent or 2009 35
Figure 33. TracePro t emplat e file view . 37
Figure 34. Templat e file w it h ray sources displayed. 38
Figure 35. Trace Pro simulat ion generat ed ASCII file 39
Figure 36. Act ions of t he opt imizat ion process cycle 42
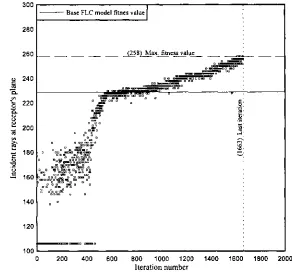
Figure 37. Fit ness value progress of FLC using SOGA met hod. Object ive funct ion: M aximize incident rays at
t he recept or's plane 49
Figure 38. Cross sect ion profile of SOGA best found FLC m odel. Zoom in at t he irregular prism s. 51
Figure 39. Ray t racing simulat ion in TracePro ofSOGA's best found FLC m odel. Rays reached t he FLC
m odel w it h a 45° angle in respect t o t he horizont al plane. 52
Figure 40. Rays reached t he FLC m odel w it h a 75° angle respect ive t o t he horizont al plane. 52
Figure 41. Rays reached t he FLC m odel w it h a 90° angle respect ive (normal) t o t he horizont al plane. 53
Figure 42. Fit ness value improvement of Incident rays maximizat ion (first object ive funct ion) using M OGA
met hod in t he course of 1,219 cycles. 55
Figure 43. Fit ness value improvement of Incident flux maximizat ion (second object ive funct ion) using
M OGA met hod in t he course of 1,219 cycles. 56
Figure 44. 3D scat t er plot Result s of opt imizat ion process using M OGA met hod. 56
Figure 45. Fit ness values progress of FLC m odels using M OGA met hod. Each dot represent s a FLC m odel
(individual) creat ed by Dakot a's GA opt imizat ion process. 57
Figure 46. Paret o front of object ive funct ions result s using M OGA
zyxwvutsrqponmlkjihgfedcbaZYXWVUTSRQPONMLKJIHGFEDCBA
57 Figure 47. Ray-t racing simulat ion w it h rays sources at 45°. 58Figure 48. Ray-t racing simulat ion w it h rays sources at 60°. 59
Figure 49. Ray-t racing simulat ion w it h rays sources at 75°. 59
Figure 50. Ray-t racing simulat ion w it h rays sources at 90°. 60
Figure 51. M ult iple recept ors posit ioned t o reflect concent rat ed rays t ow ard a single fixed spot . Only half of t he recept ors are being used for t he simulat ion; t he ot her half can be mirrored by t he FLC vert ical axis
(y axis) 61
Figure 52. Concent rat ion level calculat ion for each axis. 62
Figure 52. Fit ness improvement of t he reflect or during t he opt imizat ion process 63
Figure 53. Isom et ric view of base m odel surface (t op) and M OGA creat ed surface aft er t he opt imizat ion
process (bot t om) 64
Figure 54. Base m odel spline profile using 8 cont rol point s (left ) and M OGA creat ed spline profile aft er t he
opt imizat ion process (right ). Horizont al and vert ical axes are highlight ed. 65
Figure 55. Cross-sect ion of t he opt imized solar concent rat ion device. Recept or surface is bet w een t he FLC
and reflect or.
zyxwvutsrqponmlkjihgfedcbaZYXWVUTSRQPONMLKJIHGFEDCBA
65Figure 56. Rays reached t he FLC m odel w it h a 90° angle respect ive (normal t o) t he horizont al plane 66
Figure 57. Rays reached t he FLC m odel w it h a 75° angle respect ive (normal t o) t he horizont al plane 66
Figure 58. Rays reached t he FLC m odel w it h a 60° angle respect ive (normal t o) t he horizont al plane. 66
Figure 59. Rays reached t he FLC m odel w it h a 45° angle respect ive (normal t o) t he horizont al plane. 66
Figure 60. Render of FLC and reflect or w as done w it h Phot oView 360 by Dassult Syst em s. 67
Figure 61. Spot concent rat ion w it h a revolved FLC profile (left ) and a bended shaped FLC w it h circular
grooves (right ) 68
Figure 62. M ult iple Layer - Fresnel Lens Concent rat or (M L-FLC). Darker colored lens layer concent rat es
rays above one axis and light er colored lens concent rat es rays in an ort hogonal axis. 69
Figure 63. M L-FLC of M OGA best found m odel used t o achieve spot concent rat ion 69
Figure 64. M L-FCL (gray colored) w it h reflect or (green colored) for upw ards sport concent rat ion 70
Figure 65. Flat shaped FLC aft er prism reorient at ion for acrylic cast ing 73
Figure 66. M et al sheet w it h opposit e or " negat ive" Fresnel profile for t he FLC m old. 73
LIST OF TABLES
Table 1. Renew able energies pot ent ial. [Leut z et al. 2001]. 1
Table 2. Seasonal solar inclinat ion angles. [St ickler et al] 4
Table 3. Comparison of concent rat ors by level of concent rat ion rat io and t racking requirement s.[Leut z, et
al. 1999] 13
Table 4. Represent at ion of genot ype, phenot ype, and fit ness [Goldberg]. 26
Table 5. Comparison of FLC m odels using developed TracePro simulat ion SO
Table 6. Irradiance values for solar rays sources during summer t ime in M ont errey, M exico 54
Table 7. Comparison of Opt imizat ion process result s of SOGA and M OGA met hods using developed
TracePro Slm v4 simulat ion 58
Table 8. Ray and flux concent rat ions overall efficiency in TracePro simulat ion scenario 60
Table 9. Overall efficiency using mult iple recept ors for GA opt imized FLC. 61
Table 10. Comparison of fit ness values of t he FLC-Reflect ive and FLC syst em s. 67
Table 11. M anufact uring processes used in " Plast iglds de M exico" fact ory and t heir relat ed issues for FLC
manufact uring feasibilit y. 72
ACRONYM S
SYM BOLS
ASCCI: American Standard Code for Information Interchange CAE: Computer Aided Engineering CAD: Computer Aided Design CPC: Compound Parabolic Concentrator FLC: Fresnel Lens Concentrator GA: Genetic Algorithm ITESM: Instituto Tecnológico de Estudios Superiores de Monterrey MLFLC: Multiple Layers Fresnel Lens Concentrator MOGA: M ulti Objective Genetic Algorithm OP: Optimization ProcessPM M A: Poly(methyl methacrylate) SOGA: Single Objective Genetic Algorithm
6 Solar declination angle (degrees) X Wavelength of concern (urn)
9i
Incident angle (degrees)02 Output angle (degrees)
0 Latitude (degrees)
c Speed of light in vacuum (m/s) Cm a x Maximum concentration level Cr a t io Concentration level or ratio
Cm ax.Unear Maximum linear concentration level E Irradiance on the surface of an object (W/m2
) / ' Focal length (m)
j'/ number A measure of the flux concentration of the imaging lens
H Hour angle (degrees)
/ Irradiance on the surface of the outer sphere (W/ m2
) kWh Kilowatts hour
Lop Optical path
n Refractive index of material
nj Refractive index of first light transmission material
n2 Refractive index of second light transmission material
R Radius of the Sun (km)
r Average SunEarth distance (km)
S Value (on a clear day) of solar insolation on a surface perpendicular to incoming solar radiation (W/m2
)
S0 Solar constant
Tr.m ax Maximum temperature (Kelvin)
T
s Temperature at Sun's surface (Kelvin)v3 Light speed in first material (m/s)
v2 Light speed in second material (m/s)
A
zyxwvutsrqponmlkjihgfedcbaZYXWVUTSRQPONMLKJIHGFEDCBA
CRONYMS
ASCCI: Am er ican St andard Code f or Inf ormat ion Int erchange CAE: Co m p ut er Aided Engineering
CAD: Co m put er Aided Design
CPC: Co m p o und Parabolic Concent rat or FLC: Fresnel Lens Concent rat or
GA: Genet ic Algorit hm
ITESM : Inst it ut o Tecno ló gico de Est udios Superiores de M o nt er r ey M LFLC: M i l t i p l e Layers Fresnel Lens Concent rat or
M OGA: M ult i Object ive Genet ic Algo r it hm OP: Opt im izat ion Process
PM M A : Poly(met hyl met hacrylat e) SOGA: Single Object ive Genet ic Algo r it hm
SYMBOLS
Solar declinat lon angle (degrees) Wavelengt h of concern (u.m) Incident angle (degrees) Out put angle (degrees) Lat it ude (degrees)
Speed of light in vacuum (m/s) M ax im um concent rat ion level Concent rat ion level or rat io M ax im um linear concent rat ion level Irradiance on t he surf ace of an object ( W/m2
) Focal lengt h (m)
A measure of t he f lux co ncent r at io n of t he imaging lens Hour angle (degrees)
Irradiance on t he surf ace of t he out er sphere ( W /m2
) Kilow at t s hour
Opt ical pat h
Ref ract ive index of mat erial
Ref ract ive index of f irst light t ransmission mat erial Ref ract ive index of second light t ransmission mat erial Radius of t he Sun (km)
Average SunEart h dist ance (km)
Value (on a clear day) of solar insolat ion on a surf ace perpendicular t o inco m ing solar radiat ion ( W/m2)
Solar const ant
CHAPTER 1. INTRODUCTION
Due t o fossil fuel related issues that hydrocarbons create, such as global warming and air, land, and water pollution as w ell as the reduction of global oil reserves, scientific efforts have moved towards renewable " clean" energy research, called "green technologies". M any different kinds of energy sources are being st udied: w ind, geothermic, biomass, etc., yet none of those are as universal and abundant as solar energy. In the next table the potential of various "green technology" energy sources are shown:
Table 1. Renew able energies pot ent ial. [Leut z et al. 2001].
M ost solar energy research is being done utilizing photovoltaic (PV) cells, which generate electricity w it h a molecular chain reaction. This reaction is triggered by a solar energy flux that falls into a t hin layer of silica or germanium based compound. However, commercial PV cells have only a 15% to 20% rate of efficiency.
Two main factors regarding solar thermal energy must be overcome. First, solar energy must be concentrated for t hermal applications due to the lowdensity nature of this energy. Second, for most solar concent rat ors, incident solar rays must be perpendicular to the surface at all t imes. Therefore, a solar tracking device must be used. Also, a third factor could be the dependency of weat her condit ions, as not all locations have regularly sunny days throughout the year.
It is important t o state that there are a great amount of different renewable energy sources. For each locat ion and application the most convenient energy source should be researched. In the case of Nort hern M exico, solar energy offers great opportunities.
This thesis is aimed to explore the feasibility of using a Fresnel lens as a solar concentrator and passive solar tracking device. The main objective of this research work is to be able t o concentrate solar t hermal energy into a thermal tank; meanwhile this thermal battery (or tank) will be used as a power source for a Stirling engine. A Stirling engine is an external combustion reciprocating engine containing an enclosed working fluid that is alternately compressed and expanded to operate a pist on, thus converting heat from a variety of sources into mechanical energy [Columbia Encyclopedia definit ion].
Focusing solar rays into a thermal battery instead of focusing them directly towards the Stirling engine gives mobility to the system and allows the Stirling engine to have power 24 hours per day, which is more practical for electric generation applications. Also, this method opens the possibility t o use t hermal stored energy for transportation vehicles.
1.1. OBJECTIVE:
The objective of this thesis is to develop an automated design process that optimizes a Fresnel lens using genetic algorithms, in which the geometry is modeled w it h a 3D CAD package (i.e. INVENTOR). This proposed passive solar tracking and concentrator device is simulated w it h a radiation simulator (TracePro) that is able to follow the Sun's trajectory throughout the day and effectively concentrate incident solar rays to a constant area in order to reach a temperature higher than 1000°C. The word "passive" is meant to express that no moving parts or mechanisms are involved in the design.
1.2. HYPOTHESIS:
It is possible t o optimize the geometry of a single static Fresnel lens, or a group of t hem, with genetic algorithms for a specific application. For the purposes of this thesis project, the goal is to refract most of the solar rays that fall onto the exterior surface of the lens t o a constant area, and utilize this thermal energy t o heat phase changing materials inside the t hermal tank to reach their melting point, which in the case of Si02 is 10001200°C.
1.3. JUSTIFICATION:
The benefits of using solar energy include its abundance in many locations around the w orld, as well as the fact that it is free and nonpolluting (or "clean"). Nevertheless, solar energy is also a lowdensity energy and therefore must be concentrated. This characteristic of solar energy implies the need for a solar collector device that concentrates solar rays by either reflection or refract ion. Also, for this concentration device to be effective, the sun's trajectory must be follow ed (or tracked) throughout the day so that the solar rays reach the concentrator w it hin a small range of permissible incident angles.
There are a significant number of commercial solar tracking systems that have already been developed; however, most of them use mobile or moving mechanisms, adding extra investment and maintenance costs and increasing the risks of mechanical and electrical failures. An ideal solution is a solar collector device that focuses the concentrated solar energy to a constant area, without using moving parts or electronic control systems and offering similar concent rat ion capacity. A significant costbenefit factor of producing electric power from "green" energy sources can be reached with a passive solar tracking concentrator device, as they are more practical/ appropriate/ efficient for use in homes and buildings, where mobile mechanisms are not desirable.
CHAPTER 2. THEORETICAL BACKGROUND
2 .1 SOLAR ENERGY
Our star, t he Sun, emits an electromagnetic radiation conformed by a range of wavelengths, propagating themselves through space at 299,792 kilometers per second. Since 1983 this speed has been used as a unit of measure called "c", and more commonly known as light speed. A nuclear fusion process at the center of the Sun generates this radiation energy. The
t ransformat ion of the Sun's mass t o energy is described by the famous equation of Einstein:
zyxwvutsrqponmlkjihgfedcbaZYXWVUTSRQPONMLKJIHGFEDCBA
E = mc2, where " E" is energy, " m" is mass, and "c" is light speed. Solar energy on Earth is just the portion of radiation emit t ed by the Sun that is intercepted by Earth.
To study the effects of solar radiation on Earth, it is necessary to determine the amount of energy reaching the Earth's atmosphere and its surface. Once the surface irradiance of the Sun is det ermined, the amount of solar energy reaching the top of the Earth's atmosphere can be calculated using t he Inverse Square Law. The average amount of energy received on a surface perpendicular t o incoming radiation at the t op of the atmosphere is the solar constant.
The Inverse Square Law is used to calculate the decrease in radiation intensity due to an increase in distance from the radiation source.
Inverse Square Law:
/ = Irradiance at the surface of the out er sphere
E = Irradiance at the surface of t he object (Sun) 4nR2
= surface area of the object
4nr2
- surface area of the out er sphere
The solar constant is t he rate at which solar energy, at ail wavelengths, is received per unit area at t he t op level of Earth's atmosphere [Johnson, 1954). The solar constant actually varies by about 0.3% over the 11year solar cycle but averages about 1,368 W/ m2 [Darling]. Each planet has its ow n planetary solar constant, ranging from M ercury (9936.9 W/ m2) to Pluto (0.87 W/ m2).
In order t o calculate t he solar constant equat ion, (2.1) is adapted t o:
S0= Solar Constant
E= Surface Irradiance of t he Sun
R -
6.96 x l 05k m = Radius of t he Sun r = 1.5 x 10⁸
km =Average SunEarth Distance
Insolation, t he amount of solar radiation striking a surface area, is defined by:
(2.1)
(2.2)
(2.3)
/ = Insolation S » 1000 W / m2
: Value (on a clear day) of solar insolation on a surface perpendicular t o incoming solar radiation. This value varies greatly due to atmospheric variables.
Z = Zenith angle, which is the angle from the zenith (point directly overhead) relative t o the Sun's position in the sky.
The zenith angle is dependent upon latitude, solar declination angle, and time of day, and is defined by:
Table 2. Seasonal solar inclinat ion angles. [St ickler et al.].
The energy irradiated by the Sun can be measured on Earth' surface as power over a square meter times the year (kWh/ m2
, year).
Figure 1. Solar radiat ion int ensit y kW h/ (m2year) around t he w orld [Albuisson et al. 2006].
(2.4)
<S> = Latitude
H — Hour Angle = ( 1 5 °) ( Ti m e — 12): Angle of incident radiation due t o time of day. Time is
given in solar time as the hour of the day from midnight. 6 = Solar Declination Angle
The speed of electromagnetic waves depends on the medium in which they are traveling. When they enter the Earth's atmosphere, these waves change t heir speed and direction because they are reflect ed, absorbed, and dispersed by the different molecules that make up our planet's atmosphere. The ozone (03) layer in the high atmosphere absorbs most of the ultraviolet
radiation. The visible wavelength range (400 to 700 nm) is dispersed by the air molecules, which gives t he characteristic blue color to the sky. Also, C02 and water vapors absorb some of the
infrared low range waves.
250 500 750 1000 1250 1500 1750 2000 2250 2500 W avel en gt h (nm )
Figure 2. The Solar Spect rum, radiat ion int ensit y by w avelengt h. [Lund et al. 2008].
As we can see in the above chart, the majority of the energy is found in the low wavelength range of electromagnetic waves. The energy absorbed by the atmosphere can slightly change depending on the amount of wat er vapor, pollut ion, and aerosols in the atmosphere, however the largest amount is absorbed by cloudiness.
2 . 1 . 1 SOLAR TRACKING AND CONCENTRATION
To reach higher levels of solar concent rat ion, solar collectors must decrease t heir acceptance angle; t herefore it is necessary to follow the Sun's apparent movement relative to Earth. There are several different techniques that can be employed depending of the level of concentration needed. [Chemisana, 2009].
• Seasonal tracking: Consists of changing the position of the concentrator a few times during the year to accomplish a correct aiming of the Sun's apparent trajectory.
• Single axis tracking: A solar concentrator rotates about an axis, keeping the sun between an angular vision range throughout the entire year. The axis of rotation is usually orient ed nort hsout h, eastwest, vertical or polar (northsouth direction wit h an elevation equal to t he latitude). These systems usually work within ranges of middle concentration level (40x t o lOOx).
• Double axis or ideal tracking: The concentrator is aiming towards the Sun at all t imes. In practice, these systems can reach the highest levels of concentration (lOOx to 10,000x).
Solar irradiance intensity changes depending on geographical location, season of the year, weather conditions and time of day. The Liu, B. & Jordan, R. model [Liu et al. 1960] was used to describe solar irradiance of M ont errey, M exico (with a latitude of 25°40' N).
Figure 3. Direct solar irradiance in W / m 2 (vert ical axis) from 7:00 t o 17:00 hours (horizont al axis) on different dat es of t he year in M ont errey, M exico.
As can be observed, the highest irradiance intensities are between 9:00 hours and 15:00 hours. Thus the solar concentrator and passive tracking device is designed to work during that window of t ime.
Figure 4. Linear focus (single axis t racking) solar elect ric energy-generat ing syst em s at Kramer Junct ion in California, USA.
Figure 5. Spot focus (Double axis t racking) parabolic dish w it h St irling engine and solar t racker at " Plat aforma Solar de Almeria" (PSA) in Spain.
2.2 OPTICAL ANALYSIS
2.2.1
zyxwvutsrqponmlkjihgfedcbaZYXWVUTSRQPONMLKJIHGFEDCBA
GEOM ETRICAL OPTICS (IM AGING OPTICS)Geometrical optics studies the change of direction of luminescent rays when they interact w it h their medium.
Fundamental concepts:
Light propagates itself through rays emitted by luminescence light and can be seen when they reach an optical sensor.
An optical medium is characterized by a refraction index of n>l, which is the result of light speed in a vacuum (c) and light speed in a medium (v):
(2.5) In a vacuum, t he refraction index is equal t o one (n=l). From t he last equat ion (2.5) one can calculate the time (r) that light takes to travel a distance (s).
(2.6)
2.2.1.1 Huygen's Principle
Huygens' Principle recognizes that each point of an advancing wave front is in fact the center of a fresh disturbance and t he source of a
new
t rain of waves. In addit ion,the
advancing wave as awhole may be regarded as the sum of all the secondary waves arising from points in the medium already t raversed. This view of wave propagation helps better understand a variety of wave phenomena, such as diffract ion. [Chemisana, 2009]
A point source generates waves that travel spherically in all directions. Integration or numerical modeling can calculate the sum of the waves from all the point sources at any point beyond t he aperture.
2.2.1.2 Fermat's Principle
Fermat's Principle states that t he path traveled between t w o points by a ray of light is the path that can be traversed in the least amount of t ime. This principle can be used t o describe t he properties of light rays reflected by mirrors, refracted through different mediums, or undergoing total internal reflect ion. It can
be
deduced from Huygens' Principle, and can be used t o derive Snell's law of refraction and the law of reflection. [Chemisana, 2009]2.2.1.3 Light Propagation in a Homogeneous M edium
In a homogeneous medium, t he refraction index does not vary from one point t o another; t herefore light speed would be constant. In this case, the minimal time path stated by Fermat is
2.2.1.4 Snell's Law
Snell's law describes the relationship between incident angles and refraction. The law states that sine's ratio of incident angles and refraction is a constant that depends on the medium. Bi dimensional Snell's law can be writ t en as follows:
Where:
9: = the incident angle
82 = the out put angle
vx= light speed in first material
v2- light speed in second material
r\ i= refractive index of first light transmission material
n2= refractive index of second light transmission material
Snell's law can also be writ t en as the equivalence of refractive indices:
2.2.1.5 Refraction and Reflection Laws
When a light beam passes through a surface that is a separation limit of t w o different materials (in example air and glass), part of the beam is reflected and another part enters into the second mat erial. The transmitted beam's change of direction is known as refraction (Snell's law) and the beam reflected is known as reflect ion.
(2.7)
(2.8)
Figure 6. Refract ion and reflect ion of a beam. [NASA Dat a Glossary].
2.2.1.6 Paraxial Optics
Paraxial optics studies geometric optics scenarios where small angles
zyxwvutsrqponmlkjihgfedcbaZYXWVUTSRQPONMLKJIHGFEDCBA
6 are used. In this case (asshowed in Figure 6) it is valid to approximate the sine function to the tangent function of an arc:
In order t o understand the sine law of concentration, it is important t o understand t he radiation exchange from the Sun t o an object, based on t he second law of thermodynamics [Rabl, 1976]. The Sun is considered as a black body with a Ts temperature and is modeled as a radiant sphere.
From the principle of energy conservation, it is inferred that the energy flux varies w it h the inverse of the distance from the center of the Sun, such that the energy flux at the Earth' surface is equal to the flux over the Sun' surface in a factor of:
Where rs is the Sun's radius and drs is the distance from Earth to the Sun. The next figure shows
the geometric relation for a concentrator:
Figure 7. Diagram of a concent rat or's geomet ric relat ions. [Leut z et al. 2001].
In such conditions the energy emitted by the Sun that reaches the absorber (the Earth' surface) is: (2.9)
In these conditions, the law of refraction can be written as:
(2.10)
2.2.1.7 Sine Law of Concentration
(2.11)
(2.12)
The energy that is irradiated by the receptor (considered as a black body) at a Tr temperature is:
Where
zyxwvutsrqponmlkjihgfedcbaZYXWVUTSRQPONMLKJIHGFEDCBA
E'
r represents a fraction of radiated energy from the Sun.A
a p andA
r are t he areas ofaperture and receptor respectively.
In thermodynamic equilibrium 7"s and
zyxwvutsrqponmlkjihgfedcbaZYXWVUTSRQPONMLKJIHGFEDCBA
TR are equal, and by the second law of thermodynamic ES isequal t o ER, so:
(2.14)
Since the maximum value of
zyxwvutsrqponmlkjihgfedcbaZYXWVUTSRQPONMLKJIHGFEDCBA
E'
r is equal t o one, geometrically it can be concluded that:(2.15)
Using Snell's law t o generalize the above equation for any medium with refractive index of n the
maximum geometric concentration ratio can be expressed as:
(2.16)
Wit h n = 1.49 (for acrylic).
For a single dimension or linear concentrator the last expression can be simplified t o:
(2.17)
2.2.1.8 Geometric Concentration
Also known as the concentration ratio or area ratio is the relation of an input aperture over an output aperture, and is calculated by:
(2.18)
For a t hermodynamic concentration ideal concept (not accounting for losses due t o environmental conditions) the follow ing relation can be used:
(2.19)
Where TS = 5777 K is the temperature of the Sun's surface. [Leutz et al. 2001]
Figure 8. Relat ion of t hermodynamic t emperat ure in °C (vert ical axis) Tr,max and concent rat ion level in suns (horizont al axis) C. No t hermal losses w ere considered in t his model. [Leut z et al. 2001J.
2.2.1.9 Total Internal Reflection
Total internal reflection is the maximum angle that an electromagnetic vector can reach on a surface of a second medium (material change) wit hout a major part being reflected and not refracted through the second medium mat erial. Therefore, if the incident angle of rays is superior to t he t ot al internal reflection angle t he majority of rays will be reflect ed. The t ot al int ernal
reflection limit angle can be calculated wit h Snell's Law using a 90 degrees value for
zyxwvutsrqponmlkjihgfedcbaZYXWVUTSRQPONMLKJIHGFEDCBA
6
1.
The t ot alreflection angle calculation can be described as:
(2.18)
(2.19)
Where nA = 1 is the refraction index of air, and n2 = 1.49 is the refraction index of acrylic.
2.2.2 NON-IM AGING OPTICS
1970's, mostly at the University of Chicago [Welford et al. 1989, Winst on, 1979], and focused on design and t heoret ical fundaments of passive concentrators. Their radiation flux maximum concentration ratio is about four (low concentration level). Later researchers moved t o design and development of solar concentrators with a highlevel concentration ratio. In theory a nonimaging optical concentration is ideal, meaning that it can reach a maximum concentration ratio of n2
zyxwvutsrqponmlkjihgfedcbaZYXWVUTSRQPONMLKJIHGFEDCBA
x 43400 where " n" is the refraction index of the employed material.
Nonimaging optics was developed from geometric optics, but contrary t o image forming devices, nonimaging systems do not necessarily create an image of the source object in t he focal plane. The main goal of nonimaging optics is t o collect all the incident rays into the first aperture (entrance) of an optical system.
Nonimaging systems (reflector or refractor and receptor) are assembled depending upon the application. A high concentration ratio and small optical errors are directly related t o the length of focus and t o t he times that ray beams are reflected and/ or refracted. In t he next table a comparison of different applicationoriented concentrator devices is shown:
Table 3. Comparison of concent rat ors by level of concent rat ion rat io and t racking requirement s. [Leut z, et al.
1999].
A compound parabolic concentrator (CPC) is well suited to be used for stationary solar thermal concentrators. It can be designed for large acceptance angles allowing solar rays from different daytime positions to enter into the concentrator's aperture. In the case of an ideal concentrator, all rays will be concentrated onto the absorber. CPC's designed for small acceptance angles and a larger concentration ratio become longer and deeper. The average reflection times for each ray and angle increases, implicating higher loses.
A nonimaging Fresnel lens has slightly more optic loses than a CPC but it does not have a concentration ratio limited by reflection times and reflection angle. For higher concentration ratios the main problem is the dispersion of solar rays.
2 .2 .3 COM POUND PARABOLIC CONCENTRATOR (CPC)
A CPC is a nonimaging concentrator that consists of two concave reflectors, each a section of a different but symmetric parabola. The CPC is designed in such a way that the absorber is located over the intersection of the focus lines of both reflectors and the focus of each reflector is located on t he opposite side of the absorber. It is demonstrated that for an entrance diameter dj and an exit diameter
zyxwvutsrqponmlkjihgfedcbaZYXWVUTSRQPONMLKJIHGFEDCBA
d
2,
being the incident anglea,
the maximum concentration factor is:Where
zyxwvutsrqponmlkjihgfedcbaZYXWVUTSRQPONMLKJIHGFEDCBA
nt and n2 are the refraction index at entrance and exit respectively.(2.20)
(2.21a)
(2.21b)
(2.22)
This equation depends only on Cx and the receptor's width d2.
Figure 9. Diagram of a Compound parabolic collect or. [Leut z et al 2001].
Taking point O as reference, the profile parametric equations are:
Where
zyxwvutsrqponmlkjihgfedcbaZYXWVUTSRQPONMLKJIHGFEDCBA
cp
is the angle formed by the ray (OM ) with the parallel (P'F') line, passing through point 0.Tangents lines P and P' are parallels to the symmetry axis of the concentrator.
The concentrator height L is equal t o: L = d l
* d z
2 .2 .4
zyxwvutsrqponmlkjihgfedcbaZYXWVUTSRQPONMLKJIHGFEDCBA
FRESNEL LENSThese lenses were originally conceived to be used in lighthouses, first along the French Normandy and Brittany coasts during the era when oil lamps were used to powered lighthouses. The Fresnel lens was officially invented in 1822 by August Fresnel, who presented his lighthouse turntable design to the French Academy of Science and installed one at a lighthouse at Cordouan. These lenses were not designed for solar concentration; they were imaging devices with outward facing grooves and tips made of glass. M odern plastics, new molding techniques, and computer controlled diamond turning machines have improved the quality of Fresnel lenses, opening new horizons for possible applications such as solar concentrators.
The first attempt to use Fresnel lenses for the collection of solar energy occurred at the time when suitable plastics such as polymethyl methacrylate (PM M A) became available in the 1950's. PM M A is resistant t o sunlight, remains thermally stable up to 8o°C, its spect ral transmittance matches the solar spectrum, and its index of refraction is 1.49, which is very close to the one of glass (1.52). Currently acrylic is the material of choice for most Fresnel lenses. The following timeline outlines the history of the development of nonimaging Fresnel lenses for solar concent rat ion:
Nonim aging Fresnel lenses
Figure 10. Hist ory ofFresnel lenses. [Leut z et .al 2001].
Initially, most Fresnel lenses selected for solar energy use had not been originally designed for the collect ion of solar rays. Surprisingly, most of the major improvements in the design of Fresnel lenses have been made with solar applications in mind. Nonimaging optics has recently begun to move from t heir solar origins into related fields such as optoelectronics.
Figure 11. Table of major development s in Fresnel lenses suit able for solar applicat ions. [Leut z et al 1999].
zyxwvutsrqponmlkjihgfedcbaZYXWVUTSRQPONMLKJIHGFEDCBA
2.2.1.1
zyxwvutsrqponmlkjihgfedcbaZYXWVUTSRQPONMLKJIHGFEDCBA
Sim ple Fr esnel LensesImaging Fresnel lens design follows the same principles of geometric optics that are also used for the design of other lenses, in particular the concepts of focal length and aperture. Imaging Fresnel lenses are centered on the axis of the optical system. Imaging designs are generally created for paraxial rays. There are no design angles or acceptance halfangles.
Figure 12. Fresnel profile show ing prism 's facet s [Davis et al 2007].
Three facets form a Fresnel lens prism: an upper facet, refracting rays with t he designed angle, a lower plane facet, and a draft facet, which is inactive but necessary t o continue with the Fresnel lens profile.
The f/ number is a measure of the aperture of the lens, and describes the ratio of the effective focal length t o t he diameter of the lens. The f/ number is a measure of the flux concentration of the imaging lens:
Figure 13. Comparison of Fresnel lenses w it h grooves facing out w ard and grooves facing inw ard.
A Fresnel lens designed for a real solar concentration task has t o maximize solar radiation onto a target receiver, and not minimize optical aberrations. Inward facing grooves have a potential advantage of minimizing shading on the draft surface of each prism and also avoid dirt particles on the prism facets. For grooves " in" designs three equations can be presented t o describe the lens:
17
(2.23)
W her e/ is the focal length of the lens and R denotes the distance of the extreme paraxial ray from the optical axis of the system. Smaller f/ numbers mean larger apertures, and vice versa. Due t o their thinness, both absorption losses within the material and the change of those losses over the lens profile are minimal.
2 .2 .1 .2
zyxwvutsrqponmlkjihgfedcbaZYXWVUTSRQPONMLKJIHGFEDCBA
Grooves In or Grooves Out A Fresnel lens w it h t he same characteristics in terms of f and R can be designed with the grooves facing inwards or outwards. It can be suggested that the lens with grooves facing outward is, due to t he relatively larger prism angles, less prone t o focal errors than the lens with grooves facing inward, where a small error in prism tilt close t o the center of the lens would lead to large error due to offaxis focusing. From this point of view, Fresnel lenses that are designed t o be used as a solar concentrator should have grooves facing out ward. Unfortunately, lenses with grooves "out" are difficult t o clean and are prone t o shadowing losses, if the ray does not reach the lens in an exactly paraxial way. One might think of turning the lens around, so that the former grooves "out" are now facing " in" . This however, may lead t o total internal refraction at prism distance from the optical axis due t o the very large prism angles. Total internal reflection occurs if the refracted ray reaches the second surface at an angle greater than a critical angle. This is critical for PM M A or acrylic fn'= 1.49 to be <\>c = 42.162
(2.24a)
(2.24c)
Since from (2.24b)
(2.25)
(2.26)
(2.27)
Substituting cos
zyxwvutsrqponmlkjihgfedcbaZYXWVUTSRQPONMLKJIHGFEDCBA
OJ
with the expressionzyxwvutsrqponmlkjihgfedcbaZYXWVUTSRQPONMLKJIHGFEDCBA
f / {R1+ /2
)x
/2
gives a final expression for the prism angle a in terms of focal length/ and aperture R:
(2.28)
Figure 14 shows a Fresnel lens cross section created using above equations. The focal length is taken as/ = 100 mm, and the aperture extends over 0 < R < Rm ax by steps R/ 10, where Rmax = f, t o
attain an / / number of 0.5 for this lens (2.23).
An evident disadvantage of using a lens with grooves is the possibility of lost light due to incidence on the draft facet. The first step one may take to minimize this so called draftloss is to make the facet perfectly vertical (i.e. perpendicular to the plane of the optic). However, the reality of manufacturing requires at least a few degrees of tilt to the draft t o facilitate mold release. Nevertheless, loss can be minimized by very careful design, which optimally locates the draft facet within the "shadow" of a slope facet.
Figure 14. Sim ple Fresnel lens w it h grooves facing inw ard. Analyt ical solut ion.[Leut z et al. 1999]
2.2.1.3 Prisms Pitch and Size Considerations
Geometrically, t he smaller the prism size, the closer the small flat prism slope facets come to approximating the idealized spherical surface and the smaller the amount of material used for the concentrator device. However, the practical lens will show increasing losses for increasing numbers of grooves and prism tips, as these cannot be manufactured the way the ideal lens assumes them t o be. Also, as the pitch becomes smaller they become more efficient at acting like a grating, which will deliver more light into higher diffractive orders away from the desired focal position. An optimum balance can be achieved by choosing the pitch sized as [Egger et al. 1979]:
Figure 15. Accept ance half angles for Fresnel Lenses. [Leut z et . al 2001].
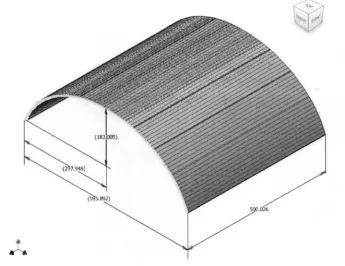
Domeshaped (3D) or arched (2D) lenses can be designed when prisms are chained along a semicircle centered at the focal point. The focal length is kept constant, and doubles as the radii of the semicircle. A shaped lens offers some advantages over flat lenses, for example:
• The shaped lens offers increased mechanical stability, and is more suited for use as a collector cover, as long as the grooves are located " in" for easy cleaning.
19
(2.29)
Where:
\ is the primary wavelength of concern, / is the focal length of the lens.
As an example, for A = 550nm (central value of the visible spectrum) and a lens of focal lengt h/ =
100mm, the optimum prism pitch size would bed = 0.35mm.
2.2.1.4 Acceptance Half Angles
The acceptance half angles on a Fresnel lens refers to a pair of angles on perpendicular planes that describes the range of angle in which incident rays would be refracted to the absorber or reflected away. The crosssectional acceptance angle 9 refers to the prism profile plane and the angle \ p is measured in the perpendicular plane t o the crosssectional plane (the transversalsection). For a
3D Fresnel Lens Concentrator (FLC, spot concentration) t he second acceptance angle
zyxwvutsrqponmlkjihgfedcbaZYXWVUTSRQPONMLKJIHGFEDCBA
0
is• The shaped lens should reduce focal aberrations to some extent, as the distance between prisms and the designed focal point is kept constant, and smaller than in flat lenses. • The shaped lens could gain some advantages based on aesthetic considerations.
Some disadvantages of the shaped lens are:
• It is more complicated to manufacture.
• The possibility of increased reflection losses due to the larger angles of incidence at the outer surface of the lens.
• Increased cosine losses at the absorber for light refracted from the lower reaches of the lens.
Figure 16. Shaped Fresnel lens profile diagram. Im age does not show t he t hickness of t he ext erior surface of t he lens. [Delgadillo 2008].
Starting out from the parameter depicted in Figure 16 the following t w o equations can be set up:
(2.30a)
(2.30b)
Wit h equations (2.32) and (2.39), f o r 7 and the prism inclination angle/ ?, respectively, Figure 17 has been derived. The design of the lens is determined by the fixed focal length, which in t urn determines the prism angle 0 (as defined in Figure 16).
Figure 17. Dome-shaped Fresnel lens w it h grooves facing inw ard. Analyt ical solut ion for const ant focal lengt h. [Leut z et al. 1999].
Once the position of each prism is det ermined, it is possible t o calculate t he focal angle co. These
algorithms are the basic knowledge for further development of Fresnel lenses.
2.3 COM PUTER AIDED ENGINEERING ( CAE)
2.3.1 COM PUTER AIDED DESIGN (CAD) W ITH AUTODESK INVENTOR
Computer aided design software is primarily used for engineering design and in t he architecture industry. Its main function is t o aid in the elaboration of technical drawings of products. CAD software is capable of modeling 2D and 3D drawings, surfaces, and solids that represents virt ual mechanical parts.
2D model creation is commonly done by applying basic shapes, such as lines and arcs, t o a plane. 3D solids are done by different types of features such t he extrusion, revolve, or sweep of a 2D profile, and later these solids are detailed wit h features like chamfers, rounds, and drills.
Figure 18. Different versions of a paramet erized 3D m odel. [Villarreal, 2008]
Anot her geometric primitive that can substitute the lines and arcs is called a spline. This t ool is a curve defined by polynomials and is created by adding control points that define the positions of the curve. Of these points only the first and the last are in contact with the curve, the other points only serve as "magnets" that attracts t he curve in a smooth way. Another approach is called int erpolat ion spline. In this technique all t he control points are in contact with the curve. 2D profiles may be completed or partially drafted using splines, allowing shape modification capability. The following image shows different versions of a model drafted using splines:
Figure 19. M odificat ions t o a paramet erized m odel creat ed w it h splines. [Cuevas, 2006].
2 .3 .2 RAY SIM ULATION ANALYSIS W ITH TRACEPRO BY LAM BDA RESEARCH
TracePro was created by Lambda Research Corporation t o aid in optical and illumination design. Ray tracing is a t ool that calculates the resulting refraction and reflection of rays when they change from one medium material and geometry to another.
TracePro is a computer aided engineering software t ool for modeling the propagation of light in imaging and nonimaging optomechanical systems. M odels are created by importing data from a lens design program or a CAD program, or by directly creating the solid geometry in TracePro.
Optical properties are assigned to materials and surfaces in the model. Source rays propagate through the model with portions of the flux of each ray allocated for absorpt ion, specular reflection, and transmission. From the model TracePro can trace rays and analyze the following phenomenon:
Light distributions in illumination and imaging systems Stray light, scattered light, and aperture diffraction Throughput, loss, or system transmittance
Flux or power absorbed by surfaces and bulk media Light scattering in biological tissue
Polarization effects Fluorescence effects Birefringence effects
TracePro features a simple interface where models, ray sources, and luminance are managed for analysis assistance. An example ray trace of an optical set of lenses is shown in this image:
2.4 GENETIC ALGORITHM S
" Genet ic Algorit hms consist s of an it erat ive process t hat evolves a w orking set of individuals called a populat ion t ow ard an object ive funct ion, or fit ness funct ion" . (Goldberg, 1989).
Genetic algorithms (GA's) are search algorithms based on the evolutive processes of natural selection and natural genetics. They combine survival of the fittest among string structures wit h a st ruct ured yet randomized information exchange to form a search algorithm, which in some ways resembles the innovative human spirit in the search for solutions. In every generat ion, a new set of art ificial creatures (strings) is created using bits and pieces of the fit t est of the old; an occasional new part is t ried for good measure. Genetic algorithms are no simple random process, as they efficiently exploit historical information to speculate on new search points wit h expectations of improved performance.
Genetic algorithms use biologically inspired techniques such as genetic inheritance, natural select ion, mut at ion, and reproduction (recombination or crossover). Along wit h genetic programming (GP), they are one of the main classes of genetic and evolutionary computation (GEC) met hodologies. GA's are typically implemented using computer simulations to find an opt imal solut ion t o a specific problem. For this problem, members of a universe of possible solut ions, called individuals, are represented using abstract representations called chromosomes.
From the genetics field, GA's use the codification of chromosomes (also called genotypes) as a basis for coding the search space of a problem in strings. Therefore the search can be performed by modifying the chromosomes until the objective is reached.
2.4.1 SIM PLE GENETIC ALGORITHM
The mechanics of a simple genetic algorithm are surprisingly basic, involving nothing more complex than copying strings and swapping partial strings. A simple GA that yields good results in many practical problems is composed of three operators: select ion, reproduct ion, and mut at ion.
The genotype is expressed as a string of genes that are represented w it h numbers (0001011101 or 2.3 3.3 9.3) in any numeral basis, although the most common is binary represent at ion. This genotype can be translated t o some characteristics called phenotype. An analogy of this could be the color of a person's hair that has a certain gene o group of genes in its chromosome that represents blond hair; this representation of the genotype is defined as the phenotype.
Table 4 below presents a representation of the genotype, phenotype, and fitness. A binary genotype is shown in the second column and is then translated to its phenotype, where the value
Figure 21. Basic GA process. [Valenzuela 2004].
of variable is
zyxwvutsrqponmlkjihgfedcbaZYXWVUTSRQPONMLKJIHGFEDCBA
" x" . This translation is done by converting the binary number value t o decimal. Then the fitness is calculated with a specified funct ion, simulation, or analysis, which in this case is the equat ion:Genotypes can represent more than one variable. The example shown in Figure 22 represents a 15 bits genotype formed by three variables, each one with a length of 5 genes. Each of this group represents a variable that can be decoded by changing their numeral basis from binary t o decimal. In this example the variable X (01010) represents a decimal value equal t o 10, and the variable Y(11001) has a value equal to 25, and Z(OllOO) has a decimal value of 12. Because each gene
group length is equal to 5, each variable can represent 31 (25
l) possible combinations.
The objective of GA's is to find a genotype (carrying the values of X, Y, Z) that maximizes or minimizes the evaluation equation result (also known as fitness or objective equation). Suppose the evaluation equation is:
If the GA objective is set to minimize the equation (2.30), the GA will have a search universe of 31 different values for each variable (X,Y,Z) and a t ot al of 29,791 possible different individuals. The GA will quickly find the individuals w it h equal values of X and Z setting the minimum (therefore optimum) possible result to zero. On the other hand, if the GA objective is set t o maximize, the optimization process will tend t o create individuals with values of X( l l l l l ) , Y(00001) and Z(00000) reaching a fitness value of V31 as the maximum possible.
The GA process can be explained w it h the following diagram:
Figure 22. Genot ype represent at ions w it h t hree variables.
Figure 23. GA process diagram. [Arcos, 2006].
The applicat ion of GA's t o an opt imizat ion problem requires representing the genotype in a way so that the GA may handle it , as GA handling capabilities depends on the GA method selected. Commercial GA packages can work directly with real number values, which simplify the genotype representation requirement.
Aft er a genotype representation is set, an initial population must be created to be evaluated and be the starting point of the opt imizat ion process. Termination criteria are specific conditions of the developed population that will indicate the GA to finalize the optimization process. The most common t erminat ion criteria are:
M aximum number of evaluations M aximum fitness value reached
Convergence of fitness values, meaning a minimum percentage of change of evaluation values in several generations.
New populations are created by three basic actions:
• Select ion: Individuals w it h the highest fitness values are selected t o reproduce more times than individuals w it h average fitness values. Individuals w it h low fitness values are not
selected to reproduce. There are several methods t o select which individuals w ill reproduce (pass their variable values to the crossover or gene pool).
Crossover: Selected individual's genes are mixed with each other t o create new
individuals, and there are several methods to do so; the
zyxwvutsrqponmlkjihgfedcbaZYXWVUTSRQPONMLKJIHGFEDCBA
roulet t e w heel and shuffle randomare the most common methods because of their easy programmability and satisfactory performance. The basic parameters to setup are: probability of crossover, number of parents, and number of offspring.