1
Processing of long-term acoustic measurements
B. Plassat1, S. Bloquet1, C. Freneat1, Nelson Dias2
1
01dB-Metravib
2
MRA Instrumentação
Abstract
Many standards and European directives relative to noise are used to assess an acoustic situation, based on long-term indicators such as Lday, Lnight or Levening. These indicators are defined mainly as the mean yearly equivalent acoustic level on a particular part of the day. Acoustic measurements are performed on reference periods representative of the typical acoustic situation. An Oper@ monitoring system performed measurements for two years on several points. An acoustic database of the one-second integration time measurement was created. Different kinds of calculations were performed on these data, the variant being the measurement time considered. This study evaluates the convergence of the classic equivalent level with these long-term indicators
Keywords: acoustic measurements.
1
Introduction
Environmental acoustics has progressed step by step: from the direct instantaneous measurement to the integration during 30 minutes. Then, it has been increased from 30 minutes to 8 hours measurements and now the electronic improvements allow to perform measurement during more than a month. In each steps of evolution, new acoustic indicators have been created to give a better evaluation of the situation: from Fast, Slow or Impulse Lp to Leq, from Leq to Statistics. Reference periods have also been extended.
Concerning assessment and management of environmental noise, the indicator Lden is one of the indicators presented to be relevant of the long term noise exposition level. In other cases such as construction areas, it may be a dose calculation or a sliding Leq which is defined to be representative. In each case, the evaluation or the measurement of these indicators are defined on a reference period: a day, a month, a year.
2
2
Measurement point
Since several years, 01dB-metravib has proposed acoustic monitoring systems. Several key points have been monitored during more than two years in order to evaluate the instrumentation capabilities. The typical approach consists in recording the LAeq with 1s integration time. A database has been realized which allows to extract, compute and view the recorded measurements.
LMCU (Lille Métropole Communauté Urbaine) has been equipped of acoustic monitoring systems from several years [1]. Systems are used to evaluate the acoustic situation day by day on each point. Automatic reports are created every night taking into account the last 24h measurement acquired. This allows to be as reactive as possible when a complaint is sent to the organism.
Based on this fruitful experience and using the 01dB-Metravib measurement database, the computation of the results has been performed in order to study the recomposition period.
2.1 Location
The measurement is performed on the top of a house, more or less at 5m above the grown. The system has been setup beginning of 2005 and is now operating without interruption.
2.2 Measurement devices
[image:2.612.287.331.450.529.2]The measurement system is an Oper@ Ex and several smaller units Oper@ RF (with radio frequency data transmission). Microphones are protected by a weatherproof windscreen. An mounting kit has been used on each point to enable the fixation of the devices.
Fig.1: Monitoring measurement system: Expert Oper@ unit
3
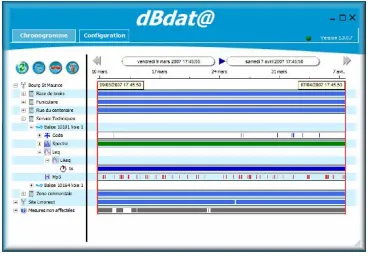
Fig.2: dBdat@ data collection software
2.3 Setup
The Oper@ has been setup for a hardness measurement configuration: each second the system measures the LAeq, and spectrum values. This configuration has been performed remotely using a specific VPN network and dB@dmin software.
3
Computation
For this study, only the LAeq indicator is computed. The conclusions will deal with this A frequency weighting but very few calculations may demonstrate that the same approach may be used. The approach consists in a comparison of different measurement years.
3.1 Classical approach
In the very beginning, the first step is to have a rather classical overview of the measurement (Table 1).
Table 1: Classical computation of several years on the same point
Year Leq L90 L10
2005
(second half) 54.3 dBA 47.2 dBA 55.3 dBA
2006 55.0 dBA 47.2 dBA 56.3 dBA
2007 59.4 dBA 47.4 dBA 56.5 dBA
[image:3.612.183.428.537.661.2]4
the comparison is not directly useful. The following of the study will consider only the last 2 complete years 2006 and 2007.
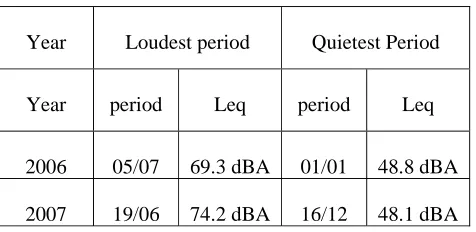
[image:4.612.189.427.173.289.2]Table 2 confirms that 2007 had more important noisy periods in terms of acoustic level.
Table 2: Noisiest periods in 2006 / 2007
Year Loudest period Quietest Period
Year period Leq period Leq
2006 05/07 69.3 dBA 01/01 48.8 dBA
2007 19/06 74.2 dBA 16/12 48.1 dBA
3.2 Lden approach
Considering now that the Lden defined in [2] and requested in [3] may be more representative than the classical Leq values, The Lden has been computed for each week and compared one by one in the Figures 3 to 5
0 10 20 30 40 50 60 70 80
0 10 20 30 40 50 60
[image:4.612.201.412.411.496.2]lday 2006 levening 2006 Lnight 2006
Fig.3: 2006 weekly indicators
0 10 20 30 40 50 60 70 80
0 10 20 30 40 50 60
lday 2007 levening 2007 Lnight 2007
5 50 55 60 65 70 75
0 10 20 30 40 50 60
[image:5.612.199.412.95.186.2]lden 2006 lden 2007
Fig.5: Lden comparison between 2006/2007
The annual mean calculation of Lden indicates a difference of 1.9 dBA. Considering that the situation is announced changed when a gap of 5dBA is proved, it is necessary to assess the indicator in a tolerance of 2.5dBA
A maximum of more than 10 dBA is observed in weekly indicators (Lday, Levening, Lnight). Considering that the more accurate value may be the Lden on the complete year, the
question is: from which integration time the indicator will converge to the final value? Each indicator is recomposed successively over one week, two weeks, three weeks, (…) and the result is compared to the means of all values from the 52 weeks. Figure4 presents the 2006 convergence factor observed versus the number of weeks considered.
-1 0 1 2 3 4 5 6
0 10 20 30 40 50 60
[image:5.612.195.419.378.479.2]Lday 2006 moyen Levening 2006 moyen Lnight 2006 Lden 2006
Fig.6: 2006 convergence factor for several indicators
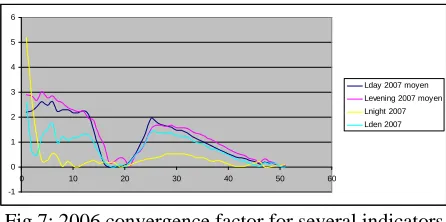
The convergence is conforming to 2.5 dBA around 10 weeks integration time, meaning more than 2 months. Figure 6 presents the same calculation for 2007.
-1 0 1 2 3 4 5 6
0 10 20 30 40 50 60
Lday 2007 moyen Levening 2007 moyen Lnight 2007 Lden 2007
Fig.7: 2006 convergence factor for several indicators
[image:5.612.194.417.539.650.2]6
3.3 Synthesis
In both classical and Lden approaches the increase of the noise has been validated between 2006 and 2007. The weekly computation of the data presents a 10 dBA variation or more. The assessment of a convergent value has been obtained with computation of 20 weeks at least. The convergence may be disturbed by specific events that occur around the measurement. So knowledge of the major events during the measurement is necessary to validate the result.
David Ecotière [4] explains that, considering the meteorological modification, the assessment of an accurate and representative long term value may be obtained considering at least 10 years measurement and integration.
3.4 To continue
The same calculation must be achieved in other type of locations to quantify the convergence in each kind of situations (construction area, urban noise, traffic noise, …). This convergence may be defined for each situation the representative period is to analyse.
A library of major events must be created in order to monitor as extensively as possible a situation (roadwork, new equipment, or traffic change for example) in the same way of thinking that, today, acousticians notice the measurement events occurring during a classical 8h calculation (dogs, cars, horn, meteorological condition, …).
4
Conclusion
From a data collection on a simple case, the calculation of several indicators has presented a convergence factor that may be used to evaluate properly a situation. The conclusions of a situation must include this vision in order to avoid basic weekly approach mainly used. A collection of situations or an evaluation of this factor must be done before running evaluation. The assessment of a long term result by measurement is one of the new challenges of acousticians. The previous evaluation of a noisy situation must be readapted for the new time period. Large collection of data creates new calculation and new way of measuring
References
[1] F. Chopard, S. Bloquet, L. Faiget, C. Aujard (01dB-metravib), P. Thomas(LMCU) - "The fundamental contribution of noise measurement networks to the application of European Directive 2002/49/EC", Internoise 2007, Ref. 585EN.
[2] ISO1996-2 2007 "Description, measurement and assessment of environmental noise - Part 2: Determination of environmental noise levels.
[3] European directive 2002/49/CE relating to the assessment and management of environmental noise, Official Journal of the European Communities, L182/12.