A STUDY OF ALTERNATIVE SELECTION MECHANISMS FOR MULTIPLE CROSSOVER PER COUPLE IN GENETIC ALGORITHMS
ESQUIVEL S. C., LEIVA H. A., GALLARD, R. H.
Proyecto UNSL-3384031 Departamento de Informática
Universidad Nacional de San Luis (UNSL)
Ejército de los Andes 950 - Local 106
5700 - San Luis, Argentina.
E-mail: {esquivel, aleiva, rgallard}@unsl.edu.ar
Phone: + 54 652 20823
Fax : +54 652 30224
Abstract
Multiple crossover per couple (MCPC) is a newly introduced crossover method which in contrast with the single crossover per couple approach (SCPC), permits more than one crossover operation for each mating pair. MCPC was applied to optimise classic testing functions and some harder (non-linear, non-separable) functions. The goodness of this approach prevailed under all tests and revealed that, when MCPC is applied with 2, 3 and 4 crossovers per couple, results as good as under SCPC can be expected with an additional benefit in processing time. This performance was obtained through the ability showed by MCPC of exploiting the recombination of good, formerly found solutions. But on the other hand, those experiments also showed that, in some cases, the method increased the risk of premature convergence due to a loss of genetic diversity.
This paper gives an insight of the convenience of binding the choice of a selection mechanism to the genetic operators used. Focussing on this problem experiments with MCPC under proportional, and ranking selection methods were performed. In the case of ranking, an adaptive approach was carried out to adjust selective pressure.
Descriptions of the alternative selection mechanisms used, experiments and some of the results obtained under each method are shown.
Keywords: genetic algorithms, selection mechanisms, crossover, function optimisation.
1
A STUDY OF ALTERNATIVE SELECTION MECHANISMS FOR MULTIPLE CROSSOVER PER COUPLE IN GENETIC ALGORITHMS
1.INTRODUCTION
Selection favours reproduction of better individuals by imposing a direction on the search process. It does not create new individuals; instead it selects comparatively good individuals from a population and typically does it according to their fitness. The idea is that interacting with other individuals (competition), those with higher fitness have a higher probability to be selected for mating. In that manner, because the fitness of an individual gives a measure of its quality, selection introduces the influence of the fitness function to the evolutionary algorithm process. Besides, selection is the only operator in evolutionary approaches where the fitness of an individual affects the evolution process. In such a process two important, highly related, issues exist: population diversity and selective pressure.
The former stands for exploration of the searching space and the later is responsible of the exploitation of information gathered so far. Selection plays an important role here because strong selective pressure can lead to premature convergence and weak selective pressure can make the search ineffective [1]. Focussing on this equilibrium problem significant research has been done.
From the above discussion we can conclude that a selection mechanism should be the driving force to conduct the search towards better individuals but also it is concerned of maintaining a high genotypic diversity, to avoid stagnation.
MCPC is a crossover method [2] that enforces the exploitation of good solutions encountered so far, and consequently an appropriate selection mechanism ought to be coupled with it in order to avoid rapid loss of genetic diversity.
The present paper gives an insight of the effectiveness of ranking to control loss of genetic diversity.
Here we propose a deterministic rule to control the number of expected offspring for the best individual according to the progress, measured as the number of generations, in the evolution process.
A comparative analysis of genetic diversity is shown, contrasting proportional selection and ranking selection for the optimization of two hard testing function: the Schweffel’s function f7 [3], a highly multimodal function and the Easom’s function f5 [4] a difficult unimodal function.
2. PROPORTIONAL AND LINEAR RANK-BASED SELECTION MECHANISMS
For the following discussion it is convenient to adopt the notation used by Bäck [5]. Let us call I the space of individuals a ∈ I and f : I → R a real-valued fitness function. Let be µ the population size and P(t) = (a1
t
..., aµ t) ∈ Iµ a population at generation t.
In proportional selection, an individual ai is randomly chosen at time t, for mating from a
population of size µ according to the following probability:
∑
= = µ1 ) (
) ( )
(
j j i i
sel
a f
a f a
P
This is the simplest selection scheme also known as stochastic sampling with replacement. Here, individuals are mapped to contiguous segments in the real interval [0,1] such that a segment corresponding to an individual has a size equal to the individual fitness. Then a random number in such interval is generated and the individual whose segment embodies the random number is selected.
ranking the selective pressure can be controlled by the user. The Baker’s original linear ranking method assigns a selection probability that is proportional to the individual’s rank. Here, according to Bäck [5] the mapping rank: I→{1,...,µ} is given by:
{
}
{
1,..., 1}
: ( ) ( ) ) ( : ,..., 1 1 + ≤≥ − ∈ ∀ ⇔ = ∈ ∀ j j i a f a f j i a rank i µ µwhere ≤≥ denotes the ≤ relation or the ≥ relation for minimization or maximization problems res-pectively. Consequently the index i of an individual ai denotes its rank. Hence, individuals are
sorted according to their fitness resulting a1 the best individual and aµ the worst one. Assuming
that the expected value for the number of offspring to be allocated to the best individual is ηmax
=µP(a1) and that to be allocated to the worst one is ηmin =µP(aµ) then
( )
−
−
⋅
−
−
=
1
1
)
(
1
µ
η
η
η
µ
i
a
P
sel i max max minAs the following constraints must hold
i a
Psel ( i) ≥ 0 ∀
∑
==
µ 11
)
(
i i sela
P
it is required that:
max min
max
η
η
η
≤ = −≤ 2 and 2
1
The selective pressure can be adjusted by varying ηmax . As remarked by Baker if ηmax = 2.0 then
the population is driven to convergence during every generation. To restrain selective pressure, Baker recommended a value of ηmax =1.1. This value for ηmax close to 1 leads to Psel (ai) ≅ 1/µ ,
almost the case of random selection.
3. DETERMINISTIC DYNAMIC RANKING SELECTION (DDRS)
It is not an easy task to tune ηmax, the expected value for the number of offspring for the best
individual. This parameter influences selective pressure. Here we propose DDRS, a deterministic and dynamic method to update this parameter as a function of the number of generations reached. In this case ηmax is given by the following expression:
(
)
gen
max
gen
max
gen
current
max
#
_
_
#
_
#
+
=
η
By using this variant of ranking we attempt to enforce exploration during the earlier stages and exploitation during the final stages of the evolution process. At the beginning selective pressure is weak and increases smoothly through the iterations reaching the maximum selective pressure allowed by ranking at the end of the process. In this way we can expect to slow the convergence rate to prevent being trapped in local optima.
3.1. EXPERIMENTS
Experiments were designed to compare results when optimizing Easom’s [4] and Schweffel’s [3] functions (see table 1) under MCPC and SCPC, using proportional selection (PS), static ranking selection (SRS) and DDRS.
For SRS two values of ηmax were considered, ηmax = 1.2 (low selective pressure) and ηmax = 1.6
Series of many runs were performed on each function, with randomised initial population of size fixed to 100 individuals, using binary coded representation, elitism, one point crossover and bit flip mutation. The number of generations was fixed to 500 and probabilities for crossover and mutation were fixed to 0.65 and 0.05, respectively.
Notation Description Characteristics
f5: Easom's Function
Unimodal,
the global minimum has a small area relative to the search space
Dim.
f7: Schwefel's Function 7
( )
( )
[
500,500]
: 1 , 7 − ∈ = ⋅ − =
∑
i i i i x n i for x sin x x f &n = 5
[image:4.612.88.527.389.680.2]Highly multimodal, the global minimum is geometrically distant from the next best local minima. Table 1. Objective functions
The following variables were chosen for the analysis
Name Description
Quality Is the ratio
value opt value best _
_ between the best value and the optimal value. It gives a measure for the quality of a solution.
GenDiv
Genetic diversity of the population, in terms of the bias measure defined by Grefenstette [8].
(
)
∑
∑
∑
= = = = =
−
⋅
=
l j i t j i i t j i t j i t j imax
l
b
1 1 1 , 0 1 , , ,,
1
1
µ α µ αα
α
µ
,(
1,...,
)
∀
=
(
,1,...,
,)
∀
≥
0
=
∀
P
a
a
a
ktlt
t k t k t t
t
α
α
µ ,
where l is the chromosome length and ati,j denotes the allele value.
The bias b (0.5 ≤ b ≤ 1.0) indicates the average percentage of the most outstanding value in each position of the individuals. Smaller values of b indicate higher genotypic diversity and vice versa.
Dtime Defined as in [2]. Running time difference. It is the percentile of time reduction
3.2. RESULTS
In the following figures, S stands for SCPC and Mi stands for MCPC with i crossovers per couple.
Function f7
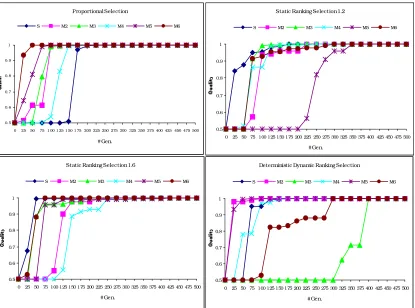
The diverse graphs embodied in fig. 1 represent the performance of the algorithm reaching the optimum under SCPC and MCPC for each of the selection methods used. In the case of SRS, the value of ηmax is explicitly denoted in the title.
As expected PS shows a faster convergence, after 50 generations, to the optimum and MCPC for 2 crossovers per couple behaves better than SCPC.
With SRS (1.2) the best individual is found later due to the low selective pressure, and better
results remain suboptimal, after 375 generations for 3 crossovers per couple.
When selective pressure is augmented in SRS (1.6), results are optimal after 100 generations when 4 crossovers per selected couple are allowed.
Finally, with DDRS optimal values are found after 275 generations for 3 and 4 crossovers per couple. It seems that by using DDRS we became more independent of the number of crossovers used. This also can be observed in figure 2. In this general overview, we show the mean Quality values
0,5 0,6 0,7 0,8 0,9 1
0 25 50 75 100 125 150 175 200 225 250 275 300 325 350 375 400 425 450 475 500
#G e n.
[image:5.612.96.519.226.544.2]P S S RS 1.2 S RS 1.6 DDRS
[image:5.612.99.306.568.719.2]Figure 2: Quality average values for f7.
Figure 1: Quality values for f7 under different selection methods
P ro po rtio na l S e le c tio n
0,5 0,6 0,7 0,8 0,9 1
0 25 50 75 100 125 150 175 200 225 250 275 300 325 350 375 400 425 450 475 500
#G e n.
S M2 M3 M4 M5 M6
Static Ranking Selection 1.2
0,55 0,675 0,8 0,925
0 25 50 75 100 125 150 175 200 225 250 275 300 325 350 375 400 425 450 475 500
#Gen.
Quality
S M2 M3 M4 M5 M6
Static Ranking Selection 1.6
0.5 0.625 0.75 0.875 1
0 25 50 75 100 125 150 175 200 225 250 275 300 325 350 375 400 425 450 475 500 #Gen.
S M2 M3 M4 M5 M6
Deterministic Dynamic Ranking Selection
0.52 0.64 0.76 0.88 1
0 25 50 75 100 125 150 175 200 225 250 275 300 325 350 375 400 425 450 475 500
#Gen.
obtained with each selection method applied through all runs, under either SCPC or MCPC.
Figure 2 shows that, independently of the number of crossover, PS have a rapid convergence to the optimum. SRS (1.2) is slower than SRS (1.6) and both stagnate after certain point. DDRS shows a smooth but continuous approach to the optimum and in the limited number of generations outperforms both static ranking approaches.
It is worths remarking here that the best individual was found always under MCPC, independently of the selection method used, and differences between values obtained with diverse selection methods remain lower than 0.001.
Referring to genetic diversity figure 3 shows mean values of GenDiv through all the series for each selection method.
As expected lower genetic diversity is showed by PS. In SRS, the values for the bias b remain stable around 0.65 for ηmax =
1.2 and 0.66 for ηmax = 1.6 after as few as 25
generations.
In DDRS, increase of selective pressure is achieved as long as the simulation progresses. In early stages when exploration is needed, the behaviour is similar to that of SRS (1.2) and in final stages, when exploitation is required, b reaches values comparable with those of PS, but smaller (0.67 to 0.68).
Dtime values varying from 3% to 7% were detected along the experiments.
Function f5
Graphs embodied in fig. 4 represent the performance of the algorithm reaching the optimum under SCPC and MCPC for each of the selection methods used.
In the case of minimizing this hard unimodal function, the fitness landscape consists of a large plane with a small hole towards a basin. When PS is applied, all runs corresponding to MCPC converge faster than SCPC, but after 225 generations all runs reach the optimum independently of the number of crossover allowed. When any ranking method is used SCPC ameliorates the speed achieved under PS.
DDRS slows more the search, but after 400 generations all runs reach the optimum.
[image:6.612.97.309.205.355.2]In general all the graphics show a similar behaviour of the selection methods: big jumps in Quality values are observed between near generations. This happens because individuals of the population are “walking” around the plane, and no information exists about their relative “goodness”: all of them have the same fitness. But when one of them falls towards the basin it becomes a super-individual which pull down other individuals towards the basin.
Figure 3: GenDiv average values for f7
0.55 0.6 0.65 0.7 0.75
0 25 50 75 100 125 150 175 200 225 250 275 300 325 350 375 400 425 450 475 500
# Gen.
In figure 5, when we analyse the Quality of solutions, independently of the number of crossovers, we cannot establish a clear difference between selection methods as we did in the multimodal case. Until we reach 150 generations (about a third of the simulation time) all selection methods show similar progress to the optimum but after this point they show a behaviour analogous to the the multimodal case (fig. 2): PS and SRS (1.6) are faster and SRS (1.2) and DDRS are slower. For this function any of the ranking selection methods found the optimal value under MCPC. This was not always achieved under PS.
During initial populations the degree of genetic diversity is very low until a capricious mutation occurs.
In figure 6 we can see that the bias b which measures the genetic diversity remains between 0.65 and 0.67, independently of the selection method used.
This is again a consequence of the fitness landscape. Most of the population remains
Figure 6: GenDiv average values for f5
0,55 0,57 0,59 0,61 0,63 0,65 0,67 0,69
0 25 50 75 100 125 150 175 200 225 250 275 300 325 350 375 400 425 450 475 500
#Gen.
[image:7.612.101.516.47.355.2]PS DRS SRS 1.2 SRS 1.6
Figure 5: Quality average values for f5
0,5 0,6 0,7 0,8 0,9 1
0 25 50 75100 125 150 175 200 225 250 275 300 325 350 375 400 425 450 475 500
#G e n.
P S S RS 1.2 S RS 1.6 DDRS
Proportional Selection
0.5 0.6 0.7 0.8 0.9 1
0 25 50 75 1 00 1 25 1 50 1 75 200 225 250 275 300 325 350 375 400 425 450 475 500
#Gen.
S M2 M3 M4 M5 M6
Static Ranking Selection 1.2
0.5 0.6 0.7 0.8 0.9 1
0 25 50 75 100 125 150 175 200 225 250 275 300 325 350 375 400 425 450 475 500
#Gen.
S M2 M3 M4 M5 M6
Static Ranking Selection 1.6
0.5 0.6 0.7 0.8 0.9 1
0 25 50 75 100 125 150 175 200 225 250 275 300 325 350 375 400 425 450 475 500
#Gen.
S M2 M3 M4 M5 M6
Deterministic Dynamic Ranking Selection
0.5 0.6 0.7 0.8 0.9 1
0 25 50 75 100 125 150 175 200 225 250 275 300 325 350 375 400 425 450 475 500
#Gen.
S M2 M3 M4 M5 M6
[image:7.612.96.305.394.732.2]on the plain until the influence of a super-individual changes dramatically the population distribution on the landscape.
4. CONCLUSIONS
The present paper shows the influence of alternative selection mechanisms on distinct type of function optimization problems when SCPC and MCPC are applied. Moreover a non-traditional dynamic deterministic parameter control approach (DDRS) for ranking selection to adjust the number of expected children for the best individual, is proposed.
In the case of the hard multimodal function it is observed that except for SRS (1.2) all other methods find the optimum value for some number of crossovers before the end of the simulation. PS resulted in general, more efficient in this case. Moderate SRS (1.6) is the best when four crossovers are allowed. DDRS, efectively tunes the selective pressure to low values when exploration is needed and gradually increments it to higher values as simulation time progresses. Even if it didn’t seem of too much help in this case this effect is necessary to avoid premature convergence in more complex multimodal fitness landscapes.
About maintenance or loss of genetic diversity, results were as expected for each selection method.
In the case of the hard unimodal function it is observed that when any ranking method is used then SCPC improves its own results obtained by using proportional selection.
Here with diverse convergence speeds all the selection mechanisms find the optimal for any number of crossovers. Former studies with similar parameter settings were unsuccessful in finding the optimum.
Regarding to maintenance or loss of genetic diversity, results are greatly affected for this peculiar fitness landscape and not a clear difference between methods can be stablised.
Summarising, the use of rank-based selection methods is in general better than PS when combined with MCPC.
5. ACKNOWLEDGEMENTS
We acknowledge the cooperation of the project group for providing new ideas and constructive criticisms. Also to the Universidad Nacional de San Luis the CONICET, and the ANPCYT from which we receive continuous support.
6. BIBLIOGRAPHY
[1] Michalewicz, Z.: Genetic Algorithms + Data Structures = Evolution Programs. Springer, third revised edition, 1996.
[2] Esquivel S., Leiva A., Gallard R.: Multiple crossover per couple in genetic algorithms. Proc. of the 4th IEEE Conf. on Evolutionary Computation (ICEC'97), ISBN 0-7803-3949-5, Indianapolis, USA, April 1997.
[3] Schwefel, H. P.: Numerical optimization of computer models. Chichester: Wiley & Sons, 1981. In [10].
[4] Easom, E.: A survey of global optimization techniques. M. Eng. Thesis, Univ. Louisville, Louisville, KY, 1990. In [10].
[5] Bäck T: Evolutionary algorithms in theory and practice. Oxford University Press, 1996.
[7] Bäck T., Hoffmeister F.: Extended selection mechanisms in genetic algorithms. Proc. of the 4th Int. Conf. on Genetic Algorithms, Morgan Kaufmann, 1991.
[8] Grefenstette John J.: A User´s Guide to Genesis. Navy Center for Applied Research in AI, Washington, D. C., 1987. In [7].
[9] Esquivel S., Leiva A., Gallard R.: Multiple Crossover per Couple in Genetic Algorithms. Proceedings of the Fourth IEEE Conference on Evolutionary Computation (ICEC'97), Indianapolis, USA, April 1997.