Steady Sensitivity Distributed Acoustic Sensors
8
0
0
Texto completo
(2) This article has been accepted for publication in a future issue of this journal, but has not been fully edited. Content may change prior to final publication. Citation information: DOI 10.1109/JLT.2018.2877849, Journal of Lightwave Technology. > REPLACE THIS LINE WITH YOUR PAPER IDENTIFICATION NUMBER (DOUBLE-CLICK HERE TO EDIT) <. 1. Steady-sensitivity distributed acoustic sensors María R. Fernández-Ruiz, Hugo F. Martins, Luis Costa, Sonia Martin-Lopez, and Miguel GonzalezHerraez Abstract—Distributed acoustic sensors (DAS) based on phasesensitive optical time-domain reflectometry (φOTDR) have demonstrated interesting performance for many applications ranging from seismology to pipeline protection. However, the sensitivity of traditional DAS relying on coherent detection is strongly dependent on the system noise and trace fading points, offering poor reliability of the results in the spatial dimension. In this manuscript, we evaluate the statistical performance of a recently proposed DAS technique, namely, chirped-pulse φOTDR, in terms of sensitivity and signal-to-noise ratio (SNR). Our results show behavioral trends that significantly differ from those of traditional DAS. In particular, the acoustic SNR distribution in chirped-pulse DAS is notably narrower than in the traditional case, allowing to ensure a large system dynamic range across all the points of the optical trace. Hence, chirpedpulse φOTDR offers localized perturbation detection with very high reliability, almost independent of trace fading points, along the complete reachable range of the sensor. Index Terms— Chirp modulation, optical time domain reflectometry, phase noise, Rayleigh scattering, remote sensing. I. INTRODUCTION. D. the last decades, we have witnessed a vertiginous technological progress in most aspects of our lives, e.g., in civil infrastructures, transportation, communications, computing, health, etc. As we benefit from increasingly sophisticated structures and systems, it becomes necessary to manage and monitor them in a more complex way. The pursued paradigm is the use of resourceful technology that grants those systems the capacity for automation, selfmonitoring and even self-reparation. The achievement of this goal entails an increasing need for faster, higher resolution and higher complexity sensing tools, able to determine or even predict their state. URING. Manuscript received Month xx, xxxx; revised Month xx, xxxx; accepted Month xx, xxxx. Date of publication Month xx, xxxx; date of current version Mont xx, xxxx. This work was supported in part by: The European Research Council through project U-FINE (Grant 307441); the EC Horizon 2020 program through the FINESSE project MSCA-ITN-ETN-722509; the DOMINO Water JPI project, under the WaterWorks2014 co-founded call by EC Horizon 2020 and Spanish MINECO; the Spanish MINECO through project TEC2015-71127-C2-2-R; and the regional program SINFOTON-CM: S2013/MIT-2790. The work of MRFR and SML was supported by the Spanish MINECO (“Juan de la Cierva” and “Ramón y Cajal” contracts, respectively). The work of LC was supported by the FINESSE project. M. R. Fernández-Ruiz, H. F. Martins, L. Costa, S. Martin-Lopez and M. Gonzalez-Herraez are with the Departamento de Electrónica, Universidad de Alcalá, 28805 Madrid, Spain (e-mail: [email protected], [email protected]; [email protected]; [email protected]; [email protected]).. In this compelling scenario, optical sensors have risen as a critical technology with interesting benefits over more traditional (electrical) sensors [1-4]. A particular kind of optical sensors, namely, distributed acoustic sensors (DAS) have recently attracted much attention for their use in a wide range of applications, such as health monitoring of civil infrastructures, detection of leaks or flow irregularities in oil or gas pipelines, monitoring of roads, borders or perimeters, and more [4-6]. These sensors behave as an array of virtual microphones along the fiber length, i.e., detecting perturbations at acoustic frequencies (up to the hundreds of kHz regime) in real time, and only separated by the spatial resolution [7,8]. In DAS, the optical fiber is both the sensing element and the communication channel, allowing for immediacy in event detection and a significant reduction of the system complexity and cost when thousands of points have to be monitored. DAS have experienced a substantial technical development in the last few years [9-12]. The principle of operation of DAS mainly relies on the Rayleigh scattering occurring along the fiber. The use of coherent laser sources allows for the realtime monitoring of vibrations with high bandwidth, only limited by the fiber length (e.g., tens of kHz for a few km), and potential for very high spatial resolution (down to the cmscale) [12]. Additionally, by using more sophisticated implementations, as those including laser frequency sweeping or the coherent detection of the backscattered trace, true temperature and strain changes can be monitored [13,14]. Although very promising, the aforementioned implementations entail serious shortcomings. Frequency sweeping strategies involve a significant increase in the complexity of the system and in the measurement time, consequently reducing the sensing bandwidth and hence hindering the sensing at acoustic frequencies. On the other hand, the coherent detection of the received traces is a challenging task. First, the optical trace and the local oscillator must be coherent along the whole fiber length, either imposing the need for extremely high coherent lasers or reducing the length range of the sensor. A complete phase characterization requires polarization diversity, complicating the sensor scheme [15]. Besides, phase detection is severely affected by the fading points caused by the interference of Rayleigh backscattered light, as well as by phase and amplitude noise in the trace, which may lead to very noisy measurement locations as well as faulty phase unwrapping [8,9]. Efforts to avoid this fundamental problem have been made, but typically at the expense of increasing the system computational load and/or sacrificing sensing performance [16]. The fact that the phase. 0733-8724 (c) 2018 IEEE. Personal use is permitted, but republication/redistribution requires IEEE permission. See http://www.ieee.org/publications_standards/publications/rights/index.html for more information..
(3) This article has been accepted for publication in a future issue of this journal, but has not been fully edited. Content may change prior to final publication. Citation information: DOI 10.1109/JLT.2018.2877849, Journal of Lightwave Technology. > REPLACE THIS LINE WITH YOUR PAPER IDENTIFICATION NUMBER (DOUBLE-CLICK HERE TO EDIT) < measurement noise is different across the different trace positions implies that the acoustic measurements present spatially varying sensitivity along the fiber. Such variations in acoustic sensitivity have been theoretically and experimentally assessed in detail [8], showing that a long-tail statistical distribution of the sensitivity is expectable in any DAS system based on coherent detection. The obtained shape of the sensitivity distribution has made evident that this kind of sensors has unacceptable levels of signal-to noise ratio (SNR) in a substantial number of locations. A recent work has introduced a novel DAS interrogation method that is able to quantify strain and temperature variations with no need for laser frequency scanning or coherent detection, and simply using direct detection [17]. It is based on the frequency-to-time mapping induced by the propagation of highly chirped probe pulses. This technique offers localized detection of the perturbation (as opposed to the coherent-detection case, in which the effect of the temperature/strain variation accumulates along the fiber length), still maintaining the spatial resolution and acoustic bandwidth of traditional DAS. Further analyses on this novel implementation have also revealed its robustness against laser phase noise, allowing for the use of moderate coherence lasers (still higher than the pulse width) while keeping an acceptable level of SNR [18]. In this work, we evaluate the performance of chirped-pulse DAS in terms of SNR and sensitivity. Our study shows that the behavioural trend of chirped-pulse DAS is substantially different from that of traditional schemes under similar conditions of resolution and acoustic bandwidth. In particular, we have observed that the attained sensitivity histogram is orders of magnitude narrower than that measured from conventional coherent-detection DAS [8]. Besides, the sensor exhibits a large dynamic range (>300) for a well-conditioned optical trace, even when accepting only 1% of interrogation locations with SNR<1. This situation contrasts with the conventional case, in which the dynamic range is extremely low (<2) when allowing for 1% of interrogation locations with SNR<1. These outstanding features, together with their high resolution and robustness against laser phase noise, may position chirped-pulse DAS technology as critical sensing tool in future intelligent systems. II. STATISTICAL PROPERTIES OF CHIRPED-PULSE DAS Distributed acoustic sensors based on Rayleigh scattering, and more in particular those using a coherent light source (i.e., the so-called phase-sensitive optical time-domain reflectometers or φOTDRs), have been extensively studied and improved in recent years. Comprehensive descriptions of the fundamentals and main applications of this kind of sensors can be found in the literature [13-19]. Essentially, the propagation of coherent pulses over the fiber under test (FUT) produces backscattered traces as a result of the interference between light reflected from multiple small inhomogeneities along the fiber. The backscattered field, ek t , presents a random but deterministic pattern,. ek t Ak t exp jk t ,. 2. (1). where the subscript k stands for the trace generated by the k th pulse; t is the time index along the trace, Ak t is the backscattered amplitude field distribution, which is Rayleighdistributed, and fk ( t ) is the trace phase, which has a uniform distribution in. {-p ,p } .. In chirped-pulse DAS, the trace is. detected using direct detection, thus. pk t Ak2 t nk , PD t sk t nk t . The acquired traces,. Ak2 t ,. (2). have an exponential. distribution, while the term nk , PD t represents additive noise components arisen by the photodetection process, e.g., thermal, shot, signal-noise beating and noise-noise beating. The right-hand side of (2) simply points out the notation using later in this Section. Optical (amplitude and phase) noise has been neglected in the analytical model for the sake of simplicity. Nevertheless, additive noise components arisen from amplitude optical noise can be readily included in the term nk , PD t , while phase noise does not play a significant role in chirped-pulse DAS as it can be readily compensated (proved in [18] and revisited in Section III). A temperature or strain change in a section of the FUT induces a refractive index variation, n , which in turn translates into a change in the optical path difference between scattering centers. The light that adds up coherently in this region is therefore frequency-shifted by an amount proportional to the refractive index variation. The determination of this frequency shift is exploited in Rayleighbased sensors relying on optical frequency-domain reflectometry (OFDR) [20] and in φOTDR incorporating laser frequency sweeping strategies [13], but it has been usually neglected when developing DAS schemes. In chirped-pulse φOTDR, the probe pulse is linearly chirped, instead of transform-limited as in the traditional case [17]. If the chirp spectral content p is much broader than the original pulse bandwidth, a frequency-to-time mapping befalls in the temporal power trace accounting for the accomplishment of the temporal far-field condition [21]. In this situation, the signal frequency shift induced by a local refractive index perturbation in the fiber is translated into a local temporal shift, t , in the corresponding position of the trace. This temporal shift is directly proportional to the undergone refractive index variation, following the relationship [17] 1 p n n 0 0 p. t , . (3). where n is the effective refractive index of the unperturbed fiber, is the frequency shift associated to n , p is the. 0733-8724 (c) 2018 IEEE. Personal use is permitted, but republication/redistribution requires IEEE permission. See http://www.ieee.org/publications_standards/publications/rights/index.html for more information..
(4) This article has been accepted for publication in a future issue of this journal, but has not been fully edited. Content may change prior to final publication. Citation information: DOI 10.1109/JLT.2018.2877849, Journal of Lightwave Technology. > REPLACE THIS LINE WITH YOUR PAPER IDENTIFICATION NUMBER (DOUBLE-CLICK HERE TO EDIT) < probe pulse width, and 0 is the central frequency of the probe pulse. Hence, the fiber interrogation process reduces to a problem of time-delay estimation (TDE). In this scenario, the TDE problem can be modeled as follows. The acoustic signal is generated by obtaining the maximum of moving correlations along the fiber length L fiber between. a. reference. signal. p0 t s0 t n0 t . and. pk t sk t nk t , in which the correlation window is set by. the system spatial resolution, i.e., l p 2 t l p 2 . l varies between 0 and L fiber n 2c0 , with c0 the speed of light in vacuum. In the presence of a perturbation at a position corresponding to t l , sk t s0 t t . Here, we have considered that the reference signal is the first trace ( k 0 ), but it can be updated if needed, as the optical trace profile usually changes along time due to thermal or mechanical environmental variations. The value of t for each trace k and each position l is obtained as tk ,l arg max p0 (t ) pk (t ) arg max Rs t t s0 t nk t . (4). sk t n0 t n0 t nk t .. In (4), the symbol refers to correlation, arg max stands for the arguments of the maxima, and Rs is the autocorrelation of the signal s0 t in the corresponding correlation window centered at t l . Assuming a well-conditioned optical trace in terms of SNR, n0 t , nk t s0 t , sk t , and the last term can be neglected. Besides, the noise and signal components are decorrelated, and hence, the second and third terms of (4) can be considered as noise with equivalent power. In order to obtain the proper value of tk ,l , the first term must be higher than the second plus third terms. In general, the autocorrelation of a signal with exponential distribution has a peak whose width is inversely proportional to the signal bandwidth and whose energy is proportional to the correlation window. Hence, the condition to measure tk ,l can be accomplished whenever the signal bandwidth is much higher than the correlation window. This condition ( p 1 p ) is systematically satisfied in chirped pulse φOTDR for its proper operation [17]. Eventually, as long as we can guarantee a healthy level of optical SNR, we will be able to measure the signal almost independently of the trace fading points. It is important to highlight that in this scheme the trace points with very low power do not impair the perturbation measurement, as the target in this case is to measure the temporal shift of those points within the correlation window. This is the key difference of this method with respect to the traditional DAS scheme relying on coherent detection of the backscattered trace.. 3. III. IMPROVING THE ACCURACY OF TDE Several techniques can be applied to the TDE process involved in the interrogation of chirped-pulse DAS to improve the accuracy in the calculation of the time delay. First, it is important to determine the range of perturbation magnitudes that can be truthfully detected by chirped-pulse DAS. The maximum detectable variation can be estimated considering that, in the presence of a perturbation, part of the shifted portion of trace falls outside the correlation window. This leads to a decrease in the correlation peak, which depends upon the temporal features of the trace ( ~ 1 p ) and the pulse width. Those parameters ( p and p ) impose then the shotto-shot maximum detectable variation [22]. It has been empirically demonstrated that values of lower than ~10% of p can be readily measured under well-conditioned optical trace in terms of SNR [23]. On the other hand, the shot-to-shot minimum detectable variation is given by the sampling rate of data acquisition. In a discrete TDE problem, the obtained value of t has a sampling error of half the sampling period. This error can be decreased by virtually increasing the acquisition sampling rate. There are different, well-known signal processing techniques that have been typically employed in this situation, e.g., application of a centroid, curve fitting or interpolation. Once the sampling error has been minimized, the minimum measurable perturbation will be limited by the system acoustic noise. Additionally, it has been recently demonstrated that in chirped-pulse φOTDR, the optical phase noise directly translates into an error in the value of t associated to a particular perturbation. This error can be readily quantified and compensated by measuring the delay suffered by the different traces in an unperturbed region of the fiber and subtracting the obtained delay error in the rest of the fiber positions [18]. By applying this simple procedure, the phase noise induced by the probe laser or by the instrument-induced jitter can be almost completely mitigated (at least to first order) without altering the sensor performance, in such a way that the trace noise is practically reduced to additive noise. The noise distribution of a TDE problem under additive noise in the signal has been already widely studied, as it is an important topic in areas such as radar or sonar [24]. In the conditions of our experiment (high SNR, large enough correlation window), once the non-additive sources of signal noise have been minimised, the noise in the delay determination has a Gaussian distribution whose variance is ultimately restrained by the Cramér-Rao lower bound (CRLB) [25,26]. The expression for the CRLB in the particular case of chirped-pulse DAS, i.e., considering an active system and a signal with triangle-like spectral envelope and full-width B , has been determined in [27], and is 2 CRLB . 3 , 4 p B3 SNR 2. (5). where SNR is the signal-to-noise ratio of the detected. 0733-8724 (c) 2018 IEEE. Personal use is permitted, but republication/redistribution requires IEEE permission. See http://www.ieee.org/publications_standards/publications/rights/index.html for more information..
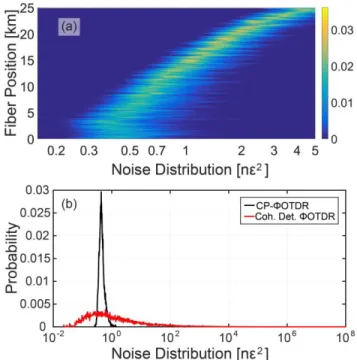
(5) This article has been accepted for publication in a future issue of this journal, but has not been fully edited. Content may change prior to final publication. Citation information: DOI 10.1109/JLT.2018.2877849, Journal of Lightwave Technology. > REPLACE THIS LINE WITH YOUR PAPER IDENTIFICATION NUMBER (DOUBLE-CLICK HERE TO EDIT) < trace. Hence, the variance of the delay measurement noise is inversely proportional to the pulse width, pulse bandwidth and the SNR of the trace. Due to the backscattered trace interrogation method being completely different from the used in traditional coherentdetection DAS systems, a difference in the sensitivity and SNR trends can be also expected. In what follows, we analyse the noise behaviour in chirped-pulse DAS in order to determine its statistical behaviour. In our analysis, the aforementioned techniques to improve the accuracy of the TDE have been applied. In particular, we compute the centroid over the correlation peak [28] to obtain a measurement of t with sub-sample accuracy, thus reducing the sampling error. The use of a centroid has been chosen due to its simplicity and low computational requirements as compared with other common methods. In addition, we have also compensated the optical phase noise following the method described above [18]. IV. EXPERIMENTAL ANALYSIS In this Section, we present a series of experimental results to show the statistics of sensitivity and SNR in chirped-pulse φOTDR. Under a known, well-defined perturbation, the SNR statistics of a DAS depends upon the noise distribution. Hence, we first study the statistical properties of the acoustic noise in our system. For this purpose, we extract the acoustic signal from an optical fiber with no perturbation, which provides the noise of our system.. 4. amplified using a set of EDFA and BPF, and finally detected using a 1 GHz-bandwidth photodetector followed by a 4 GSps acquisition card. In this first study, the FUT is a 25 km-long single-mode fiber (SMF). Unlike conventional DAS, where a perturbation produces a phase change for all points after the perturbation (and therefore a clear statistical analysis of the response of all the points after the perturbation can be easily obtained from a single measurement), in chirped-pulse DAS a perturbation only produces a localized trace variation. Thus, in order to analyze a statistically relevant number of effective sensors, we perform a measurement of the same fiber location over a long period of time. In uncontrolled ambient conditions, due to environmental changes, the trace profile continuously varies not only suffering shift but also a small decorrelation over time. This implies that, after a certain time, the reference trace at the measurement location is no longer valid and has to be updated. At that moment, it can be considered that we have a different effective sensor at the perturbation location, as the correlation between the measured trace window and the reference trace is low enough to consider them as uncorrelated. In our laboratory, we have verified that this situation occurs within a few minutes of measurement, in which variations of a few 10’s of mK are usual in normal laboratory conditions. Hence, we have measured the trace noise along a period of 10 hours. This implies that a sufficiently large number of independent realizations of the measurement are considered, and therefore the statistics obtained reasonably represent the true characteristics of the process.. Fig. 1. Setup of the chirped-pulse φOTDR sensing scheme. Acronyms are explained in the body of the manuscript.. Figure 1 shows the experimental setup employed to carry out this analysis. The scheme is similar to a classical φOTDR setup, in which the current driver of the laser source is linearly modulated along the pulse width in order to induce linear chirp. First, an external cavity laser (ECL) emits the probe light, whose central frequency is adjusted using an external current and temperature (I&T) controller, while the secondary current control of the laser is modulated using a sawtooth electrical signal to induce the chirp. The resulting light is pulsed using a semiconductor optical amplifier (SOA) fed with rectangular-like pulses. Next, the pulses are amplified using an erbium-doped fiber amplifier (EDFA) followed by a band pass filter (BPF) aimed at filtering out the amplified spontaneous emission (ASE). In this case, a dense wavelength division multiplexer (DWDM) was used as BPF. The resulting pulses are sent to the FUT. The backscattered traces are. Fig. 2. (a) Evolution of the distribution of noise levels along the 25 km-long FUT. The trace phase noise has been compensated by following the approach presented in [18] along the first 5 km of fiber. (b) Comparison between noise distribution of chirped-pulse φOTDR (black line) and coherent detection φOTDR (red line) under similar peak power, pulse duration (i.e. resolution) and noise power spectral density conditions.. 0733-8724 (c) 2018 IEEE. Personal use is permitted, but republication/redistribution requires IEEE permission. See http://www.ieee.org/publications_standards/publications/rights/index.html for more information..
(6) This article has been accepted for publication in a future issue of this journal, but has not been fully edited. Content may change prior to final publication. Citation information: DOI 10.1109/JLT.2018.2877849, Journal of Lightwave Technology. > REPLACE THIS LINE WITH YOUR PAPER IDENTIFICATION NUMBER (DOUBLE-CLICK HERE TO EDIT) < Figure 2(a) shows the statistical distribution of the measured acoustic strain noise along the 25 km of FUT. The employed probe pulse has a peak power of 200 mW, width of 100 ns and chirp spectral content of 1 GHz. From the figure, we observe that the acoustic noise variance increases exponentially along the fiber length (linear variation in logarithmic scale). This effect can be predicted from the CRLB, as it establishes an inverse relationship between acoustic noise level and trace SNR (see (5)) [25-27]. Recall that the latter decreases exponentially due to fiber attenuation. The noise increase is about 10 dB, corresponding to the backscattered signal attenuation along the 25 km of fiber (assuming typical SMF attenuation of 0.2 dB/km). The trace phase noise compensation [18] is carried out using the first 5 km of fiber as a reference segment. This explains the small decrease in the level of noise along this region of the fiber. As we can see in the figure, the noise variance distribution is approximately Gaussian along the whole fiber. As mentioned previously, a study on the sensitivity of coherent-detection-based DAS has been recently presented [8]. In that work, the statistic nature of the sensor sensitivity has been analysed by showing the distribution of SNR measured at different points (different effective sensors) of a 1 km-long perturbed region of a fiber. Note that in coherentdetection φOTDR, a local perturbation applied at a particular location of the FUT uniformly alters the phase from this point to the end of the fiber, as opposed to chirped-pulse φOTDR. In order to compare our results with the ones obtained from a sensor based on coherent-detection φOTDR, we determine the analytical noise distribution presented in [8], by using the expression for the noise distribution provided in their study and their experimentally obtained values. Note that both experiments have been performed with probe pulses of similar energy (same peak power and width) and under typical experimental conditions (except for the detection bandwidth, which is higher in the chirped-pulse case due to the high spectral content induced by the chirp). The expression for noise distribution developed in [8] is. nk ,CD l l , l l' . n2 . 1 1 2 , 2 ' 2 A l l A l l . 5. average SNR is 28 dB. The difference in the trace SNR in both experiments is mainly attributed to the fact that the detection bandwidth is much broader in the chirped-pulse φOTDR–case (about one order of magnitude). Taking into account this difference in the detection bandwidth, and the fact that the probe pulses in both cases have similar energy (i.e., produce similar backscattered power), the noise power spectral densities in this experiment and in the one using coherent detection should be analogous, attesting a fair comparison. The distribution of noise is plotted in Fig. 2(b) in black line. We observe that the noise distribution in the coherent detection case shows a high variability, while this distribution is much narrower in the chirped-pulse-based sensor. In particular, the full-width at 10% of our noise distribution is 0.39 nε2, while in the coherent-detection scheme is 79.38 nε2. Besides, for the perturbation applied in [8], around 6% of the measurements have an SNR lower than 1 even if the whole trace has a healthy level of optical SNR. This is due to the exponential distribution of the backscattered light intensities, and leads to randomly distributed unreliable sensing locations associated to the points of fading intensity. This is a critical shortcoming of coherent-detection-based φOTDR sensors.. (5). where n is the typical deviation of their detected trace, which has been obtained from a sensing fiber of 2 km. A2 t is the acquired power trace (recall that it has an exponential distribution), evaluated at two arbitrary points before and after the perturbation location t l . Using (6) and the data provided in [8], we obtain the curve plotted in red in Fig. 2(b). The SNR of the static backscatter profile can be estimated from this noise distribution and the applied perturbation (a sinusoidal perturbation inducing phase variations of 0.3 rad), resulting in an SNR of 37 dB. The obtained distribution from [8] is compared with the distribution of noise in our system after 2 km of SMF (for the sake of the comparison). The detected trace at 2 km has an. Fig. 3. Noise distribution vs dynamic range of the sensor: (a) chirped-pulse φOTDR; (b) coherent-detection φOTDR. Vertical dashed lines at the right point out the maximum shot-to-shot measurable perturbation. Green and pink shadowed rectangles mark the limits of dynamic range assuming 1% of noisy measurements (SNR ≤ 1); yellow and purple rectangles mark the limits of dynamic range for 50% of noisy measurements.. These results are also of critical importance to determine the dynamic range of each φOTDR configuration. Indeed, the distribution of noise levels will affect the SNR of the acoustic measurements, which has to be high enough in order to secure the trustworthiness of the obtained sensing measurements in all measurement locations. In Fig. 3, we show the distribution of noise levels already presented in Fig. 2(b), now comparing. 0733-8724 (c) 2018 IEEE. Personal use is permitted, but republication/redistribution requires IEEE permission. See http://www.ieee.org/publications_standards/publications/rights/index.html for more information..
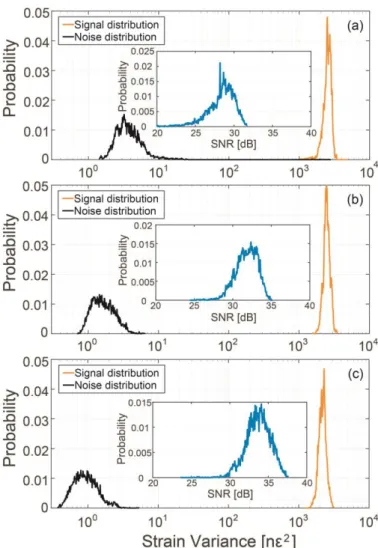
(7) This article has been accepted for publication in a future issue of this journal, but has not been fully edited. Content may change prior to final publication. Citation information: DOI 10.1109/JLT.2018.2877849, Journal of Lightwave Technology. > REPLACE THIS LINE WITH YOUR PAPER IDENTIFICATION NUMBER (DOUBLE-CLICK HERE TO EDIT) < them with the maximum measurable signal for each sensor, in order to obtain the achievable dynamic range i.e, the ratio between the maximum and minimum measurable values. In particular, in Fig. 3(a) we plot the case of chirped-pulse φOTDR. As discussed in Section III, the maximum strain that can be measured is imposed by the chirp-induced spectral content and the pulse width. In the figure, we have established that the maximum strain variation corresponds to a conservative time shift of 5% of the probe pulse width [23]. Once the centroid is applied to the correlation peaks reducing the sampling error, the minimum strain variation that can be measured is given by the acoustic noise. Assuming a sensor in which 50% of the measurements can have an acoustic SNR ≤ 1, the dynamic range would be 497 (yellow-shaded region in the plot). If we only allow 1% of the measurements with acoustic SNR ≤ 1, the dynamic range would be 347 (greenshaded region). These results notably contrast with those from a coherent-detection-based DAS (Fig. 3(b)). In this case, the shot-to-shot maximum detectable strain corresponds to a phase variation of π rad, in order to discriminate phase jumps owed to a perturbation or to phase unwrapping. Therefore, results from coherent-detection DAS present a dynamic range of 80.3 when allowing 50% of the measurements with an acoustic SNR ≤ 1 (purple-shaded region), and abruptly decreases to 1.4 when allowing only 1% of the measurements with acoustic SNR ≤ 1 (pink-shaded region). Hence, whenever we have a healthy level of optical SNR, chirped-pulse φOTDR can be considered as a completely trustworthy distributed sensor. Finally, as in [8], we perform the measurement of the statistical distribution of SNR as a function of the sensor resolution. In this case, we apply a controlled sinusoidal perturbation to the FUT and obtain both the distribution of signal and the distribution of noise. From those values, we obtain and plot the distribution of SNR. For this purpose, we change the FUT in Fig. 1 by a spool of 1 km of SMF followed by 20 m of SMF strapped around a piezo-electric transduced (PZT). We applied a sinusoidal perturbation of frequency 100 Hz and amplitude 4 Vpp, corresponding with a fiber strain of 127 nεpp. We repeat the measurement for probe pulses with widths of 50 ns, 75 ns and 100 ns, and a repetition rate of 5 kHz. The chirp applied to the pulses maintains an instantaneous frequency slope of 0.01 GHz/ns, which induces pulse spectral contents of p 500 MHz, 750 MHz and 1 GHz for each pulse width, respectively. The obtained results are plotted in Fig. 4. As it can be seen in the graphs, the perturbation detection SNR increases with the pulse energy, as the noise distribution has a lower mean value. This is attributed to the fact that the SNR of the optical trace is also higher for higher values of probe pulse energy, in agreement with the CRLB (see (5)). The signal detection has the same distribution in the three cases. The variance in the signal detection (full-width at 1/e height) is of 1.4 dB in all cases, and is probably attributed to coupling issues in the PZT transducer. Note that we provide the ratio between the maximum and minimum value in dB, for the sake of an easier comparison with the data provided in [8] and due to the high. 6. difference in the order of magnitude between the signal and noise distributions. The noise distribution has a full-width at 1/e of the maximum of ~4.4 dB in all cases. This leads to an acoustic SNR whose variance is ~4 dB. As expected from our study, the acoustic SNR of these measurements is almost independent of the trace fading points: in 1 km of fiber, the signal is always detected with high level of SNR (> 20 dB in the three cases presented), regardless of the position.. Fig. 4. Experimentally obtained distribution of signal (orange line) and noise (black line). The inset shows the distribution of SNR (blue line) of a set of effective sensors. The probe pulse has a width of (a) 50 ns; (b) 75 ns, and (c) 100 ns.. V. CONCLUSIONS In this work, we have performed a complete analysis of the performance of chirped-pulse φOTDR in terms of SNR and sensitivity. Additionally, we compare our results with those obtained from a complementary analysis on a coherentdetection-based scheme under similar conditions of resolution and acoustic bandwidth. Our results fully verify the remarkable benefits of translating the fiber interrogation process into a TDE problem thanks to the use of chirped probe pulses. In this case, the signal detection is almost independent of the trace fading points. We have proven that the noise distribution has much narrower variability than in the traditional scheme. Besides, under typical experimental. 0733-8724 (c) 2018 IEEE. Personal use is permitted, but republication/redistribution requires IEEE permission. See http://www.ieee.org/publications_standards/publications/rights/index.html for more information..
(8) This article has been accepted for publication in a future issue of this journal, but has not been fully edited. Content may change prior to final publication. Citation information: DOI 10.1109/JLT.2018.2877849, Journal of Lightwave Technology. > REPLACE THIS LINE WITH YOUR PAPER IDENTIFICATION NUMBER (DOUBLE-CLICK HERE TO EDIT) < conditions (i.e. optical traces with a healthy level of optical SNR), chirped-pulse-based DAS provides a broad dynamic range (>300) with trustworthy values of acoustic SNR in all positions of the fiber. In the coherent-detection-based sensor, however, even with a good optical SNR there will always be effective sensors with very low acoustic SNR (<1), therefore impairing the reliability of the sensing system. The results achieved in this work reveal the high reliability of chirpedpulse DAS as compared with traditional DAS, and may position these sensors as critical sensing technology in future smart infrastructures and systems. REFERENCES [1]. [2]. [3]. [4]. [5]. [6]. [7]. [8] [9]. [10]. [11]. [12]. [13]. [14]. [15]. B. Culshaw, and A. Kersey, “Fiber-optic sensing: A historical perspective,” J. Lightw. Technol., vol. 26, no. 9, pp. 1064-1078, May 2008. Y. J. Rao, Z. L. Ran, and R. R. Chen, “Long-distance fiber Bragg grating sensor system with a high optical signal-to-noise ratio based on a tunable fiber ring laser configuration,” Opt. Lett., vol. 23, no. 18, pp. 2684-2689, Sep. 2006. L. Schenato, L. Palmieri, M. Camporese, S. Bersan, S. Cola, A. Pasuto, A. Galtarossa, P. Salandin, and P. Simonini, “Distributed optical fibre sensing for early detection of shallow landslides triggering,” Sci. Rep., vol. 7, no. 1, pp. 14686, Oct. 2017. X. Lu, S. Zhang, X. Chen, D. Kwon, C. Jeon, Z. Zhang, J. Kim, and K. Shi, “Ultrasensitive, high-dynamic-range and broadband strain sensing by time-of-flight detection with femtosecond-laser frequency combs, ” Sci. Rep., vol. 7, no. 1, pp. 13305, Oct. 2017. A. Barrias, J. R. Casas, and S. Villalba, “A review of distributed optical fiber sensors for civil engineering applications,” Sensors, vol. 16, no. 5, pp. 748, May 2016. J. Tejedor, H. F. Martins, D. Piote, J. Macias-Guarasa, J. PastorGraells, S. Martin-Lopez, P. Corredera- Guillén, F. Smet, W. Postvoll, and M. Gonzalez-Herraez, “Towards prevention of pipeline integrity threats using smart fiber-optical surveillance system,” J. Ligthw. Technol., vol. 34, no. 19, pp. 4445-4453, Oct. 2016. S. Dou, N. Lindsey, A. M. Wagner, T. M. Daley, B. Freifeld, M. Robertson, J. Peterson, C. Ulrich, E. Martin, and J. B. AjoFranklin, “Distributed acoustic sensing for seismic monitoring of the near surface: a traffic-noise interferometry case study,” Sci. Rep., vol. 7, no. 1, pp. 11620, Sep. 2017. H. Gabai and A. Eyal, "On the sensitivity of distributed acoustic sensing," Opt. Lett., vol. 41, no. 24, pp. 5648-5651, Dec. 2016. J. C. Juarez, and H. F. Taylor, "Polarization discrimination in a phase-sensitive optical time-domain reflectometer intrusion-sensor system," Opt. Lett., vol. 30, no. 24, pp. 3284-3286, Dec. 2005. H. Iida, Y. Koshikiya, F. Ito and K. Tanaka, “High-sensitivity coherent optical time domain reflectometry employing frequencydivision multiplexing,” J. Lightw. Technol., vol. 30, no. 8, pp. 1121-1126, Apr. 2012. Z. Wang, H. Wu, X. Hu, N. Zhao, Q. Mo, and G. Li, “Rayleigh scattering in few-mode optical fiber,” Sci. Rep., vol. 6, no. 1, pp. 35844, Oct. 2016. J. Pastor-Graells, L. Romero-Cortés, M. R. Fernández-Ruiz, H. F. Martins, J. Azaña, S. Martin-Lopez, and M. Gonzalez-Herraez, "SNR enhancement in high-resolution phase-sensitive OTDR systems using chirped pulse amplification concepts," Opt. Lett. vol. 42, no. 9, pp. 1728-1731, May 2017. Y. Koyamada, M. Imahama, K. Kubota and K. Hogari, "Fiberoptic distributed strain and temperature sensing with very high measurand resolution over long range using coherent OTDR," J. Lightw. Technol., vol. 27, no. 9, pp. 1142-1146, May, 2009. Z. Wang, L. Zhang, S. Wang, N. Xue, F. Peng, M. Fan, W. Sun, X. Qian, J. Rao, and Y. Rao, "Coherent Φ-OTDR based on I/Q demodulation and homodyne detection," Opt. Express, vol. 24, no. 2, pp. 853-858, Jan. 2016. M. Ren, P. Lu, L. Chen, and X. Bao, “Theoretical and experimental analysis of ΦOTDR based on polarization diversity. [16]. [17]. [18]. [19]. [20]. [21]. [22]. [23]. [24]. [25]. [26]. [27]. [28]. 7. detection,” IEEE Photon. Technol. Lett., vol. 28, no. 6, pp. 697700, Mar. 2016. D. Chen, Q. Liu, and Z. He, “Phase-detection distributed fiberoptic vibration sensor without fading-noise based on time-gated digital OFDR,” Opt. Express, vol. 25, no. 7, pp. 8315-8325, Apr. 2017. J. Pastor-Graells, H. F. Martins, A. Garcia-Ruiz, S. Martin-Lopez, and M. Gonzalez-Herraez, "Single-shot distributed temperature and strain tracking using direct detection phase-sensitive OTDR with chirped pulses," Opt. Express, vol. 24, no. 12, pp. 1312113133, Jun. 2016. M. R. Fernández-Ruiz, J. Pastor-Graells, H. F. Martins, A.GarciaRuiz, S. Martin-Lopez, and M. Gonzalez-Herraez, "Laser phasenoise cancellation in chirped-pulse distributed acoustic sensors," J. Lightw. Technol., vol. 36, no. 4, pp. 979-985, Feb. 2018. L. B. Liokumovich, N. A. Ushakov, O. I. Kotov, M. A. Bisyarin and A. H. Hartog, "Fundamentals of optical fiber sensing schemes based on coherent optical time domain reflectometry: signal model under static fiber conditions," J. Lightw. Technol., vol. 33, no. 17, pp. 3660-3671, Sep. 2015. M. Froggatt, and J. Moore, "High-spatial-resolution distributed strain measurement in optical fiber with Rayleigh scatter," Appl. Opt., vol. 37, no. 10, pp. 1735-1740, Apr. 1998. W. Goodman, “Fresnel and Fraunhofer Diffraction”, in Introduction to Fourier Optics, 2nd ed., New York, McGraw-Hill, 1996, pp. 63-95. W. F. Walker, and G. E. Trahey, “A fundamental limit on delay estimation using partially correlated speckle signals,” IEEE Trans. Ultrason., Ferroelect., Freq. Control, vol. 42, no. 2, pp. 301-308, Mar. 1995. H. Bhatta, Luis Costa, A. Garcia-Ruiz, M. R. Fernández-Ruiz, H. Martins, M. Gonzalez-Herraez, and Moshe Tur, “Extending the measurement of true dynamic strain via chirped-pulse phasesensitive optical time domain reflectometry to 100’s of microstrains,” in Optical Fiber Sensors (OFS) Conference, Lausanne, Switzerland, 2018, paper number WF14. J. P. Ianniello, “Time delay estimation via cross-corration in the presence of large estimation errors,” IEEE Trans. Acoust., Speech, Signal Process., vol. 30, no. 6, pp. 998-1003, Dec. 1982. G. Jacovitti and G. Scarano, “Discrete time techniques for time delay estimation,” IEEE Trans. Signal Process, vol. 41, no. 2, pp. 525-533, Feb. 1993. A. H. Quazi, “An overview of time delay estimation in active and passive system for target localization,” IEEE Trans. Acoust. Speech, Signal Process., vol. 29, no. 3, pp. 527-533, Jun. 1981. L. Costa, H. Martins, S. Martin-Lopez, M. R. Fernández-Ruiz, and M. Gonzalez-Herraez, “Reaching pε/√Hz sensitivity in a distributed optical fiber strain sensor,” in Optical Fiber Sensors (OFS) Conference, Lausanne, Switzerland, 2018, paper number TuD3. J. Wang, P. Urriza, Y. Han and D. Cabric, "Weighted centroid localization algorithm: theoretical analysis and distributed Implementation," Trans. Wireless Commun., vol. 10, no. 10, pp. 3403-3413, Oct. 2011.. 0733-8724 (c) 2018 IEEE. Personal use is permitted, but republication/redistribution requires IEEE permission. See http://www.ieee.org/publications_standards/publications/rights/index.html for more information..
(9)
Figure

Documento similar
