9th Meeting of the Conference of the Parties to the
Convention on Wetlands (Ramsar, Iran, 1971)
“
Wetlands and water: supporting life, sustaining
livelihoods“
Kampala, Uganda, 8-15 November 2005
Resolution IX.1 Annex D
Ecological “outcome-oriented“ indicators for assessing the
implementation effectiveness of the Ramsar Convention
1.
Further to the request by 8
thmeeting of the Conference of the Parties (COP 8) in
Resolution VIII.26 and work by the Scientific and Technical Review Panel (STRP),
this Annex contains an initial set of eight indicators of effectiveness for assessing
selected aspects of the Convention’s implementation, developed for use where
appropriate during the 2006-2008 triennium.
2.
The eight initial indicators (Table 1) provide a basis for evaluating some of the ecological
outcomes resulting from implementation of the Ramsar Convention, hence giving some
much-needed response to the fundamental question of whether or not the Convention is
succeeding in achieving its mission.
3.
In doing this, they differ from the “process-oriented“ indicators such as those in the
COP9 National Report Format, the Convention’s Strategic Plan 2003-2008, and the
Strategic Framework for the Implementation of the Convention (Resolution IX.8).
However, all of these different indicators are designed to operate in a linked and
complementary way. Indeed, a number of the National Report Format “process-oriented”
indicators will be needed for, and used in, the analyses and assessment of each of the
indicators of effectiveness.
4.
This approach is part of an integrated updating of monitoring and reporting processes
under the Convention, including an intention to simplify the National Report Format for
COP10 (see Resolution IX.8). Taken in combination, these updated processes will be
designed in such a way that there should be no net additional burden of analysis and
reporting for Contracting Parties compared to the present. In concert with moves to
streamline and harmonise reporting across related Multilateral Environmental Agreements,
ideally the overall burden could in fact reduce. Some of the indicators in any event rely on
analyses at global level rather than implying that this be done by Parties.
5.
The eight initial indicators are considered to be those which are presently feasible to
implement with existing, or readily collectible, data and information, though this remains to
be tested. In several cases this information will consist of qualitative evaluations, which can
yield valuable insights.
6.
The results produced will be relevant also for other global assessment processes.
the World Summit on Sustainable Development (WSSD) and the Convention on
Biological Diversity (CBD) to significantly reduce the rate of loss of biodiversity by 2010,
and these indicators will contribute to measuring aspects of the degree of implementation
for this target. Reports based on relevant effectiveness indicators in this Annex, aimed at
informing the 2010 process, are envisaged for 2008 and 2011. In the spirit of synergy
among the biodiversity-related conventions, these indicators are also likely to help
Contracting Parties report against CBD targets for its Programmes of Work on inland
waters and marine and coastal biodiversity.
7.
It is important to recognise, however, that indicators of Ramsar effectiveness would need
to go a step further beyond the related ‘biodiversity status and trends’ indicators such as
those developed by the CBD for assessing achievement of the 2010 biodiversity target, and
that not all such status and trends indicators can necessarily be used directly to give clear
indications of the Convention’s effectiveness.
8.
The geographical scale of data sources for the eight effectiveness indicators differs. Some
of the indicators are designed to operate at supranational level and to be coordinated
internationally, but may nevertheless draw upon data from site, basin/catchment, and/or
national level. Others are designed for data collection at site, basin/catchment or national
scale.
9.
For each indicator, initial implementation has been designed to be through one or more
‘sub-indicators’ focusing on specific aspects of the indicator theme. For some indicators, a
number of additional sub-indicators have been identified for potential future development,
such that the overall suite of indicators can build progressively into an increasingly more
informative and useful picture of Convention effectiveness, while observing the
constraints referred to above concerning the burden of Contracting Party reporting.
10. Table 1 lists the indicator themes, indicators and initial sub-indicators, and their purpose,
and also provides an indication of the expected role and responsibilities of Contracting
Parties in the application of each indicator. A further five indicators are recommended for
further consideration and future development by the STRP (Table 2).
11. Fact sheets providing guidance for the application and operation of each of these
indicators and sub-indicators have been developed by the STRP. These fact sheets are
provided in the Annex to COP9 DOC. 18. The standard format for these fact sheets is
provided here in Appendix 1.
12. Further work will be needed to elaborate details concerning construction and operation of
the indicators, including sub-indicators, processes and mechanisms for data collection,
compilation, analysis, assessment, reporting, publishing and disseminating the results and
conclusions generated, and this has been identified as an immediate priority for the STRP
and Secretariat in the 2006-2008 triennium in the schedule of actions for scientific and
technical implementation of the Convention (Resolution IX.2). Pilot testing to confirm
feasibility and other aspects will also be undertaken.
14. In general, only a very restricted basis for the measurement and assessment of the
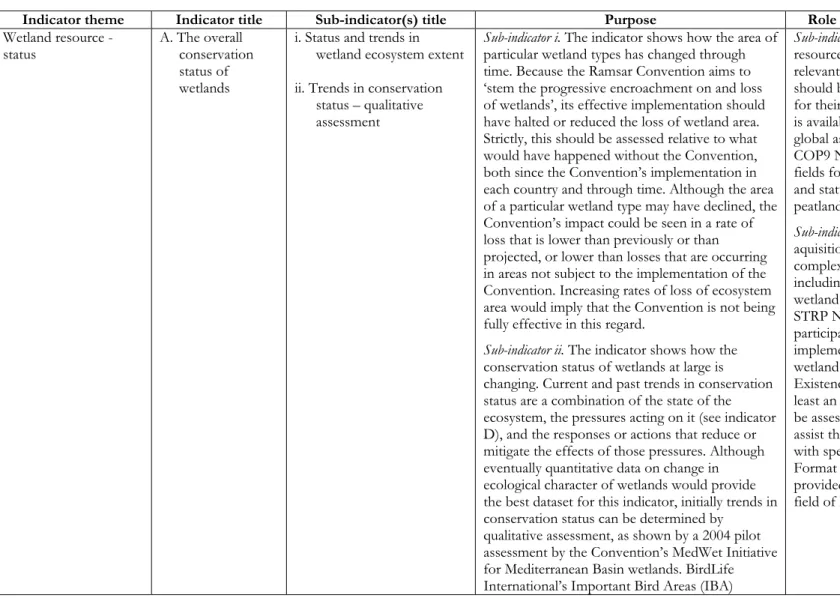
Table 1. The initial set of eight indicators of effectiveness of the implementation of the Ramsar Convention
Indicator theme Indicator title Sub-indicator(s) title Purpose Role of Contracting Parties (CPs)
Wetland resource -
status A. The overall conservation
status of wetlands
i. Status and trends in wetland ecosystem extent
ii. Trends in conservation status – qualitative assessment
Sub-indicator i.The indicator shows how the area of particular wetland types has changed through time. Because the Ramsar Convention aims to ‘stem the progressive encroachment on and loss of wetlands’, its effective implementation should have halted or reduced the loss of wetland area. Strictly, this should be assessed relative to what would have happened without the Convention, both since the Convention’s implementation in each country and through time. Although the area of a particular wetland type may have declined, the Convention’s impact could be seen in a rate of loss that is lower than previously or than projected, or lower than losses that are occurring in areas not subject to the implementation of the Convention. Increasing rates of loss of ecosystem area would imply that the Convention is not being fully effective in this regard.
Sub-indicator ii. The indicator shows how the conservation status of wetlands at large is changing. Current and past trends in conservation status are a combination of the state of the ecosystem, the pressures acting on it (see indicator D), and the responses or actions that reduce or mitigate the effects of those pressures. Although eventually quantitative data on change in ecological character of wetlands would provide the best dataset for this indicator, initially trends in conservation status can be determined by
qualitative assessment, as shown by a 2004 pilot assessment by the Convention’s MedWet Initiative for Mediterranean Basin wetlands. BirdLife International’s Important Bird Areas (IBA)
Sub-indicator i. National landcover and resource assessments provide potentially relevant data for this indicator, and CPs should both harness such relevant data for their own purposes and ensure that it is available to contribute to regional and global assessments. In addition, the COP9 National Report Format includes fields for national information on extent and status of coastal wetlands and peatlands.
monitoring programme will also provide a data source.
Ramsar sites – status B. The status of the ecological character of Ramsar sites
i. Trends in the status of Ramsar site ecological character – qualitative assessment
This indicator examines the extent to which the commitments under Article 3 of the Convention are being achieved, focusing on past and present trends in the ecological character status of designated Ramsar sites. As for indicator A ii. it will be implemented initially through qualitative assessment methods. Comparison with the results of indicator A ii. will also provide insights into how the status of Ramsar sites has changed relative to non-designated wetlands.
CPs will need to assist in linking with those responsible for maintenance, management and monitoring of Ramsar sites within their territory to supply information, in the first instance likely to be in the form of a short qualitative assessment questionnaire (which it is anticipated will also yield data and information for the application of indicators A and D).
In addition to the qualitative assessment approach, it is likely that quantitative assessment for some Ramsar sites will already be possible, drawing upon e.g. the European Space Agency’s TESEO and GlobWetland projects and upon data from Contracting Parties that have monitoring programmes operating and reporting for designated sites within their territories.
Water quality and
quantity - status C. Trends in water quality i. Trends in dissolved nitrate (or nitrogen) concentration
ii. Trends in Biological Oxygen Demand (BOD)
Sub-indicator i. The indicator shows how levels of nitrogen in inland waters are changing over time, and it reflects both pollution and trophic changes in the ecosystem. While absolute levels of dissolved nitrogen vary with water body type and (to a lesser degree) seasonal conditions, increasing average nitrogen concentration in a given water body shows increasing nitrogen inputs.
The principal contributor to dissolved nitrogen concentration is nitrate from fertiliser run-off and other sources of pollution. It is a standard component of water quality monitoring. At site
level, trends in dissolved nitrogen concentration are a component of site status and a reflection of how well a site’s immediate catchment and the wider basin are managed for the health of the ecosystem. The connection with Convention effectiveness is clear for Ramsar-designated sites – if designation has been effective in promoting their conservation and wise use, then a high proportion of Ramsar sites should have either stable or declining nitrogen concentrations.
Sub-indicator ii. The indicator shows how levels of organic pollution in inland waters are changing over time. Increasing average BOD in a given water body shows that there is an increase in organic matter inputs, which are most likely to come from effluent, run off or other sources of pollution. At the site level, trends in BOD are a component of site status and a reflection of how well a site’s immediate catchment and the wider basin are managed for the health of the ecosystem. For Ramsar sites, if designation has been effective in promoting their conservation and wise use, then trends in BOD should be either stable or declining over time.
mechanisms, as will be done for the related CBD 2010 indicator assessments.
Ramsar sites – threats D. The frequency of
threats affecting Ramsar sites
i. The frequency of threats affecting Ramsar sites – qualitative assessment
If the Convention is effective in its aim of promoting the conservation of Ramsar sites and maintaining their ecological character (Article 3.1, Resolution VIII.8), then not only will potential unwanted changes in the ecological character of sites be averted by protective policy and decision-making regimes and site management, but risks and proposals which would pose such threats should diminish in frequency over time, as awareness of the status of sites increases and as the conservation objectives for them are more widely shared. This indicator is designed to show
whether or not this trend occurs. In the first instance it may only be able to show the absolute trend, but the indicator should be developed further in due course in order to show whether threats are reducing relatively more than the trend for threats generally (e.g. in a country), and relatively more in relation to Ramsar sites than in relation to undesignated wetlands. As for indicators A ii. and B, it will be implemented initially through qualitative assessment methods.
information. Links to BirdLife International’s Important Bird Areas (IBA) monitoring (which takes a similar approach to that defined here) will assist where the IBA is also a Ramsar site. Likewise, WWF’s wetland management effectiveness tool, which is currently being developed and pilot tested, is anticipated to provide CPs with a contributory mechanism (see also indicator E).
Wetland management E. Wetland sites
with successfully implemented conservation or wise use management plans
i. Wetland sites with successfully implemented conservation or wise use management plans
The key feature of this indicator is the “successful implementation“ of management plans, i.e. that the defined management objectives for the site’s ecological character are being met and assessed through monitoring in line with Resolution VIII.14. It is the success of conservation and wise use that is being assessed, beyond the existence of management activity. The indicator can be applied both to designated Ramsar sites and to other wetlands with established management planning processes. Assessment of this indicator in relation to results for the same wetlands from indicators A to D will provide further insights into the effectiveness of management planning processes under the Convention in maintaining wetland ecological character.
CPs will need to assist in linking with those responsible for the maintenance, management and monitoring of both Ramsar sites and other wetlands within their territory to supply information. WWF’s wetland management effectiveness tool, which is currently being developed and pilot tested, is anticipated to provide CPs with a contributory mechanism (see also indicator D).
Species/biogeographic
populations status F. Overall population trends of wetland taxa
i. Trends in the status of waterbird biogeographic populations
Waterbirds are widely regarded as indicators of wetland health, and migratory populations can be seen as integrators of ecosystem status along flyways. Many populations aggregate during at least some times of the year (either in breeding colonies, at migratory staging areas, and/or non-breeding feeding grounds) – at these times they are likely to be responsive to site designation and protection and habitat management interventions.
This indicator will show, at the biogeographic population level, in which regions and seasons and on which flyways waterbirds are in relatively healthy and relatively unhealthy status, thus indicating the extent of effectiveness of the Convention in relation to commitments to maintain flyway-scale site networks. It can act as a ‘headline indicator’ of high public profile.
processes, in line with Resolution VIII.38. In addition, where a national waterbird monitoring scheme exists which generates national status and trend information, CPs have a role in ensuring that its results and analyses are made available to further inform the global, regional and flyway scale assessments.
Threatened Species G. Changes in
threat status of wetland taxa
i. trends in the status of globally-threatened wetland-dependent birds;
ii. trends in the status of globally-threatened wetland-dependent amphibians
The status and change in status at the species level (cf. the more detailed biogeographic population level of indicator F) of globally-threatened species on the IUCN Red List provides an assessment of the effectiveness of the Convention processes, notably Ramsar site designation under Criterion 2 to safeguard species at risk of extinction.
Compiled datasets and analyses by the Red List Consortium already exist in the form of Red List Indices of change in status over time for the initial sub-indicators for birds and amphibians and can be disaggregated for wetland-dependent species and for regions. It is anticipated that further sub-indicators for other globally-threatened taxa can be developed subsequently, as further Red List time-series assessments are made.
The main datasets used for this indicator are not collected and reported at national scale, but rather are analysed and prepared globally by the Red List Consortium, drawing on global and regional expert IUCN / BirdLife / Wetlands International Specialist Group networks.
Ramsar Site designation
progress H. The proportion of candidate
Ramsar sites designated so far for wetland types/features
i. coverage of the wetland resource by designated Ramsar sites
The Convention’s Strategic Framework for Ramsar site designation calls for a “coherent and comprehensive national and international network” of Ramsar sites. This indicator assesses the extent to which this goal has so far been delivered for different wetland types in the Ramsar classification (and other features), and the implications for Convention effectiveness of the extent of this delivery. The assumption underlying this indicator is that designating wetlands as Ramsar sites affords an increased degree of safeguard of the ecological character of these sites through, for example, raised awareness of the importance of the site leading to reduced development or conversion pressure, the
application of legislation to safeguard the wetland, and/or management planning processes designed to maintain the ecological character of the site. This assumption is tested by indicator B on the ecological character status of Ramsar sites in relation to indicator A on the overall conservation status of wetlands. The initial sub-indicator will focus on assessment of designation patterns in relation to the global distribution and importance of different wetland types in the Ramsar
Classification, for those wetland types for which global distribution datasets exist.
(Note that there are close links between the approach under this indicator, and that for indicator I, proposed for further development (see Table 2), concerning coverage by the Ramsar site network at the biogeographic range and flyway-scale of waterbird populations.)
As for indicator A, improvements in the availability of national wetland inventory information (in line with Resolution VIII.6) would make a significant contribution to the scope of
Table 2. Indicators recommended for further consideration and future development by the STRP
Indicator theme Indicator title Purpose
Ramsar site designation progress I. Coverage of wetland-dependent bird populations by designated
Ramsar sites The Convention’s Strategic Framework for Ramsar site designation calls for a “coherent and comprehensive national and international network“ of Ramsar sites, and its long-term targets for waterbird Criteria 5 and 6 are for all wetlands qualifying to be designated. This indicator would assess the extent to which this target has so far been delivered for waterbirds and the implications for Convention effectiveness of the extent of this delivery. Thus the indicator would complement indicator H for another key aspect of Convention implementation through Ramsar site designation, and would also be informed by the outputs from indicator F.
During its 2003-2005 work, the STRP concluded that further consideration of the potential data sources and analysis
mechanisms was needed, and that planned future development of the Ramsar Sites Datatbase in relation to incorporation of species information would facilitate future implementation of the indicator.
Wetland ecosystem benefits/services J. The economic costs of unwanted floods and droughts The first tranche of effectiveness indicators does not include any
indicators assessing the Convention’s effectiveness in relation to the provision of wetland ecosystem benefits/services other than biodiversity benefits/services, which this proposed indicator would be designed to address. The STRP anticipates that this indicator would focus on aspects of regulating benefits/services, in relation to the Convention’s increasing attention to the impacts of natural disasters (Resolution VIII.35 and Resolution IX.9). The working hypothesis for this indicator would be that proper application of the Convention’s “wise use” policies reduces the incidence and impact of such events and the resultant economic losses which occur.
and that there is a need to explore further whether there are existing data sources compiled by other organizations which could inform its assessment.
Water quality and quantity - status K. Trends in water quantity This indicator, and the several possible sub-indicators on this
theme, would be designed to complement indicator C on trends in water quality. However, although there are a number of possible status and trends indicators relating to different aspects of water quantity and its implications for the ecological character of wetlands, during its 2003-2005 deliberations the STRP concluded that further review was needed to determine if, and how, any of these could be clearly related to the effectiveness of Convention implementation.
Legislative & policy responses L. Legislative amendments implemented to reflect Ramsar
provisions The proposed indicator is included to ensure that legislative aspects of Convention effectiveness are included in the overall suite of indicators. Although it is basically a “means objective” indicator rather than an “ends objective” indicator, it is a powerful one which should relate to meaningful and enduring change, particularly when assessed in conjunction with other indicators. Examples such as the removal of perverse incentives would be significant in relation to defined Convention goals. It is also one of the clearest types of issue to include in a “response indicators“ category. One of its strengths is that it should be easier with this indicator than with many others to attribute change directly to the Ramsar Convention. If the indicator, once further developed, includes aspects of the application of enforcement/compliance controls, that would increase the extent to which such a legislation indicator reflects a genuine gain in effectiveness rather than only a “paper gain“.
Legislative & policy responses M. Wise use policy An indicator covering this theme would examine the extent to