Neuropsychology Review, Vol. 8, No. 4, 1998
Toward a Model of Neuropsychological Activity
Alfredo Ardila,
1,2Luz Marina Galeano,
1and Monica Rosselli
3The main purpose of this research was to establish the intercorrelations existing among dif-ferent psychological and neuropsychological test scores in a normal and homogenous popu-lation. A second purpose was to attempt further step in the component analysis of cognitive activity measured by means of neuropsychological tests. A comprehensive neuropsychological test battery was assembled and individually administered to a 300-subject sample, aged 17-25 years-old. All of them were right-handed male university students. The battery included some basic neuropsychological tests directed to assess language, calculation abilities, spatial cog-nition, praxic abilities, memory, perceptual abilities, and executive functions. In addition, the Wechsler Adult Intelligence Scale was administered. Forty-one different scores were calcu-lated. Correlations among the different test scores were analyzed. It was found that some of the tests presented a quite complex intecorrelation system, whereas other tests presented few or no significant correlations. Mathematical ability tests and orthography knowledge rep-resented the best predictors of Full Scale IQ. A factor analysis with varimax rotation dis-closed five factors (verbal, visuoperceptual, executive function, fine movements, and memory) accounting for 63.6% of the total variance. Implications of these results for a neuropsy-chological model about brain organization of cognition were analyzed.
INTRODUCTION
Different factorial studies of general intelligence have been presented in psychological literature (e.g., Cattell, 1971; Guilford, 1967; Leckliter et al., 1986; Matarazzo, 1972). Guilford (Guilford 1967, 1968; Guilford and Hoepfner, 1971) proposed a three-di-mensional classification of intelligence, including contents (letters, numbers, words, and behavioral de-scriptions), operations (memory, evaluation, conver-gent thinking, and diverconver-gent thinking), and products (units, classes, relations, systems, transformations, and implications). In consequence, according to Guildford 120 different intellectual abilities could be distinguished. Cattell (1971) distinguished between "Fluid Intelligence" (corresponding to and reflecting
Universidad de San Buenaventura, Medellin, Colombia.
2To whom correspondence should be addressed at Miami Institute
of Psychology, 8180 NW 36 Street, Miami, Florida 33166.
3Florida Atlantic University, Davie, Florida.
a pattern of neurophysiological and incidental learn-ing influences), and "Crystallized Intelligence" (highly sensitive to each person's unique cultural educational and environmental experiences).
Most often, a three-factor structure has been found in the WAIS (Leckliter et al., 1986; Matarazzo, 1972). Factor I ("Verbal Comprehension") is meas-ured by Information, Vocabulary, Similarities, and Comprehension substests. Factor II ("Perceptual Or-ganization") is measured with Object Assembly, Block Design, Picture Completion, and Picture Ar-rangement subtests. Factor III ("Freedom of Distrac-tibility") is specially measured with the Digit-Symbol subtest. A fourth, weaker factor, is measured with Arithmetic subtest (Cohen, 1957).
In the neuropsychological domain, factorial analysis has been applied to some specific tests and scales directed to measure single cognitive abilities. The Wechsler Memory Scale (WMS) represents a good example. To date, several factor-analytic studies
171
1040-7308/98/1200-0171$15.00/0 © 1998 Plenum Publishing Corporation
KEY WORDS: Neuropsychological tests; brain organization of cognition; cognitive activity; factor
with the WMS have been published, usually report-ing a two-factor structure—General Memory and At-tention (Bernstein and Chelune, 1988; Roid et al., 1988; Wechsler, 1987; Ardila and Rosselli, 1994). El-wood (1991) analyzed the factor structure of the WMS—Revised (WMS-R) in a clinical sample and observed that only one general memory component accounted for 54% of the variance; a second factor that contributed 9.4% of the total variance was found only after IQ scores were included. Ardila and Rosselli (1994) used the original WMS version, but included delayed recall for the Logical Memory, Vis-ual Reproduction, and Associative Learning subtests, and found one general memory component ac-counted for 51% of the variance. The same second factor reported by Wechsler (1987) as an 'Attentional Factor" was also found. Finally, Ardila and Rosselli observed a third weaker factor, related with verbal memory, specially measured by means of the Asso-ciative Learning subtests ("Verbal Memory" factor). These results with the WMS were very similar to the results obtained by Elwood (1991) using the WMS-R. Consequently, there is not much difference between the WMS and the WMS-R factor structure.
Some factorial analysis of extensive neuropsy-chological battery tests have been presented in lit-erature. Ostrosky, et al. (1985, 1986), using a neuropsychological battery test derived from Luria, found three main factors. Factor I included complex linguistic abilities, reading, and calculation ("Verbal Factor"). Factor II included a large number of motor tasks, related in particular to motor programming ("Motor Programming Factor"). Factor III basically involved two movement coordination tasks as well as certain aspects of memory and complex aspects of language comprehension. However, to perform the factorial analysis, the authors selected only those tests sensitive to sociocultural effects, and not the whole test battery. Recently some new attempts to apply factor analysis to different neuropsychological tests have been presented (e.g., Haut et al., 1992; Wilhem and Franzen, 1992).
Pontdn, Satz and Herrera (1994) administered a neuropsychological test battery including 10 different tests to 300 normal subjects. A factor analysis was used and five different factors were found: A Verbal Factor (measured basically through verbal fluency and naming), a Learning Factor (measured specially with an Auditory Verbal Learning test), a factor re-lated to the Speed in Processing Information (atten-tion; measured with Digit-Symbol subtest), a Visual
Processing Factor (measured with the Rey-Osterrieth Complex Figure), and finally, a Factor of Psychomo-tor Speed (measured with the Pin Test).
Ardila et al. (1994c) administered a general neuropsychological test battery to a 98-subject sam-ple, aged 5-12-years-old. Their battery included lan-guage, memory, spatial abilities, concept formation, and praxic abilities tests. A factor analysis with vari-max rotation found nine different factors accounting for about 70% of the variance. Factor I was meas-ured by a Sequential Verbal Memory Test and Verbal Fluency subtests ("Verbal Factor"). Factor II was measured by the WMS Visual Memory subtests (im-mediate and delayed reproduction), and the Rey-Os-terrieth Complex Figure (copy and immediate reproduction; "Nonverbal Memory and Construc-tional Factor"). Factor III was measured by the WMS Logical Memory subtests (immediate and delayed; "Verbal Memory Factor"). Factor IV was associated with fine movements (tapping subtests, right and left hand; "Fine Movements Factor"). Factor V was mainly measured by the Information subtest of the WMS and the Boston Naming lest ("Verbal Knowl-edge"). Factor VI represented a "Praxic Ability Fac-tor" (ideomotor praxis tests). Factor VII was measured by the Delayed Associative Learning sub-test, and Factor VIII was measured by Digits. Factor IX was a "Mental Control Factor" (Mental Control subtest of the Wechsler Memory Scale).
Carroll (1993) analyzed 461 factor-analytic stud-ies of cognitive abilitstud-ies presented in the literature to date. He observed that some factors tend to ap-pear with a significant frequency across different fac-torial studies. This is observed in different cognitive areas: reasoning, language, memory, visual percep-tion abilities, etc. These rather constant factors might be related with some basic cognitive abilities. From a neuropsychological perspective some neuropsy-chological syndromes are expected to be observed in cases of disruption of these basic cognitive factors.
Neuropsychological Activity
173
A general neuropsychological test battery was assembled and individually administered to a 300-subject sample. In order to minimize the effects of subject variables, the sample was homogeneous. The battery included some basic tests used in the diag-nosis of language abilities, memory, perceptual abili-ties, concept formation, and praxic abiliabili-ties, and some other tests developed specifically for this re-search.
METHOD
Subjects
A population sample of 300 normal homogene-ous subjects was selected. All the subjects were 17-25-years-old (mean = 21.04; SD = 2.41) right-handed male university students. The subjects included in the sample corresponded to middle so-cioeconomic status. The subjects were nonpaid vol-unteers. All subjects were Colombians, living in Medellin, Colombia (population around 2,000,000 in-habitants) and were native Spanish speakers.
Testing
All subjects were initially interviewed to deter-mine eligibility. A neurological and psychiatric screening questionnaire was used to rule out previous neurological and psychiatric conditions such as brain injury, cerebrovascular disease, epilepsy, and psychi-atric hospitalizations. A handedness questionnaire was also administered.
An attempt was made to collect comprehensive information covering seven different neuropsy-chological activity areas: language, memory, calcula-tion skills, spatial abilities, perceptual skills, praxic abilities, and executive functions. Most of the tests that were selected are well-known tests with estab-lished reliability and validity. In some cases, however, it was necessary to develop new tests adapted to the goals of this research. The following tests were indi-vidually administered to each subject:
1. Auditory Recognition
1.1. Recognition of Songs. Three songs very well known within the general popula-tion were selected. The initial 3-, 6-, and 9-second fragments were recorded.
The initial 3-second segment was in-itially presented. If the subject failed to recognize the song, the 6-second seg-ment was presented. If the subject again failed, the 9-second segment was presented. For each song there was a maximum score of 7 points: 2 points for the recognition of the song, 2 points for providing the name, 3-points if it was recognized from the presentation of the 3 second segment, 2 points if it was rec-ognized from the presentation of the 6-second segment, and 1 point for recognition from the presentation of the 9-second segment. Non recognition of the song resulted in zero points. Maximum possible score was 21. 1.2. Seashore Rhythm Test from the
Hal-stead-Reitan Neuropsychological Bat-tery (Reitan and Wolfson, 1985). Standard procedure and scoring pre-sented in the manual were used.
2. Verbal Fluency (1 minute). The objective is to provide as many words as possible using classifications of animals (or fruits or jobs), and words beginning with the letter F (or A or S) in 1 minute. Total number of elements for the semantic and the phonologic condi-tions were scored.
2.1. Phonologic Verbal Fluency (using words starting with F, A, and S). 2.2. Smantic Verbal Fluency (listing
ani-mals, fruits, and jobs)
3. Non-verbal Fluency (Jones-Gotman and Milner, 1977). Standard procedure and scor-ing proposed by Jones-Gotman and Milner were used.
4. Serial Verbal Learning (SVL) (Ardila, Rosselli and Puente, 1994). To recall 10 com-mon words sequentially presented. The 10-word list was read by the examiner, and the subject repeated as many as possible. The list was read as many times as required to recall the 10 words regardless of the order. Two different scores were used:
4.1. First trial: Number of words recalled after the first presentation.
5. Finger Tapping Test (FIT) from the Hal-stead-Reitan Neuropsychological Battery (Reitan and Wolfson, 1985). Standard pro-cedure and scoring presented in the Manual were used.
5.1. Right hand. 5.2. Left hand.
6. The Rey-Osterrieth Complex Figure (ROCF) (Osterrieth, 1944). Two conditions were used in each of which 18 designs were scored for a maximum possible score of 36 (Lezak, 1995; Taylor, 1958):
6.1. Copy. Subjects were required to copy the figure placed in front of them on a plain piece of paper. There was no time limit.
6.2. Immediate memory. When the subject finished copying the figure, both the design and the subject's copy were re-moved and the subject was asked to draw the figure from memory.
7. Ratcliff's mental rotation test (Ratcliff, 1979). Manikin figures used by Ratcliff were adapted and drawn on cards. There were 32 stimuli, eight in each of the orientations. A black disk marked the right hand in half of the stimuli and the left hand in the other half. A random order presentation was used. The subject was required in each trial to tell which of the manikin's hands was marked with the black disk. Maximum possible score was 32.
8. Arithmetical abilities. Two different tests were used:
8.1. Mental arithmetical operations orally presented (two additions, two subtrac-tions, two multiplicasubtrac-tions, two divi-sions). Maximum possible score was 8 points (one point for each correct an-swer).
8.2. Arithmetical problems. Sixteen arith-metical problems were orally presented. The subjects were allowed to use pencil and paper. Maximum possible score was 16 points (one point for each cor-rect answer).
9. Localization of 10 cities on a 15 cm x 20 cm map of Colombia. Each correct answer was scored 5. One centimeter deviation from the right location was scored 4; two centimeter deviation was scored 3; three centimeter viation was scored 2; and four centimeter de-viation was scored 1. More than four centimeter deviation was scored 0. The maxi-mum possible score was in consequence 50 points.
10. Orthography test. Thirty words written on a paper were presented to the subject. Half of the words contained an orthographic error. The subject was required to correct wrongly written words, and to write "OK" in front of those words that were correctly written. For each correct answer, a point was given. Maximum score = 30.
11. Perceptual speed. Three different tests were used:
11.1. Similarities between two figures. Two somewhat similar pictures were simul-taneously presented. The subject was required to point out those elements in-cluded in both figures. Time was meas-ured. Maximum possible score was 10. 11.2. Differences between two figures. Two very similar pictures were simultane-ously presented. The set of figures was different from the set of figures used in the former task. The subject was in-structed to point out the differences ex-isting between the two. Time was measured. Maximum possible score was 20.
11.3. Hidden figures. The subject sought 10 elements hidden in a complex picture. In the lower part of the figure, the 10 hidden elements were drawn. Maxi-mum score was 10.
consid-Neuropsychological Activity 175
ering the huge Garcia Marquez' literature production.
13. Wechsler Adult Intelligence Scale (WAIS), Spanish version (Wechsler, 1993). Eleven subtests were administered:
13.1. Information 13.2. Similarities 13.3. Arithmetic 13.4. Vocabulary 13.5. Comprehension 13.6. Digits
13.7. Picture completion 13.8. Picture arrangement 13.9. Block design 13.10. Object assembly 13.11. Digit-symbol
14. WMS (Wechsler, 1945). Digits subtest was not included to avoid duplication with the WAIS. subtests used:
14.1. Information 14.2. Orientation 14.3. Mental Control 14.4. Logical Memory 14.5. Visual Reproduction 14.6. Associative Learning
15. Wisconsin Card Sorting Test (WSCT; Hea-ton, 1981). Standard procedure was used, but only the following scores were included:
15.1. Categories achieved 15.2. Perseverative errors 15.3.Non-perseverative errors 15.4. Failure to maintain set
Special comment should be made on the verbal tests included in this research. Some of these tests correspond to widely accepted neuropsychological in-struments, frequently used in the Spanish speaking world and normalized in Spanish language (e.g., ver-bal fluency). In other cases, the best available Span-ish version was selected (e.g., Wechsler Memory Scale, Wechsler Adult Intelligence Scale). And fi-nally, some other tests were specifically assembled during the development of this research (e.g., Read-ing speed).
In total 41 different scores were used. Testing was performed by specially trained psychology stu-dents from San Buenaventura University, Medellin, Columbia, under the supervision of a professor. The
total time for testing was approximately 4 hours di-vided into one hour sessions. Interrater reliability ranged between 0.85 and 1.00 for the different sub-tests.
RESULTS
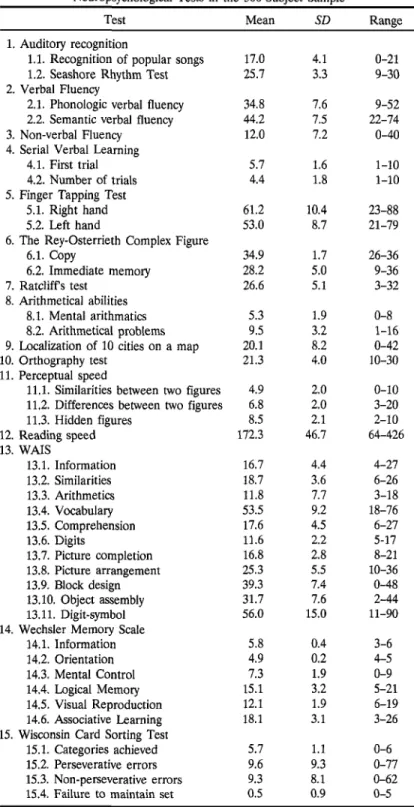
Means, standard deviations, and ranges for the 41 test scores were calculated. Results are presented in Table I. It is observed that mean scores were, in general, those expected according to the subjects' age and educational level (Ardila, Rosselli, and Puente, 1994; Lezak, 1995; Reitan and Davidson, 1975; Rei-tan and Wolfson, 1985; Spreen and Straus, 1991). Standard deviations were about one-fifth of the mean. For some of the tests, there are no available norms for comparisons. Current results can be taken as normative scores.
Intercorrelation among the different test scores were calculated. Two hundred eighty-nine out of 820 correlations (35.24%) reached an .01 statistical level of significance. These significant correlations are pre-sented from Table II through Table VIII, because they illustrate the association existing among differ-ent psychological and neuropsychological tests. Each correlation is presented in tables only when it first appears, but obviously if Test A is correlated with Test B, Test B is correlated with Test A.
Some of the tests presented a complex intercor-relation system. Others presented very few or no sig-nificant correlations. Recognition of Songs test did not significantly correlate with any other test, there-fore measuring a rather specific ability.
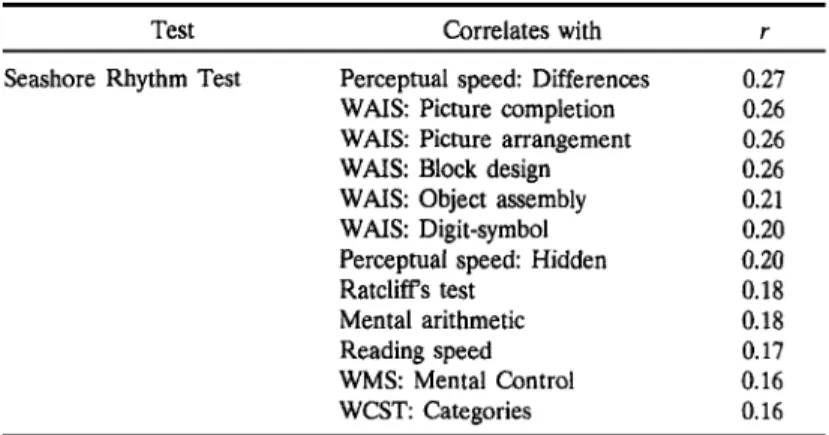
Table II presents the correlations found for the Seashore Rhythm Test. This test correlated with 12 other tests, but highest correlations were found for visuoperceptual (Perceptual Speed: Dif-ferences; WAIS: Picture Completion; Perceptual Speed: Hidden Figures), visuoconstructive (WAIS: Block Design; WAIS: Object Assembly), and visu-ospatial (Ratcliff s) tests. It may be assumed that the Seashore Rhythm Test is not evaluating a sin-gle specific ability, but rather an extended percep-tual ability.
in-Table I. Means and Standard Deviations Found in the Different Neuropsychological Tests in the 300-Subject Sample
Test
1. Auditory recognition
1.1. Recognition of popular songs 1.2. Seashore Rhythm Test 2. Verbal Fluency
2.1. Phonologic verbal fluency 2.2. Semantic verbal fluency 3. Non-verbal Fluency
4. Serial Verbal Learning 4.1. First trial 4.2. Number of trials 5. Finger Tapping Test
5.1. Right hand 5.2. Left hand
6. The Rey-Osterrieth Complex Figure 6.1. Copy
6.2. Immediate memory 7. Ratcliff s test
8. Arithmetical abilities 8.1. Mental arithmatics 8.2. Arithmetical problems 9. Localization of 10 cities on a map 10. Orthography test
11. Perceptual speed
11.1. Similarities between two figures 11.2. Differences between two figures 11.3. Hidden figures
12. Reading speed 13. WAIS 13.1. Information 13.2. Similarities 13.3. Arithmetics 13.4. Vocabulary 13.5. Comprehension 13.6. Digits
13.7. Picture completion 13.8. Picture arrangement 13.9. Block design 13.10. Object assembly 13.11. Digit-symbol 14. Wechsler Memory Scale
14.1. Information 14.2. Orientation 14.3. Mental Control 14.4. Logical Memory 14.5. Visual Reproduction 14.6. Associative Learning 15. Wisconsin Card Sorting Test
15.1. Categories achieved 15.2. Perseverative errors 15.3. Non-perseverative errors 15.4. Failure to maintain set
Table II. Correlations Over 0.15 (p < .01) Between Different Tests: Seashore Rhythm Test
Test
Seashore Rhythm Test
Correlates with
Perceptual speed: Differences WAIS: Picture completion WAIS: Picture arrangement WAIS: Block design WAIS: Object assembly WAIS: Digit-symbol Perceptual speed: Hidden Ratcliff s test
Mental arithmetic Reading speed WMS: Mental Control WCST: Categories
r
0.27 0.26 0.26 0.26 0.21 0.20 0.20 0.18 0.18 0.17 0.16 0.16
Table III. Correlations over 0.15 (p < .01) Between Different Tests: Verbal and Nonverbal Fluency Tests
Test
Phonologic Verbal Fluency
Semantic Verbal Fluency
Non- Verbal Fluency
Correlates with
Semantic Verbal Fluency WAIS: Digits
Mental arithmetic WAIS: Information WAIS: Arithmetic WAIS: Vocabulary WMS: Logical Memory WAIS: Comprehension WAIS: Similarities FTT: Right hand WAIS: Picture completion FTT: Left hand
WAIS: Arithmetic WAIS: Information WAIS: Digits
Perceptual speed: Similarities Localization of cities Perceptual speed: Hidden
r
0.31 0.23 0.22 0.21 0.21 0.21 0.20 0.20 0.20 0.17 0.17 0.16 0.27 0.22 0.19 0.18 0.16 0.16
tercorrelation (r = 0.31). Both Phonologic and Se- only correlated with Localization of Cities and with mantic Verbal Fluency significantly correlated with Perceptual Speed: Hidden Figures. The results may some mathematical ability tests (e.g., Mental Arith- suggest that whereas Verbal Fluency tests, particu-metics; WAIS: Arithmetic). Both also correlated with larly Phonologic Verbal Fluency, are associated with WAIS verbal abilities subtests; however, only relatively extended abilities, Non-verbal Fluency rep-Phonologic Verbal Fluency significantly correlated resents a mostly visuoperceptual and spatial ability with the Finger Tapping Test. Phonological and Se- test.
mantic Verbal Fluency tests presented somehow Table IV presents the correlations for the Serial weaker correlations with some perceptual ability sub- Verbal Learning, Finger Tapping Test, Rey-Oster-tests (e.g., WAIS: Picture Completion; Perceptual rieth-Complex Figure, and Ratcliff's Rey-Oster-tests. The two Speed: Similarities). Non-verbal Fluency test was scores used in the Serial Verbal Learning test (words
177
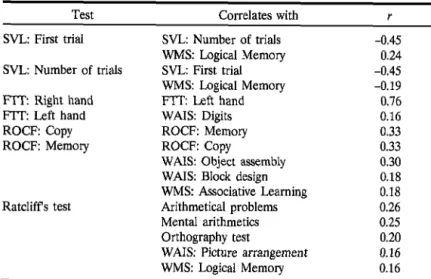
Table IV. Correlations over 0.15 (p < .01) Between Different Tests. Series Verbal Learning, Finger Tapping Tests, Rey-Osterrieth-Complex Figure, and Ratcliffs Testa
Test
SVL: First trial
SVL: Number of trials
FIT: Right hand FTT: Left hand ROCF: Copy ROCF: Memory
Ratcliffs test
Correlates with
SVL: Number of trials WMS: Logical Memory SVL: First trial WMS: Logical Memory FTT: Left hand WAIS: Digits ROCF: Memory ROCF: Copy
WAIS: Object assembly WAIS: Block design WMS: Associative Learning Arithmetical problems Mental arithmetics Orthography test
WAIS: Picture arrangement WMS: Logical Memory
r
-0.45 0.24 -0.45 -0.19 0.76 0.16 0.33 0.33 0.30 0.18 0.18 0.26 0.25 0.20 0.16 0.16
aOnly those correlations not presented in the previous table are included.
recalled in the first trial and number of trials re-quired to recall the ten words) were significantly in-tercorrelated (r = 0.45). Furthermore, both scores also correlated with the Logical Memory subtest from the WMS. The two conditions (right hand and left hand) in the Finger Tapping Test were highly in-tercorrelated (r = 0.76), and both correlated with Phonologic Verbal Fluency. The two conditions of the Rey-Osterrieth Complex Figure (copy and imme-diate memory) correlated 0.33. Surprisingly, for the copy condition no other significant correlation was found. For the immediate memory of the Rey-Oster-rieth Complex Figure, but not for the copy condition, significant correlation with the two WAIS construc-tional tests (Object assembly and Block design) was noted. Ratcliffs test correlated with mathematical ability tests (Arithmetical problems and Mental arith-metics), and also with a variety of other tests (Or-thography test; Seashore Rhythm Test; WAIS: Picture arrangement; WMS: Logical Memory).
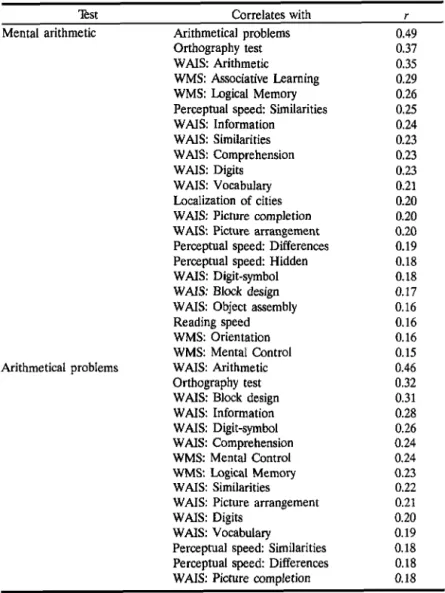
Arithmetical ability tests turned out to present a notably complex correlation system. Mental arith-metic significantly correlated with 25 test scores, and Arithmetical problems with 17 test scores. Some cor-relations were quite understandable (e.g., different mathematical test scores are highly intercorrelated), whereas other correlations were rather unexpected (e.g., both arithmetical ability tests highly correlate with the Orthography test). Main correlations were observed with verbal memory, visuospatial,
visuoper-ceptual, language, and visuoconstructive ability tests, (see Table V)
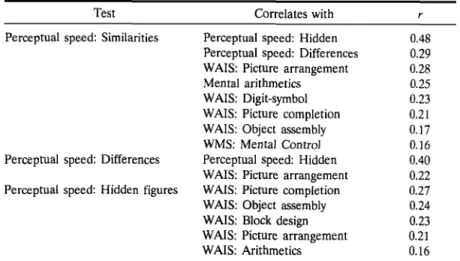
Table VI presents the correlations found for Lo-calization of Cities on a Map, Orthography test, and Reading Speed test. Interestingly, the ability to lo-calize cities on a map was best correlated with or-thography ability. It was also correlated with some specifically verbal (Information, Similarities, and Vo-cabulary) but also nonverbal (Block design) intelli-gence subtests. Orthography test, on the other hand, presented a quite complex system of intecorrelation with 17 test scores, particularly, mathematical abili-ties, reading ability, verbal intelligence (Information, Similarities, Vocabulary, and Comprehension from the WAIS), and visuoperceptual and visuospatial abilities (Localization of Cities; Ratcliff; Perceptual speed: Similarities; Perceptual speed: Differences; Picture completion from the WAIS). Reading speed was best correlated with the Orthography test, but was also correlated with perceptual ability tests and two verbal subtests from the WAIS (Vocabulary and Similarities).
Neuropsychological Activity
179
Table VIII presents the intercorrelations for the different WAIS verbal subtests. The Information sub-test presented strongly significant correlations with four other verbal subtests (Comprehension, Vocabu-lary, Arithmetic, and Similarities). Weaker, but still significant correlations with three performance sub-tests were also observed (Picture completion, Block design, and Picture arrangement). In addition, Infor-mation correlated with a variety of verbal, but also with nonverbal tests. The Similarities WAIS subtest best correlated with Vocabulary, Comprehension, In-formation, and Picture completion. This WAIS sub-test also correlated with a variety of verbal and nonverbal tests. As was observed with the
Arithmeti-cal ability tests, WAIS Arithmetic subtest presented a notably complex correlation system. As expected, WAIS Arithmetic best correlated with the ability to solve arithmetical problems (Arithmetical problems test) and to perform arithmetical calculations (Men-tal arithmetics test). In addition, WAIS Arithmetic correlated with a variety of WAIS verbal (Informa-tion, Comprehension, Vocabulary, Digits, and Simi-larities) but also nonverbal (Picture completion, Block design, and Picture arrangement) subtests. It also correlated with Orthography test, both verbal fluency tests, and two visuoperceptual tests (Local-ization of cities on a map; Perceptual speed: Hidden figures). Vocabulary scores significantly correlated Table V. Correlations over 0.15 (p < .01) Between Different Tests: Mental
Arithmetic and Arithmetical Problems Subtestsa
Test Mental arithmetic
Arithmetical problems
Correlates with Arithmetical problems Orthography test WAIS: Arithmetic WMS: Associative Learning WMS: Logical Memory Perceptual speed: Similarities WAIS: Information
WAIS: Similarities WAIS: Comprehension WAIS: Digits WAIS: Vocabulary Localization of cities WAIS: Picture completion
WAIS: Picture arrangement
Perceptual speed: Differences Perceptual speed: Hidden WAIS: Digit-symbol WAIS: Block design WAIS: Object assembly Reading speed WMS: Orientation WMS: Mental Control
WAIS: Arithmetic
Orthography test WAIS: Block design WAIS: Information WAIS: Digit-symbol WAIS: Comprehension WMS: Mental Control WMS: Logical Memory WAIS: Similarities WAIS: Picture arrangement WAIS: Digits
WAIS: Vocabulary
Perceptual speed: Similarities Perceptual speed: Differences WAIS: Picture completion
r 0.49 0.37 0.35 0.29 0.26 0.25 0.24 0.23 0.23 0.23 0.21 0.20 0.20 0.20 0.19 0.18 0.18 0.17 0.16 0.16 0.16 0.15 0.46 0.32 0.31 0.28 0.26 0.24 0.24 0.23 0.22 0.21 0.20 0.19 0.18 0.18 0.18
with the rest of the WAIS verbal subtests, with the exception of Digits. Vocabulary also correlated with one nonverbal WAIS subtest (Picture arrangement). In addition, it correlated with the Orthography test, Reading speed, and both Arithmetical ability tests (Mental arithmetic and Arithmetical problems). The comprehension WAIS verbal subtest, on the other hand, also correlated with the other WAIS verbal subtests, with the exception of Digits. Comprehen-sion was also correlated with Arithmetical ability tests, Orthography test, and Phonologic verbal flu-ency. A significant correlation was also found with one nonverbal WAIS subtest (Picture completion). Digits subtest best correlated with the three mathe-matical tests included in the test battery (Mental arithmetics, WAIS Arithmetic test, and Arithmetical problems) and with Phonologic verbal fluency. Evi-dently, Digits subtest to a significant extent may be considered to be a mathematical ability task. Weaker correlations were observed with Orthography test, tapping speed, and WAIS Similarities subtest.
Surprisingly, no significant intercorrelations among the different WAIS Performance subtests were found (see above). This observation strongly contrasts with the very significant intercorrelations found for the WAIS verbal subtests (excepting Dig-its), and suggests that WAIS Performance subtests are indeed measuring diverse and heterogenous abili-ties. Picture completion was best correlated with ver-bal (WAIS Similarities and Information), perceptual (Perceptual speed: Hidden figures and similarities; Seashore Rhythm Test), and calculation (WAIS: Arithmetic, Mental arithmetics, and Arithmetical problems tests) ability tests. Picture arrangement turned out to have important association with per-ceptual ability tests (Perper-ceptual speed: Similarities, Differences, and Hidden figures; Seashore Rhythm Test), but also with verbal abilities tests (e.g., Vocabu-lary, Information, Similarities), and the three mathe-matical ability tests (Arithmetical problems; Mental arithmetics; WAIS: Arithmetic). Block design from the WAIS significantly correlated with eight test scores, including mathematical, verbal, and percep-Table VI. Correlations over 0.15 (p < .01) Between Different Tests: Localization of
Cities on a Map, Orthography Test, and Reading Speed" Test
Localization of cities on a map
Orthography test
Reading speed
Correlates with
Orthography test WAIS: Information WAIS: Similarities WAIS: Block design WAIS: Arithmetic WAIS: Vocabulary WMS: Mental Control Reading speed WAIS: Information WAIS: Similarities WAIS: Vocabulary
Perceptual speed: Similarities Perceptual speed: Differences WAIS: Picture completion WAIS: Comprehension WAIS: Digits WAIS: Arithmetic Perceptual speed: Hidden WMS: Logical Memory WAIS: Picture arrangement Perceptual speed: Differences WAIS: Vocabulary
WAIS: Picture arrangement WAIS: Digit-symbol Perceptual speed: Hidden WAIS: Similarities
r
0.33 0.30 0.23 0.23 0.21 0.21 0.18 0.32 0.31 0.26 0.23 0.20 0.19 0.19 0.18 0.17 0.17 0.16 0.16 0.15 0.22 0.18 0.18 0.18 0.17 0.15
Neuropsychological Activity
181
tual tests. Surprisingly, no significant correlation was found with the other constructional test (i.e., Rey-Osterrieth Complex Figure, copy condition). Object assembly correlated with two perceptual tests (Per-ceptual speed: to find hidden figures, and to find similarities between two figures), and one nonverbal memory test (immediate memory of the Rey-Oster-rieth Complex Figure). A weaker correlation was found with the Mental arithmetic test. Finally, Digit-symbol best correlated with perceptual tasks (Percep-tual speed: Similarities; Seashore Rhythm Test). It also turned out to be significantly associated with mathematical abilities and reading speed.
In the WMS (above) highest correlations were observed between verbal memory subtests (Logical memory and Associative learning) and mathematical ability tests (Mental arithmetics and Arithmetical problems). Logical memory subtest also correlated with the two scores of the Verbal serial learning test. The Visual reproduction and Information subtests did not significantly correlate with any other test score. Orientation and mental control also correlated with mathematical ability tests, and in addition, Men-tal control correlated with some spatial and percep-tual tests (Localization of cities; Seashore Rhythm Test; Perceptual speed: Similarities). The WCST pre-sented few significant correlations: Categories corre-lated with the Seashore R h y t h m Test and Perseverative errors correlated with Phonologic Ver-bal Fluency. Seemingly, the WCST is measuring a relatively separated ability.
Finally, Verbal IQs, Performance IQs and Full Scale IQs were calculated, and correlations with the 41 test scores were obtained. Table IX presents these correlations. It is observed that all the verbal subtests are significantly correlated with the Verbal IQ. Best correlation was observed with the Vocabulary subtest, and lowest with the Digits subtest. In addition, Ver-bal fluency (phonologic but also semantic), Arith-metical abilities, Orthography test, and Localization of cities on a map also correlated with verbal intel-ligence. The performance IQ did not significantly correlate with any of the performance subtests. Best correlations were found with Mathematical ability tests (Arithmetical problems and Mental arithmetic), perceptual ability tests (Perceptual speed: Similari-ties; Seashore Rhythm Test; Perceptual speed: Hid-den; R a t c l i f f ) , a n d w r i t t e n l a n g u a g e tests (Orthography and Reading speed). Full Scale IQ best correlated with mathematical ability tests (Arithmeti-cal problems and Mental arithmetic), Orthography test, and some perceptual ability tests (Perceptual speed: Similarities; Seashore Rhythm Test; Percep-tual speed: Hidden). Some correlations were also found with verbal fluency tests, ROCF Memory, and Localization of cities on a map.
A factor analysis with varimax rotation of the neuropsychological battery tests was performed. Five different factors with an eigenvalue higher than 1.00 were disclosed. These five factors accounted for 63.6% of the total variance. The first factor ac-counted for about one-fourth of the total variance.
Table VII. Correlations over 0.15 (p < .01) Between Different Tests— Perceptual Speed Subtests: Similarities, Differences, and Hidden Figures"
Test
Perceptual speed: Similarities
Perceptual speed: Differences
Perceptual speed: Hidden figures
Correlates with
Perceptual speed: Hidden Perceptual speed: Differences WAIS: Picture arrangement Mental arithmetics WAIS: Digit-symbol WAIS: Picture completion WAIS: Object assembly WMS: Mental Control Perceptual speed: Hidden WAIS: Picture arrangement WAIS: Picture completion WAIS: Object assembly WAIS: Block design WAIS: Picture arrangement WAIS: Arithmetics
r
0.48 0.29 0.28 0.25 0.23 0.21 0.17 0.16 0.40 0.22 0.27 0.24 0.23 0.21 0.16
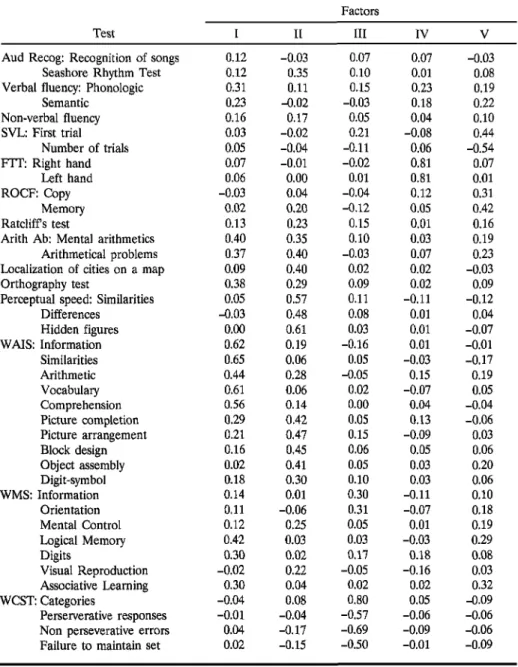
Table X presents the general results of the factor with verbal fluency tests. And finally, Factor V pre-analysis, sented a negative correlation with the SVL number The correlations between the different tests and of trials (-0.54) and SVL first trial (0.44); and also the five factors are presented in Table XI. It is ob- correlated with ROCF memory (0.42). It represents served that for each factor, only a few test scores pre- in consequence a memory factor,
sent a high correlation with the factor, while the rest of the correlations are in general low. Factor I best
correlated with WAIS Similarities (0.65), WAIS In- DISCUSSION formation (0.62), WAIS Vocabulary (0.61),
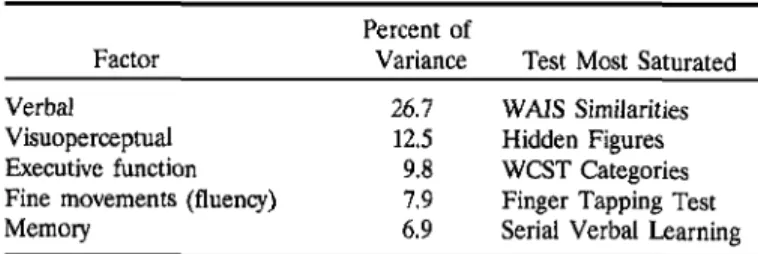
Compre-hension (0.56), and Arithmetic (0.44); and also WMS Current results point to a complex interrela-Logical Memory subtest. Undoubtedly, it represents tion among different neuropsychological test a verbal factor, best evaluated with the WAIS verbal scores. Major factors found using the current set subtests. Factor II best correlated with Perceptual of evaluation instruments included a verbal (26.7% speed: Hidden Figures (0.61); Perceptual speed: of the variance), a visuoperceptual (12.5% of the Similarities (0.57); and Perceptual speed: Differences variance), a concept formation (executive function; (0.48); but also correlated with WAIS Picture ar- 9.8% of the variance), a fine movements (fluency; rangement (0.47), WAIS Block Design (0.45), WAIS 7.9% of the variance), and a memory factor (6.9% Picture Completion (0.42), and WAIS Object Assem- of the variance). These factors may correspond to bly (0,41). It was a perceptual or nonverbal factor. some major neuropsychological (cognition) do-Factor III best correlated with WCST Categories mains (Table XII).
(0.80), but also negative correlations were found with Several shortcomings, however, should be the other WCST scores (Perseverative errors, Non pointed out in the present research study: (1) Subject perseverative errors, and Failure to maintain set). variables (age, educational level, gender, handedness, The rest of the correlations were low. Factor IV was and socioeconomic status) were similar among the best correlated with the FTT right hand (0.81), and sample. This was a consequence of the attempt to left hand (0.81). Minor correlations were observed homogenize the sample and to avoid as best as
pos-Table VIII. Correlations over 0.15 (p < .01) Between Different Tests- WAIS: Verbal Subtestsa
Test
WAIS: Information
WAIS: Similarities
WAIS: Arithmetic
WAIS: Vocabulary WAIS: Comprehension
Correlates with
WAIS: Comprehension WAIS: Vocabulary WAIS: Arithmetics WAIS: Similarities WAIS: Picture completion WAIS: Block design WAIS: Picture arrangement WAIS: Vocabulary WAIS: Comprehension WAIS: Information WAIS: Picture completion WAIS: Arithmetics WAIS: Picture arrangement WAIS: Digits
WASI Comprehension WAIS: Vocabulary WAIS: Picture completion WAIS: Digits
WAIS: Block design WAIS: Picture arrangement WAIS: Picture arrangement WAIS: Picture completion
r
0.46 0.44 0.40 0.39 0.27 0.26 0.18 0.45 0.42 0.39 0.32 0.18 0.18 0.16 0.32 0.31 0.26 0.22 0.21 0.15 0.26 0.25
Neuropsychological Activity 183
sible the effects of the subjects' variables. However, (Lezak, 1995). Current test scores should be treated generalization of the results may still be challenged. with extreme caution when dealing with individuals In addition, test data were collected in a quite spe- from different age, educational level, gender, hand-cific cultural context. Diverse demographic and indi- edness, socioeconomic status, and culture back-vidual variables may potentially affect test scores ground. Nonetheless, the main purpose of this
Table X. Factor Analysis of the Neuropsychological Test Battery
Factor
I II III IV V
Eigenvalue
4.657 2.176 1.704 1.371 1.201
Percent of Variance
26.7 12.5 9.8 7.9 6.9
Cumulative Percent
26.7 39.1 48.9 56.7 63.6 Table IX. Correlations over 0.15 (p < .01) Between Verbal IQ, Performance IQ
and Full Scale IQ with Different Test Scores
Test
Verbal IQ
Performance IQ
Full Scale IQ
Correlates with
WAIS: Vocabulary WAIS: Comprehension WAIS: Information WAIS: Similarities WAIS: Arithmetic Arithmetical problems Phonologic verbal fluency Mental arithmetic Orthography test WAIS: Digits Localization of cities Semantic verbal fluency Arithmetical problems Perceptual speed: Similarities Seashore Rhythm Test Mental arithmetic Perceptual speed: Hidden ROCF: Memory Orthography test Reading speed Ratcliff s test Arithmetical problems Orthography test Mental arithmetic
Perceptual speed: Similarities Seashore Rhythm Test Perceptual speed: Hidden Phonologic verbal fluency ROCF: Memory Localization of cities
Reading speed Semantic verbal fluency Ratcliff s test
r
research was not to collect normative test informa- tions are expected. Correlations observed in Table II tion, but to establish the intercorrelations existing to Table VIII are lower that would have been the among different psychological and neuropsychologi- case if the subjects had been chosen from the general cal test scores. This information may potentially be population (Matarazzo, personal communication in useful in developing a model of neuropsychological the review of this paper). (3) The number of tests activity. (2) The sample, as a matter of fact, was not and subjects were relatively low (300 subjects and 41 a general population normal sample. It may be an- test scores. It means the ratio of subjects/variables ticipated that the individual differences in abilities in was about 7.3:1). (4) Even though an effort was made a sample of bright subjects reveals that the individual to cover different neuropsychological areas, distribu-scores are skewed toward the high ability end. As a tion of the tests may be criticized; many tests were consequence, fewer statistically significant
correla-Table IX. Correlations Between the Different Tests and the Five Factors
Factors
Test
Aud Recog: Recognition of songs Seashore Rhythm Test Verbal fluency: Phonologic
Semantic Non-verbal fluency SVL: First trial
Number of trials FTT: Right hand
Left hand ROCF: Copy
Memory Ratcliff s test
Arith Ab: Mental arithmetics Arithmetical problems Localization of cities on a map Orthography test
Perceptual speed: Similarities Differences Hidden figures WAIS: Information Similarities Arithmetic Vocabulary Comprehension Picture completion Picture arrangement Block design Object assembly Digit-symbol WMS: Information Orientation Mental Control Logical Memory Digits Visual Reproduction Associative Learning WCST: Categories Perserverative responses Non perseverative errors Failure to maintain set
Neuropsychological Activity
185
Table XII. Major Factors Found Using the Current Set of Evaluation Instruments
Factor
Verbal Visuoperceptual Executive function Fine movements (fluency) Memory
Percent of Variance
26.7 12.5 9.8 7.9 6.9
Test Most Saturated
WAIS Similarities Hidden Figures WCST Categories Finger Tapping Test Serial Verbal Learning
language-related and no somatosensory test was in-cluded.
Despite these shortcomings, the current results of normal performance in neuropsychological tests, albeit tentative, allow some conclusions to be drawn. It was found that some of the tests presented a quite complex intecorrelation system. This was par-ticularly evident with the Sheashore Rhythm test, Phonologic verbal fluency, Orthography test, the cal-culation ability tests, the Perceptual ability tests, Lo-calization of cities on a map, and most of the WAIS verbal subtests. Some other tests presented few or no significant correlations. Most likely, in the former case, they are tests requiring multiple basic abilities ("brain systems") to be successfully performed. In the latter case, they represent tests measuring some-how separated or specific abilities not shared by other tests. This latter situation was observed spe-cially with regard to the Recognition of songs test, and the Wisconsin Card Sorting Test. It had been an-ticipated that the Recognition of songs would corre-late with the Seashore Rhythm test, and very likely, with other perceptual and nonverbal memory tests. This assumption was not supported and it has to be concluded that the ability required to recognize songs (a kind of perceptual and memory musical ability) may be considered a skill somehow different from the whole array of cognitive abilities measured with the rest of the test battery. With regard to the WCST it had been anticipated it would correlate with other executive function-related tests, usually sensitive to frontal pathology. This assumption was only partially supported: Perseverative errors score negatively cor-related with Phonologic verbal fluency, a test usually considered to be measuring executive functions. The WCST seems to be evaluating a rather different abil-ity, one not measured in traditional psychological and neuropsychological tests.
Calculation ability turned out to represent rather complex cognitive ability. Three different tests
were used to evaluate the calculation abilities (Men-tal arithmetical operations, Arithmetical problems, and WAIS Arithmetic subtests). It may be assumed that arithmetical ability is associated with and de-pends upon some verbal, visuoperceptual, visuospa-tial, and memory abilities. It represents a kind of multifactorial ability. It is not surprising that a wide variety of calculation disturbances are observed in brain pathology (Ardila and Rosselli, 1990). Acalcu-lia can be associated with disturbances in verbal, spa-tial, memory, and executive functions abilities. Interestingly, some authors have emphasized the strong association between acalculia and defects in verbally mediated spatial knowledge (Luria, 1980).
Orthographic knowledge was mainly associated with mathematical, spatial, and verbal abilities. The association with other verbal abilities is quite obvi-ous. The association with spatial skills is not unex-pected either. For the Spanish language, it has been observed that dysorthography is significantly in-creased in cases of right hemisphere pathology (Ardila, 1984; Ardila et al., 1996). It is interesting to note that when making orthographic decisions, Span-ish speakers quite often have to write down the word, in order to see "how it looks." Orthographic knowl-edge may represent to a significant extent a visuo-perceptual ability for Spanish speakers. Orthographic ability, as well as arithmetic ability, may be related to a wide range of other cognitive abilities, and this may be the reason for the association between arith-metic and orthographic abilities. As a matter of fact, both arithmetical abilities and orthographic abilities turned out to be the best predictors of "general in-telligence" (see below).
spe-cifically, a mathematical ability test, even though it also significantly correlated with the Phonologic ver-bal fluency and Finger Tapping tests (kind of "se-quencing" or "generating" or "fluency' tests). The WAIS Arithmetic sub test is somehow in between: It represents a numerical ability task strongly associated with other calculation ability tests, and it is also a verbal test strongly correlated with Information, Comprehension, and Vocabulary subtests. As men-tioned above, mathematical ability seems to repre-sent a quite complex and multifactorial ability, involving verbal, visuoperceptual, visuospatial, and memory skills.
According to our results Performance IQ in-cluded a heterogenous group of abilities. The ab-sence of significant intercorrelations among the different Performance subtests emphasizes that Per-formance IQ includes a rather diverse group of skills, such as perceptual abilities, nonverbal memory abili-ties, mathematical abiliabili-ties, and even verbal abilities. The question of what are indeed performance abili-ties should be raised. Whereas verbal IQ seems to represent a relatively well-defined concept (i.e., an evident verbal factor is readily identified), perform-ance IQ seems to be an ill-defined concept. It is as-sumed that performance tests as a whole are those tests involving the manipulation of objects (Anastasi, 1988). According to this definition, only Block design and Object assembly can be considered as perform-ance subtests. However, seemingly these two tests are not measuring the very same ability. Correlation be-tween Object Assembly and Block design was not statistically significant. Whereas Block design best correlated with the calculation ability tests (Arith-metical problems, WAIS Arithmetics, and Mental Arithmetics), verbal subtests (Information), and the perceptual ability tests (Perceptual speed: Hidden; Seashore Rhythm Test; Localization of cities), Object assembly best correlated with nonverbal memory (ROCF: Memory) and perceptual tests (Perceptual speed: Hidden figures and similarities between two figures). It means Objects assembly seems to repre-sent a more visuoperceptual test, whereas the per-formance of the Block design subtest may require a larger amount of basic abilities.
Picture arrangement, on the other hand, best correlated with perceptual ability tests (Perceptual speed: Similarities, differences, and hidden figures; Seashore Rhythm Test; Ratcliff), but also correlated with some verbal WAIS subtests (Vocabulary, Infor-mation, and Similarities), and mathematical ability
tests (Arithmetical problems, WAIS Arithmetics, and Mental Arithmetics). Picture completion correlated with some visuoperceptual tests (Seashore Rhythm Test; Perceptual speed: Hidden figures and Similari-ties; Ratcliff's test). Some lower correlations were also found with verbal subtests (Vocabulary, Informa-tion, and Similarities from the WAIS), plus arithmeti-cal and reading abilities. In consequence, it seems to be related with a broader array of cognitive abilities. Digit-symbol seems to be not only a perceptual (Per-ceptual speed: Similarities; Seashore Rhythm Test), but also an arithmetic (Arithmetical problems and Mental arithmetics) and reading (Reading speed) ability test.
Briefly stated, scores observed in WAIS Per-formance subtests are complex, heterogenous, and not easy to interpret. The concept of Performance IQ seems to be somehow confusing from the per-spective of our current results.
Neuropsychological Activity 187
in topographical memory, defects in orientation, and unilateral spatial agnosia. Hecaen (1962) proposed to separate (1) disorders in spatial perception, (2) de-fects in spatial manipulation, including the loss of topographical concepts, and unilateral spatial ag-nosia, (3) loss of topographical memory, and (4) Balint's syndrome. De Renzi (1982, 1985) presents some modifications to Hecaen's classification. Balint's syndrome is included within visual explora-tion disorders, and instead of disorders in manipula-tion of spatial informamanipula-tion, introduces the group of disorders in spatial thought.
It is interesting to emphasize that all these dis-orders appear, mainly or exclusively, in cases of right hemisphere pathology. That is, the right hemisphere seems to be specialized in spatial cognition. Seem-ingly, language and ideomotor praxic abilities are de-veloped in the left brain in areas that in the right brain are involved in spatial cognition (LeDoux, 1984).
Full Scale IQ ("general intelligence") was best associated with the mathematical ability tests and the Orthography test. These correlations were particu-larly high and extremely significant. They were quite surprising as well. The association with some percep-tual tests was somehow lower, yet strongly significant. All of these tests (mathematical, orthographic, and perceptual tests) presented a very complex intercor-relation system with a wide variety of other psycho-logical and neuropsychopsycho-logical tests. In consequence, they may be measuring a diversity of cognitive abili-ties. But although, mathematical abilities and orthog-raphy knowledge represented the best predictors of Full Scale IQ, interestingly, no single WAIS verbal or performance subtests, according to current results, can be considered a good predictor of Full Scale IQ. Surprisingly, no correlation was observed be-tween any of the IQs (Verbal, Performance, and Full Scale) and the WCST This finding may emphasize that the WCST indeed is measuring an ability (con-cept formation, executive function) not traditionally included in other psychological and neuropsychologi-cal tests. It does not appear to have anything to do with what usually is considered to be "general intel-ligence," and it conforms to an independent factor. In other words, the WAIS is not tapping for executive functions. This might be interpreted as a contradic-tion of the concept of intelligence (Ardila, submit-ted).
The interpretation of current WAIS results within the traditional meaning of "intelligence" is not
easy. Different cognitive skills (or different forms of intelligence) beyond those measured in classical in-telligence scales can be supposed (Gardner, 1983): for example, musical abilities (or musical intelli-gence) is not usually included in intelligence testing, but was included in this research study. The matrix of intercorrelations that we observed was notably larger than usually reported in the WAIS factor analyses (e.g., Leckliter et al., 1986; Matarazzo, 1972). It was not surprising that a higher number of factors, beyond the three classical WAIS factors ("Verbal Comprehension," "Perceptual Organiza-tion," and "Freedom of Distractibility") were satu-rating the different WAIS subtests. As a matter of fact, "intelligence" is to a significant extent a con-fused and poorly understood concept. Intelligence has been associated with age, biological factors, nu-tritional level, cultural conditions, schooling, occupa-tion, family environment, and even gender (Neisser et al., 1996). Undoubtedly, neuropsychological ap-proach may significantly contribute to the under-standing of organization of cognitive abilities ("intelligence") and may be most useful in the de-velopment of a general theory of cognition.
used to assess constructional apraxia have been found, these correlations are not so high as to ex-clude the possibility that different neuropsychological subtypes of constructional apraxia can be identified. According to Benton, it seems reasonable to assume at least two different subtypes of constructional apraxia, one of them associated with disturbances in drawing and the other correlated with impairments in assembling activities. The long-lasting question about the lateralization of constructional apraxia might be enlightened, if different syndrome subtypes were distinguished.
Five different factors were disclosed, the first one accounting for over one fourth of the variance. This first factor was a clearly verbal ability factor, best tapped with the Similarities, Information, Vo-cabulary, and Comprehension subtests from the WAIS. This result reinforces the assumption that ver-bal factor represents a well-defined, clear concept, and that Arithmetic and Digits subtests are not purely verbal, but also nonverbal subtests. Factor II was a perceptual or nonverbal factor, whereas factor III was simply a WCST factor, nonsignificantly cor-related with other test scores. Minor correlations were observed with the WMS Information and Ori-entation subtests. Factor IV was kind of a fine-motor factor or (motor and verbal) fluency. Factor V was obviously a memory factor. In general, correlations between individual tests and the five extracted factors were very high (frequently over 0.80). Few test scores were simultaneously and significantly saturated by two different factors.
The factor structure of our neuropsychological battery test presented some general similarities with the factor structure reported in intelligence factorial research using the WAIS (Cohen, 1957; Matarazzo, 1972). The number of factors that we observed, how-ever, was higher. WAIS Factor I ("Verbal Compre-hension" factor: I n f o r m a t i o n , Vocabulary, Similarities, and Comprehension substests) is obvi-ously the very same Factor I (Verbal factor), and the very same WAIS subtests are saturated by this factor. Factor II ("Perceptual Organization" factor: Object Assembly, Block Design, Picture Completion, and Picture Arrangement subtests) corresponds to our very same perceptual factor (Perceptual speed: Hid-den Figures, Picture Arrangement, Block Design, Picture Completion, and Object Assembly). Our Fac-tor III (WCST: all the scores that were analyzed) does not correspond to any WAIS factor. As empha-sized above, the WCST is measuring an ability
("ex-ecutive function") that is not usually included in the general intelligence tests. It is not easy to match Fac-tor IV ("Fine movements" or "generating" facFac-tor) and Factor V (Memory factor) with any of the WAIS factors.
The factor structure found in this research study is similar to the factor structure reported by Ardila, Rosselli, and Bateman (1994), even though they re-ported a higher number of factors. The tests and the types of subjects, however, were different. Current Factor I (verbal factor) evidently corresponds to the similar Factor V ("Verbal Knowledge"). Current Fac-tor II (nonverbal or perceptual facFac-tor) may corre-spond to their Factor II ("Nonverbal Memory and Constructional Factor"). Current Factor III associ-ated with the different WCST scores is not easy to match with any other factor. Factor IV (FTT right and left hand) is exactly the very same Factor IV as-sociated with fine movements (tapping subtests, right and left hand). Current Factor V (Verbal memory factor) is the same as Factor III ("Verbal Memory Factor").
Ponton et al. (1994) also found five different fac-tors. They observed a very significant verbal factor (corresponding to our very same verbal factor), a learning factor (corresponding to our verbal learning factor), a factor related to speed of processing (not easy to equate with any of our current factors), a Vis-ual Processing Factor (corresponding to our nonver-bal or perceptual factor), and finally, a Factor of Psychomotor Speed (corresponding to our fine move-ments factor). Thus, the factor structure is virtually identical, excepting the fact we found that the WCST represented an isolated factor (as a matter of fact, Ponton et al. did not administer the WCST), but we did not find an attentional (speed of processing) fac-tor.
Neuropsychological Activity
189
It can be expected they were impaired in cases of pathology of this "brain system" (i.e., some premotor damage). Correlations among these two sub tests and other tests (excepting verbal fluency) were low. The brain activity supporting the performance in these two subtests (and partially phonologic verbal fluency) should be quite independent of the brain activity sup-porting the performance in the rest of the battery. Both tests share the same "brain system" and "func-tional distance" between them is very low. Con-versely, "functional distance" between these two tests and the rest of the tests is high. "Functional distance" should be understood as the commonality in the brain organization of the cognitive processes support-ing their performance.
Matarazzo (1992) has emphasized the necessity of a better understanding of the structure of cogni-tive activity. According to him, the neuropsychologi-cal tests of the future will provide more sophisticated analysis of the component processes underlying vari-ous cognitive functions. Excellent clinical/anatomical correlations (i.e., sensitivity and specificity of differ-ent neuropsychological tests to differdiffer-ent brain pa-thologies) have been obtained in neuropsychology clinical research. However, our understanding about the structure of the cognitive activity, and its brain organization, is still limited. The necessity of further analysis of the underlying cognitive structure meas-ured through our current neuropsychological tests is evident.
ACKNOWLEDGMENTS
This research was partially supported by Col-ciencias (Fondo Colombiano para el Desarrollo Cientifico y Tecnologico—Colombian Fund for Sci-entific and Technological Development). Thanks to Susan Hugel and Dr. Miguel Perez for their help in editing this paper and very important suggestions. Our most sincere gratitude to J. D. Matarazzo and the other two (anonymous) reviewers for their most encouraging and helpful comments.
REFERENCES
Anastasi, A. (1988). Psychological Testing (6th ed.), Macmillan, New York.
Ardila, A. (1984). Right hemisphere participation in language. In Ardila, A., and Ostrosky-Solis, F. (eds.), The Right
Hemi-sphere: Neurology and Neuropsychology, Gordon and Breach Science Editors, London (pp. 99-110).
Ardila, A. (submitted). The Bell curves: A neuropsychological per-spective of intelligence. Neuropsychology Review.
Ardila, A., and Rosselli, M. (1990). Acalculias. Behavioral Neurol-ogy 3: 39-48.
Ardila, A., and Rosselli, M. (1992). Neuropsicologia Clinica [Clini-cal neuropsychology], Prensa Creativa, Medellin, Colombia. Ardila, A., Rosselli, M., and Puente, A. (1994). Neuropsychological
Evaluation of the Spanish-Speaker, Plenum, New York. Ardila, A, Rosselli, M., and Bateman, J. R. (1994). Factorial
struc-ture of cognitive activity. Behavioural Neurology, 7: 49-58. Ardila, A., and Rosselli, M. (1994). Development of language,
memory and visuospatial abilities in 5- to 12-year-old children using a neuropsychological battery. Developmental Neuropsy-chology 10: 97-120.
Ardila, A., Rosselli, M., and Ostrosky, E (1996). Agraphia in Span-ish-speakers. Aphasiology 10: 723-739, 1996.
Benson, D. F, and Ardila, A. (1996). Aphasia: A Clinical Perspec-tive, Oxford University Press, New York.
Benton, A. (1990). Constructional apraxia. In Goodglass, H., and Damasio, A. R. (eds.), Handbook of Clinical Neuropsychology (Vol. 2), Elsevier, Amsterdam, pp. 287-294.
Bornstein, R. A, and Chelune, G. J. (1988). Factor structure of the Wechsler Memory Scale-Revised. The Clinical Neuropsy-chologist 2: 107-115.
Carroll, J. B. (1993). Human Cognitive Abilities: A Survey of Fac-tor-Analytic Studies, Cambridge University Press, Cambridge. Cattell, R. B. (1971). Abilities: Their Structure, Growth and Action,
Houghton-Mifflin, Boston.
Cohen, J. A. (1957). A factor analytically-based rationale for the Wechsler Adult Intelligence Scale. Journal of Consulting Psy-chology, 21: 451-457.
Critchley, M. (1968). Clinical considerations on parietal lobe. In Velasco, M., and Escobedo, F. (eds.), Parietal Lobe, Institute Mexicano de Neurologia, Mexico, pp. 1-35.
De Renzi, E. (1982). Disorders of Space Exploration and Cognition, Wiley, New York.
De Renzi, E. (1985). Disorder of space exploration. In Frederiks, J.A.M. (ed.), Handbook of Clinical Neurology: Clinical Neuro-psychology (Vol. 45), Elsevier, Amsterdam, pp. 405-422. Elwood, R. W (1991). Factor structure of the Wechsler Memory
Scale-Revised (WMS-R) in a clinical sample: A methodologi-cal reappraisal. The Clinimethodologi-cal Neuropsychologist 5: 329-337. Gardner, H. (1983). Frames of Mind: The Theory of Multiple
Intel-ligences, Basic Books, New York.
Guilford, J. P (1967). The Nature of Human Intelligence, McGraw-Hill, New York.
Guilford, J. R (1968). Intelligence has three facets. Science 160: 615-620.
Guilford, J. R, and Hoepfner, R. (1971). The Analysis of Intelli-gence, McGraw-Hill, New York.
Haut, J. S., Haut, M. W, Callahan, T S., and Franzen, M. D. (1992). Factor analysis of wide range of assessment of memory and learning (WRAML) scores of a clinical sample. The 12th Annual Meeting, National Academy of Neuropsychology. Pittsburgh, PA.
Heaton, R. K. (1981). Wisconsin Card Sorting Test: Manual. Psy-chological Assessment Resources, Odessa, FL.
Hecaen, H. (1962). Clinical symptomatology in right and left hemi-sphere lesions. In Mountcastle, V B. (ed.), Interhemispheric Relations and Cerebral Dominance, Johns Hopkins, Baltimore, MD, pp. 215-243.
H6caen, H., and Albert, M. L. (1978). Human Neuropsychology, Wiley, New York.
Holmes, G. (1918). Disturbances of visual orientation. British Jour-nal of Ophthalmology 2: 449-486.
Jones-Gotman, M., and Milner, B. (1977). Design fluency: The invention of nonsense drawings after focal cortical lesions. Neuropsychologia 15: 653-674.
Leckliter, I. N., Matarazzo, J. D., and Silverstein, A. B. (1986). A literature review of factor analytic studies of the WAIS-R. Journal of Clinical Psychology 42: 332-342.
LeDoux, J. E. (1984). Cognitive evolution: clues from brain asym-metry. In Ardila, A., and Ostrosky-Solis, F. (eds.), The Right Hemisphere: Neurology and Neuropsychology, Gordon and Breach Science Publishers, London, pp. 51-60.
Lezak, M. D. (1995). Neuropsychological Assessment (3rd ed.), Ox-ford University Press, New York.
Luria, A. R. (1980). Higher Cortical Functions in Man (2nd ed.), Basic, New York.
Matarazzo, J. D. (1972). Wechsler's Measurement and Appraisal of Adult Intelligence, Oxford University Press, New York. Matarazzo, J. D. (1992). Psychological testing and assessment in
the 21st century. American Psychologist 47: 1007-1118. Morrow, L., and Ratcliff, G. (1988). The neuropsychology of
spa-tial cognition. In Stiles-Davis, J., Kritchevsky, M., and Bellugi, U. (eds.), Spatial Cognition: Brain Bases and Development, Lawrence Erlbaum Associates, Hillsdale, NJ, pp. 5-32. Neisser, U., Boodoo, G., Bouchard, T J., Boykin, A. W, Brody,
N., Ceci, S. J., Halpern, D. E, Loehlin, J. C., Perloff, R., Sten-berg, R. J. and Urbina, S. (1996). Intelligence: Knowns and unknowns. American Psychologist 51: 77-101.
Newcombe, E, and Ratcliff, G. (1989). Disorders of visuospatial analysis. In Goodglass, H., and Damasio, A. R. (eds.), Hand-book of Clinical Neuropsychology (Vol. 2), Elsevier, Amster-dam, Elsevier, pp. 333-356.
Ostrosky, E, Canseco, E., Quintanar, L., Navarro, E., and Ardila, A. (1985). Sociocultural effects in neuropsychological assess-ment. International Journal of Neuroscience 27: 53-66.
Ostrosky, E, Quintanar, L., Canseco, E., Meneses, S., Navarro, E., and Ardila A. (1986). Habilidades cognoscitivas y nivel so-ciocultural. Revista de Investigaci6n Clinica (Mexico), 38: 37-42.
Osterrieth, P. A. (1944). Le test de copie d'une figure complexe. Archives de Psychologie 30: 206-356.
Pont6n, M. O., Satz, E, and Herrera, L. (1994). Factor analysis of a neuropsychological screening battery for Hispanics (NeSBHIS). XVII European Meeting, International Neuro-psychological Society, Angers, France.
Ratcliff, G. (1979). Spatial thought, mental rotation and the right hemisphere. Neuropsychologia 17: 49-54.
Reitan, M. R., and Davidson, L. A (1974). Clinical Neuropsychol-ogy: Current Status and Applications, Wiley, New York. Reitan, R. M., and Wolfson, D. (1985). The Halstead-Reitan
Neuropsychological Battery. Theory and Clinical Interpretation, Neuropsychology Press, Tucson, AZ.
Roid, G. H., Prifitera, A., and Ledbetter, M. (1988). Confirmatory analysis of the factor structure of the Wechlser Memory Scale—Revised. The Clinical Neuropsychology 2: 116-120. Rosselli, M. (1988). Conocimiento espacial y sus alteraciones, Acta
Neuroldgica Colombiana 2: 5-10.
Spreen, O., and Strauss, E. (1991). A Compendium of Neuropsy-chological Tests, Oxford University Press, New York. Taylor, E. M. (1959). The Appraisal of Children with Cerebral
Defi-cits, Harvard University Press, Cambridge, MA.
Wechsler, D. A. (1945). standardized memory scale for clinical use. Journal of Psychology 19: 87-95.
Wechsler, D. (1993). Escala de Inteligencia de Wechsler para Adul-tos, Editorial TEA, S. A, Madrid.
Wechsler, D. (1987). Manual for the Wechsler Memory Scale-Re-vised, The Psychological Corporation, San Antonio, TX. Wilhem, K. L, and Franzen, M. D. (1992). A factor analysis of