Essays in Market Microstructure
Inter-Market Competition, Algorithmic Trading, and
Call Auctions
PETER HOFFMANN
TESI DOCTORAL UPF / 2011
DIRECTOR DE LA TESI
Prof. Francisco Peñaranda
Acknowledgements
Writing a PhD thesis in (financial) economics is a challenging task, and I owe a great deal of gratitude to the many people that helped me on this bumpy path during the past years, either through professional advice or love and friendship.
Francisco Peñaranda has been an incredible advisor and a constant source of motivation and encouragement. Particularly in the early days of my PhD, he taught me to look on the bright side and shrug off my desperation and pessimism. Throughout the years, we spent countless hours in his office, discussing about market microstructure, econometrics, and life. Finally, he provided priceless professional and mental support during the never-ending period of the academic job market.
I also owe a very special thanks to Xavier Freixas, who has offered invaluable help on countless occasions and therefore made my life so much easier. Jos van Bommel got me excited on the topic of market microstructure and has been a great co-author and mentor since we met during his sabbatical at UPF.
Additionally, I have benefitted from many useful conversations with José Apesteguia, Bruno Biais, Álvaro Cartea, Jean-Edouard Colliard, Fany Declerck, Hans Degryse, Ariadna Dumitrescu, Thierry Foucault, Javier Gil, Javier Gómez, Philip Hamill, Albert Menkveld, Sophie Moinas, Kristoffer Nimark, Han Ozsoylev, Roberto Pascual, Ander Pérez, Ailsa Röell, Augusto Rupérez, Karl Schlag, Xavier Vives, Christian Voigt, and many others.
Many thanks! Additionally, I would like to thank the remaining current and former members of the GPEFM office staff, in particular Laura Agustí, who was an invaluable help throughout the academic job market.
While studying in Barcelona has been a very challenging and rewarding experience from a professional perspective, the people I spent my time with in this beautiful city are the ones that made this time a life-changing experience. Chatting up with my office mates Diego, Gene, Joan and Paulo was a great reason to make the trip to school even on days I was not intending to get any work done. Many thanks to Andrea, Arie, Bernhard, Burak, Caterina, David, Emre, Filippo, Francesco, Funda, Gonçalo, Ipek, Jacopo, Johannes, Marco, Nacho, Natalia, Raquel, Sandro, Selin, Silvia (x2), Stan, Stéphane, Steve, and Sumit for the conversations, laughs, drinks and trips we shared during my time in Barcelona (and elsewhere). Javi and Bea enriched my understanding of both the Spanish language and the Spanish way of life. Without them, I would probably still be close to the average “Guiri”. Also, life in Barcelona wouldn’t have been the same without the times I spent with Shikeb and Zeynep. Thanks!
Without the love and support of my girlfriend Başak, this thesis would have never been completed. Above everything, she helped me to survive several minor and major “crises” that probably most PhD students experience one way or another. I owe her my deepest gratitude for believing in me, for sharing so many unforgettable moments, and for making me a better person.
Abstract
This thesis covers three topics in Market Microstructure. Chapter 1 demonstrates that market access frictions may play a significant role in the competition between trading platforms. Analyzing a recent dataset of the trading activity in French and German stocks, we provide evidence that the incumbent markets dominate because the sole market entrant exposes liquidity providers to an excessive adverse selection risk due to a lack of noise traders. Chapter 2 presents a theoretical model of price formation in a dynamic limit order market with slow human traders and fast algorithmic traders. We show that in most cases, algorithmic trading has a detrimental effect on human traders’ welfare. Finally, Chapter 3 empirically analyzes the role of pre-trade transparency in call auctions. Comparing the trading mechanisms in place on the French and German stock exchanges, we find that transparency is associated with higher trading volume, greater liquidity, and better price discovery.
Resumen
Preface
The topic unifying the three chapters of this thesis is market microstructure, a research field that can be loosely defined as the detailed study of the trading process in financial markets. When thinking of a stock exchange, most people picture a large hall populated by shouting men. While this could somehow be considered to mirror reality until at least the mid 1970’s, the landscape has changed dramatically since then. Today, most trading floors are little more than a stage for TV journalists, as virtually all exchanges have become purely electronic marketplaces.
As the three chapters of this thesis show, the widespread use of modern communications technology has had a tremendous effect on the way financial assets are traded. Electronic trading platforms allow for the design of different market mechanisms that are tailored towards different clienteles and serve different purposes. Geographically distant markets are connected via high-speed computer networks, enabling competition between market centers that have transformed from mutual enterprises into profit-maximizing corporations. More recently, the technological revolution within the financial industry has accelerated dramatically, as more and more trading is conducted via sophisticated computer algorithms, rendering human intervention superfluous.
faced by liquidity providers across trading venues. Consequently, the main (primary) market may dominate in equilibrium even if it charges higher fees than its competitors. The empirical analysis of a recent dataset of trading in French and German stocks suggests that trades on Chi-X, a recently launched low-cost trading platform, carry significantly more private information than those executed in the Primary Markets. Additionally, we present evidence that much of this difference appears to be driven by the inability of uninformed traders to choose the market they trade in. Consistent with our theory, we find a negative relationship between the competitiveness of Chi-X’s quotes and this excess adverse selection risk faced by liquidity providers in the cross-section. In conclusion, our results suggest that trade-throughs may constitute a serious obstacle to inter-market competition.
market orders.
Table of Contents
Page ACKNOWLEDGEMENTS ... V ABSTRACT ... VII RESUMEN... VII PREFACE ...IX TABLE OF CONTENTS ...XIII LIST OF FIGURES...XVII LIST OF TABLES...XIX 1. ADVERSE SELECTION, TRANSACTION FEES, AND
MULTI-MARKET TRADING ... 1
1.1. INTRODUCTION...1
1.2. THE MODEL...6
1.3. INSTITUTIONAL DETAILS AND DATA...11
1.3.A. Institutional details...11
1.3.B. Data and preliminary analysis...13
1.4. ESTIMATING DIFFERENCES IN INFORMED TRADING...17
1.4.A. Effective spread decomposition ...18
1.4.B. Hasbrouck’s structural VAR ...21
1.4.C. PIN...24
1.5. DIFFERENCES IN ADVERSE SELECTION AND CHI-X’S QUOTE COMPETITIVENESS...24
1.6. CONCLUSION...29
2. ALGORITHMIC TRADING IN A DYNAMIC LIMIT ORDER MARKET... 31
2.2. A DYNAMIC LIMIT ORDER MARKET WITH FAST ALGORITHMIC
TRADERS AND SLOW HUMAN TRADERS...35
2.2.A. The Limit Order Market...35
2.2.B. Payoffs ...38
2.3. EQUILIBRIUM...39
2.4. ORDER FLOW COMPOSITION, TRADING COSTS, AND WELFARE45 2.4.A. Order flow composition ...45
2.4.B. Gains from posting limit orders ...48
2.4.C. Costs of submitting market orders...49
2.4.D. Welfare...55
2.5. CONCLUSION...58
3. PRE-TRADE TRANSPARENCY IN CALL AUCTIONS ... 59
3.1. INTRODUCTION...59
3.2. DESCRIPTION OF THE AUCTION MECHANISMS...64
3.2.A. Euronext...64
3.2.B. Xetra...65
3.3. DATA DESCRIPTION AND SAMPLE SELECTION...66
3.4. TRADING VOLUME AND LIQUIDITY...68
3.4.A. Trading Volume ...68
3.4.B. Liquidity / Price Impact...71
3.4.C. Cross-sectional volume correlations ...72
3.5. PRICE DISCOVERY AND EFFICIENCY...74
3.5.A. Price discovery...74
3.5.B. Post-open quoted spreads ...76
3.5.C. Price efficiency...77
3.5.D. Sniping ...80
3.6. CONCLUSION...81
REFERENCES... 83
A.1. PROOF OF PROPOSITION 1 ...91
A.2. TABLES AND FIGURES...96
A.3. A TWO-MARKET PIN MODEL USING REGRESSION...108
B. APPENDICES TO CHAPTER 2 ...112
B.1. PROOFS...112
B.1.A. Proof of Proposition 1 ...112
B.1.B. Proof of Proposition 2 ...120
B.1.C. Proof of Proposition 3 ...122
B.1.D. Proof of Proposition 4 ...124
B.1.E. Proof of Proposition 5 ...128
B.2. TABLES AND FIGURES...130
C. APPENDIX TO CHAPTER 3...137
List of Figures
Page
Figure A.1 Graphical representation of the trader population for θI >θU 107
Figure B.1 Equilibrium Map...131
Figure B.2 Equilibrium Trading Rate ...132
Figure B.3 Equilibrium Trading Costs...134
Figure B.4 Welfare ...136
List of Tables
Page
Table A.1 Sample Stocks ...96
Table A.2 Sample Statistics...97
Table A.3 Quote competitiveness and market depth...98
Table A.4 The proportion of smart routers and the tie-breaking rule ...99
Table A.5 Effective spread decomposition (Chi-X vs. Primary Market Trades) ...100
Table A.6 Effective spread decomposition (Trade-Throughs vs. Non-Trade-Throughs) ...101
Table A.7 Permanent Price Impacts (Chi-X vs. Primary Market Trades) ...102
Table A.8 Permanent Price Impacts (Trade-Throughs vs. Non-Trade-Throughs) ...103
Table A.9 Correlation matrix of explanatory variables ...104
Table A.10 Cross-sectional regressions ...105
Table A.11 Cross-sectional regressions ...106
Table A.12 Imbalance Regressions ...110
Table A.13 Cross-sectional regressions ...111
Table B.1 Cutoff price orderings and associated execution probabilities....113
Table B.2 Event Probabilities ...122
Table B.3 Trading costs ...124
Table B.4 Equilibrium combinations...130
Table C.1 Matched Sample Stocks...137
Table C.2 Matched Sample Descriptive Statistics...138
Table C.3 Relative call auction trading volumes ...139
Table C.4 Call auction liquidity (Amihud Ratio)...140
Table C.5 Volume Cross Correlations...141
Table C.6 Price discovery ...142
Table C.7 Bid-ask spreads during the first hour of continuous trading...143
Table C.8 Reversal regressions...144
1. ADVERSE SELECTION, TRANSACTION FEES,
AND MULTI-MARKET TRADING
1.1. Introduction
The introduction of the Markets in Financial Instruments Directive (MiFID) in late 2007 has spawned competition among stock exchanges across Europe. Under the new legislation, alternative trading platforms (so-called Multilateral Trading Facilities, henceforth MTFs) may directly compete with the national stock exchanges (Primary Markets) for customer order flow. Ultimately, MiFID aims at creating a level playing field that promotes competition between market centers and fosters innovation.
One issue that has received a great deal of attention in the context of inter-market competition is the design of best execution policies. Under MiFID, intermediaries such as banks and brokers bear the entire responsibility for obtaining “the best possible result” for their clients’ orders. Importantly, best execution is not only based on prices but rather permits the consideration of a wide array of additional execution characteristics such as liquidity, order size, and the likelihood of execution, among others (see e.g. Petrella (2009) and Gomber and Gsell (2006) for details). Consequently, MiFID does not formally enforce inter-market price priority, and orders are permitted to execute at a price that is inferior to the best available price across venues (“trade-throughs”). This differs considerably from the rules that are in place in the United States under Reg NMS, which mandates exchanges to re-route orders to other market centers if those are offering a better price (“trade-through rule”).
financial market where trade-throughs are not prohibited. Inspired by the current market setting in Europe, we develop an extension of the Glosten and Milgrom (1985) sequential trade model where liquidity providers post quotes in two separate trading platforms, the Primary Market and a low-cost MTF. A key ingredient in our model is the existence of market access frictions. Following Foucault and Menkveld (2008), we assume that the Primary Market is accessible by all agents in the economy, while trading on the MTF requires a so-called smart order routing system that is only available to a subset of the trader population. Due to the absence of a trade-through rule, this access friction gives rise to inter-market differences in the adverse selection risk faced by liquidity providers. If informed traders are more likely than uninformed traders to be “smart routers”, situations can arise where the Primary Market offers better quotes frequently despite charging higher transaction fees.
The analysis of a recent sample of transactions and quote data for German and French stocks confirms the existence of imperfections in traders’ routing abilities, as only about every second trade originates from agents with access to Chi-X, a recently launched MTF. Moreover, we find that trades executed on this new trading platform carry significantly more private information than their counterparts on the Primary Markets, while trade-throughs are particularly uninformative. This implies that liquidity providers on the MTF incur a higher adverse selection risk precisely because an important fraction of the uninformed order flow is held captive in the Primary Markets. Cross-sectional regressions provide empirical support for our theory, as we find that this excess adverse selection risk is negatively related to Chi-X’s presence at the inside quote.
captive traders constitute a stable customer basis that is not subject to competition from other exchanges. Additionally, liquidity providers on alternative trading venues are exposed to a higher adverse selection risk because smart routers are more likely to be informed than the average trader. This excess risk frequently results in poor quotes and therefore diverts additional order flow from smart routers to the Primary Markets. Therefore, trade-throughs constitute an important obstacle for inter-market competition as the cheaper market (in terms of transaction fees) may end up with very little order flow, even from agents that have access to it. In this sense, our model supports the idea that the enforcement of inter-market price priority may foster competition between exchanges.
Our findings are in line with existing concerns about MiFID’s best execution policy. In the absence of inter-market linkages, market fragmentation increases the costs of monitoring markets in real-time, as it requires intermediaries to adopt a smart order routing system. For smaller market participants, the substantial costs associated with such an infrastructure may well exceed the expected benefits. Consistent with this view, a recent article in the Financial Times1 reports that much retail order flow is routinely routed
towards the Primary Markets as small brokers shy away from investments in technology. Additionally, Ende and Lutat (2010) document a sizeable fraction of trade-throughs in European stocks, which confirms the existence of market access imperfections post-MiFID.
Moreover, recent anecdotal evidence appears consistent with our view that a higher adverse selection risk negatively affects the competitiveness of MTFs. On September 8th, 2008, the market opening on the London Stock Exchange was delayed until 4 pm in the afternoon due to a technical problem. While Chi-X and Turquoise were still available for trading in UK
stocks, the market activity ceased almost completely during the LSE’s system outage. A similar event occurred on Euronext on April 20th, 2009, when trading commenced with a delay of one hour. Again, trading did not migrate to the MTFs. Presumably, excessive adverse selection risk lead to a market breakdown. Yet another outage on the LSE during the afternoon of November 9th, 2009 saw some trading migrate to alternative venues. The fact that the outage occurred late in the trading day may have helped the MTFs, as much of the day’s price discovery had already occurred prior to the LSE’s breakdown.
This chapter contributes to the existing literature on inter-market competition. While early theoretical papers (e.g. Pagano (1989) and Chowhdry and Nanda (1991)) argue that markets display a natural tendency to consolidate as a consequence of liquidity externalities, there is a large empirical literature that empirically documents the existence of fragmented financial markets (e.g. Bessembinder (2003), Boehmer and Boehmer (2003), Goldstein et al. (2008), Biais et al. (2010a)).
Naturally, our work is also closely related to a number of papers that study differences in informed trading across markets. One strand of this literature analyzes the effects of “cream-skimming” and payment for order flow (e.g. Easley et al. (1996a), Bessembinder and Kaufman (1997), Battalio et al. (2002), Parlour and Rajan (2003)). In our context, the competitiveness of alternative trading platforms is hampered by the concentration of uninformed order flow on the Primary Markets due to trade-throughs generated by captive traders. This contrasts strongly with the standard paradigm within this literature, where uninformed order flow is directed away from the main market center due to so-called preferencing agreements2.
Other papers (e.g. Grammig et al. (2001), Barclay et al. (2003), Goldstein et al. (2008)) document differences in informed trading between dealer markets and anonymous electronic trading systems. Generally, these studies find order flow in electronic markets to be more informative, presumably because informed traders value the higher speed of execution offered by these venues and try to prevent information leakage due to interacting with intermediaries such as market makers. In contrast, we show that differences in informed trading across exchanges may also arise through the absence of inter-market price priority paired with frictions in traders’ market access.
Finally, our model also accommodates the results of Hengelbrock and Theissen (2009), who study the market entry of the Turquoise MTF in late 2008 and find that the trading activity in larger and less volatile stocks tends to fragment more.
This chapter is organized as follows. Section 1.2 introduces our theoretical model, while Section 1.3 describes the institutional environment and
2Preferencing agreements usually establish a relation between a broker and a trading
presents the data. Section 1.4 introduces estimates for differences in informed trading between the Primary Markets and Chi-X, and Section 1.5 presents evidence on the model’s empirical implication. Section 1.6 concludes, while proofs and tables are relegated to Appendix A.
1.2. The Model
There is a single risky asset with liquidation value V∈
{ }
V V, , where we set0
Pr(V V= )≡δ =1/ 2 for simplicity. The asset can be traded on two separate trading platforms, which we denote by C(hi-X) and P(rimary Market). These markets are populated by NP ≥2 and NC ≥2 identical, risk neutral market makers, respectively, who post bid and ask quotes for a single unit of the risky asset. Market P charges a cost c >0 per trade to market makers, while the cost charged by market C is normalized to zero. We assume that c is very small in comparison to the asset’s fundamental
uncertainty, i.e.c <<(V V− )/ 2.
There is a continuum of traders, who arrive sequentially at time points 1, , T
The overall proportion of smart routers is given by θ µθ= I + −(1 µ θ) U. Let
SR
µ and µCTdenote the proportion of informed traders among smart routers and captive traders, respectively, which are given by
(1 )
1 I I
SR θ µ CT θ µ
µ µ
θ θ
−
≡ ≡
−
It is easy to see that θI >θU (θI <θU) implies µSR > >µ µCT
(µSR < <µ µCT).
[Insert Figure A.1 about here]
Uninformed traders buy or sell with equal probability. Informed traders buy
if V V= and the best ask at which they can trade is less or equal to V at the time of their arrival, and sell if V V= and the best available bid is
higher or equal to V. Otherwise, they do not trade. Traders always choose to trade in the market that offers the better price given their trading interest and market access.
Assumption (Tie-breaking rule):
In the case of an inter-market tie, smart routers always trade in market C.
On the other hand, if several market makers post the same price in the same market, we assume that one of them is randomly selected (with equal probability) as a trading partner for the incoming trader. After each trading round t, market makers update their beliefs about the probability of the high outcome of the asset’s liquidation value using Bayes’ rule and revise their quotes accordingly. We assume that they observe each other’s trades3, which
implies that they hold identical beliefs about the liquidation value at all times. Let δt−1 denote this common belief prior to the arrival of the t-th trader.
For simplicity, we restrict our analysis to the bid side. Results for the ask side can be derived following exactly the same logic. Let i P,
t
b and j C, t
b the quotes of market makers i and j in markets P and C, respectively, where
1, , P
i= … N and j = …1, ,NC. Moreover, define the best bid in market k
as k max
{
1,k,..., N kk,}
t t t
b = b b fork∈
{ }
P C, .Given that captive traders can only trade in the Primary Market, the probability of a sell occurring in market P is always strictly positive. On the other hand, trade may only occur in market C if the bid quote at least matches the bid prevailing in market P. This leads us to the following definition of market co-existence.
Definition (Market co-existence):
Markets co-exist if and only if btC ≥btP.
3 This can be interpreted as markets being subject to post-trade transparency. See
We are now ready to state our main result, which provides a condition for market co-existence to obtain in equilibrium. We restrict our attention to symmetric equilibria in pure strategies.
Proposition 1:
Let NP→∞. Then, in equilibrium, markets co-exist if and only if
1
( )( SR ) ( )
B t
c ≥ V V− µ − Ψµ δ− (1.1)
where
[
]
1 1
1
1 1
2 (1 )
( )
1 (1 2 ) 1 (1 2 )
t t
B t SR
t t
δ δ
δ
µ δ µ δ
− −
−
− −
−
Ψ =
+ − + −
Proof:
See Appendix A.1.
To understand the intuition behind this result, first consider the case where
I U
θ ≤θ . This implies that µSR ≤µ, i.e. the proportion of informed traders among smart routers is no greater than the proportion of informed traders in the overall trader population, such that market makers on platform C face a (weakly) lower adverse risk. Additionally, market C does not charge any transaction fees, so that the best bid on Chi-X is always strictly higher than the best bid in the Primary Market. In this case, condition (1.1) is necessarily satisfied as the right-hand side is always negative, such that markets co-exist.
Now consider the converse situation, where θI >θU, or equivalently SR
the Primary Market if the fee savings compensate for the excess adverse selection risk. The function ΨB(δt−1) captures the behaviour of the adverse selection differential over time: As the order flow is informative about the asset’s liquidation value, market makers’ beliefs δt−1 converge to either zero
or one as the number of trading rounds becomes large, such that ΨB(δt−1) approaches zero. As the adverse selection risk diminishes, differences in quotes across markets are entirely determined by the difference in transaction fees, and the market co-existence condition is necessarily satisfied.
Proposition 1 has an empirical implication for Chi-X’s quote competitiveness in the cross-section. In order to see this, define ∆AS=maxδt−1∆AS(δt−1),
where ( 1) ( )( SR ) ( 1)
t B t
AS δ− V V µ µ δ−
∆ = − − Ψ . Now consider two assets, A
and B, and suppose that ∆ASA(δt−1)> ∆ASB(δt−1) for all market maker
beliefs δt−1, i.e. the cross-market adverse selection differential (Chi-X minus
Primary Market) is always strictly greater for asset A. If c ≥ ∆ASA, the market co-existence condition (1.1) is satisfied for all possible beliefs and the best bid on Chi-X will match or improve upon the best bid in the Primary Market throughout the entire trading day for both assets. On the other hand, condition (1.1) is not always satisfied if c< ∆ASA. Moreover, as
1 1
( ) ( )
A t B t
AS δ − AS δ−
∆ > ∆ for all δt−1, there exist beliefs for which Chi-X
matches or improves on the Primary Market for asset B, while the Primary Market displays a strictly better quote for asset A. The converse never holds. This leads us to the following empirical prediction.
Corollary 1:
1.3. Institutional details and data
In the remainder of the chapter, we empirically analyze a sample of transaction data from Chi-X and two Primary Markets, Euronext (Paris) and Xetra (Frankfurt), in order to validate the empirical prediction of our model (Corollary 1). Before we turn to the description and a preliminary analysis of our dataset, we provide a brief overview of the institutional details that pertain to our sample period (May – April 2008).
1.3.A. Institutional details
Chi-X was launched on March 30th, 2007, when it started to offer trading in German and Dutch blue chips. Later the same year, trading was extended to the largest British (June 29th), French (September 28th), and Swiss (November 23rd) equities. Several other European markets were added subsequently, and starting in late 2008, the spectrum of available stocks was extended to mid-caps. As of November 2010, almost 1,400 stocks from 15 European countries could be traded on Chi-X. According to Fidessa4,
Chi-X’s market share during the first six months of 2010 exceeded 20% for Belgian, Dutch, French, German, and British blue chips.
Like virtually all European stock markets, Chi-X is organized as a continuous, fully electronic limit order market (LOM). During trading hours, participants can continuously submit, revise and cancel limit and market orders. Non-executed limit orders are stored in the limit order book, and incoming market orders execute against those. Trading is fully anonymous, both pre- and post-trade.
Chi-X offers a very simple fee structure, which is asymmetric (a so-called make/take fee scheme): Passive executions (limit orders) receive a rebate of 0.2 bps, while aggressive executions (market orders) are charged 0.3 bps. Therefore, the platforms overall revenue per trade amounts to 0.1 bps. In the US market, these make/take fee schemes have proven key to success for the ECNs.
As opposed to Chi-X, the Primary Markets under consideration in this chapter (Euronext Paris and Deutsche Boerse’s Xetra) do not distinguish between active and passive executions, i.e. their fee structures are symmetric. Euronext charges €1.20 plus 0.055 bps per executed order, which amounts to 0.455 bps for an average trade size of ~€30,000 (see Table A.2). Xetra charges 0.552 bps per trade (subject to a minimum charge of €0.69 with a cap at €20.70), which is somewhat more expensive for the average trade size but cheaper for smaller trades. Both exchanges offer different rebate schemes for particularly active members subject to minimum activity charges. Overall, the transaction fees in both Primary Markets are relatively similar and significantly exceed those on Chi-X, particularly for orders providing liquidity5.
Besides charging considerably lower fees, Chi-X distinguishes itself from the Primary Markets in several other aspects. Most prominently, the MTF specifically targets high frequency traders via an ultra-low system latency, which according to the platform6 is “up to ten times faster than the fastest
European primary exchange”. Moreover, Chi-X offers a wider range of admissible order types such as hidden and pegged orders. While the first
5 Both Xetra and Euronext have designated market makers that are committed to
maintain a minimum spread and a certain depth for individual stocks. Those market participants are usually exempt from transaction fees.
6
order type is completely invisible until executed7, the latter type is a limit
order where the limit price is “pegged” to a reference price, e.g. the best bid in the Primary Market, and is updated continuously. Finally, at the time of our sample (April-May 2008), Chi-X facilitated the undercutting of Primary Markets’ quotes by offering a lower tick size for most securities. The entry of additional MTFs triggered a race for lower tick sizes in early 2009, which was ended with an agreement brokered by the Federation of European Securities Exchanges (FESE), after which the MTFs adopted the tick sizes used by the respective Primary Market.
While Chi-X only offers trading in a continuous LOM, both Xetra and Euronext additionally hold call auctions to set the opening and closing prices. Xetra also has an intraday call auction at 13:00 CET, which nevertheless generates only negligible trading volume except on days where derivative contracts expire (see Hoffman and van Bommel (2010)). Moreover, unlike Chi-X, the Primary Markets have a fixed set of rules that triggers an automatic call auction in times of extreme price movements (so-called volatility interruptions).
1.3.B. Data and preliminary analysis
Chi-X Ltd. generously provided us with a very detailed dataset for the months of April and May 2008, comprising a total of 43 trading days. The data contains information on the entire order traffic generated during this period, listing limit order additions, cancellations/modifications as well as trades separately. Timestamps are rounded to the nearest millisecond. From this data, we reconstruct the entire limit order book as well as the best bid and offer (BBO) at each point in time. Data for trades and quotes of French and German stocks on their respective Primary Markets (Euronext and
Xetra) during the corresponding time period was obtained from Reuters. Again, timestamps are rounded to the nearest millisecond. While the Chi-X data always contains a qualifier that tells us whether a market order was a buy or a sell, we sign trades on the Primary Markets using the Lee and Ready (1991) algorithm. As opposed to trades in a dealer market such as the NYSE, the risk of order misclassification is very small in a pure limit order book. Merging the BBO data from Chi-X and the Primary Markets, we obtain the European Best Bid and Offer (EBBO). We restrict our analysis to the continuous trading phase, which spans the time between 9:00 and 17:30 CET.
At the time of our sample, Chi-X was the only existing MTF and only offered trading in blue chips, such that our analysis is limited to the constituents of the CAC40 and DAX30 indices. We drop three French stocks (Arcelor, EADS and Dexia) from our sample as they are simultaneously traded on other European markets (Amsterdam, Frankfurt, and Brussels, respectively), such that our final sample comprises of 67 stocks.
[Insert Table A.1 and Table A.2 about here]
to execute on the MTF due to the Primary Markets’ minimum fixed fees per order (see Section 1.3.A).
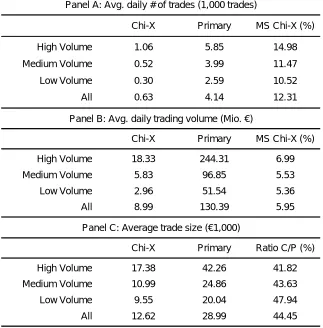
We also report the results for terciles based on stocks’ average trading volume. Chi-X has a considerably larger market share (both in terms of trades and traded value) for the most active stocks, which is consistent with the evidence presented in Hengelbrock and Theissen (2009) for the Turquoise MTF.
Panel A of Table A.3 contains statistics about the quality of Chi-X’s quotes. The MTF is frequently present at the EBBO (around 49% for either bid or ask), and often even improves on the Primary Markets’ quotes (ca. 26% for bid or ask). Nevertheless, the frequency with which the MTF is simultaneously present at both sides of the inside quote (alone) is considerably lower with approximately 24% (7%), indicating that the activity on Chi-X is often restricted to one side of the market. While the Primary Markets are naturally present at the inside quote more often, they frequently face competition for at least one side of the market as they only spend roughly 26% of the time alone at the EBBO. Investigating the individual terciles, one can see that the MTF’s quote competitiveness is somewhat higher for more active stocks, which is in line with the higher market shares in those stocks.
[Insert Table A.3 about here]
Based on its presence at the best quotes, Chi-X’s market share (in terms of trades or trading volume) seems strikingly low. This is consistent with the market access friction in our model, which forces captive traders to trade in the Primary Market irrespectively of the quotes prevailing elsewhere. In order to quantify this friction, we follow Foucault and Menkveld (2008), who suggest estimating the proportion of smart routers (θ) by the percentage of trades being executed on Chi-X conditional on the Primary Market offering a strictly worse quote. We additionally require that the depth on the MTF is sufficient to get the order filled entirely because it is natural to assume that traders take quantities into account when deciding on where to route their orders. Given that Chi-X offers a considerably lower market depth on average, some agents may avoid splitting up their orders and therefore prefer the Primary Market. This will particularly be the case if the marginally better price on the MTF is only available for a small fraction of the total order size.
The results in Table A.4 (first column) strongly confirm the importance of imperfect order routing. Conditional on Chi-X offering a better quote with sufficient depth, every second order is still executed in the Primary Market, such that the proportion of smart routers is roughly 50%. Interestingly, the routing friction varies little across the different activity terciles, which is in contrast to the results in Foucault and Menkveld (2008), who report a marked drop in smart order routing once moving beyond the most active stocks.
[Insert Table A.4 about here]
Primary Market conditional on equal quotes across venues and sufficient depth on Chi-X to fill the order completely is equal to
(1 )
π = − +θ θτ
where θ is the proportion of smart routers and τ denotes the parameter of the tie-breaking rule. This equation simply states that all captive traders plus a fraction τ of the smart routers will trade on the Primary Market in the case of a tie, while the remaining agents trade on Chi-X. The last two columns of Table A.4 contain the estimates for the proportion of trades executing in the Primary Market under an inter-market tie (π ) and the tie-breaking rule (τ ) for the entire sample as well as the individual terciles. We find that our assumption regarding the tie-breaking rule in Section 1.2 is clearly confirmed, as we cannot reject the null hypothesis that τ is equal to zero, indicating that smart routers always choose to trade on Chi-X if it at least matches the quotes in the Primary Market. Given that Chi-X charges lower fees for market orders (except for very large orders), this result is not very surprising.
1.4. Estimating differences in informed trading
1.4.A. Effective spread decomposition
One of the most widely used measures for the assessment of trading costs is the percentage effective half-spread, which is defined as
t t
t t
t
p m
ES q
m
−
= (1.2)
whereptdenotes the transaction price at time t, mtis the contemporaneously
prevailing EBBO mid-quote, and qt is a trade direction indicator that takes the value of 1 for buys and -1 for sells. Compared to the quoted spread, this measure has the advantage that it measures trading costs only at the actual time of a trade, taking into account that liquidity demanders will attempt to time the market and trade when the bid-ask spread is relatively narrow.
Besides its simplicity, this measure has the additional advantage that it can be decomposed into an adverse selection (price impact) component
t t t
t t
t
m m
AS q
m
+∆ −
= (1.3)
and an order processing component, usually termed realized half-spread
t t t
t t
t
p m
RS q
m
+∆ −
= (1.4)
where mt+∆t is the mid-quote ∆t minutes after the transaction, the time at which the market maker is assumed to cover her position. While these measures constitute extreme simplifications of reality (e.g. trades between t and t + ∆t are ignored), they have become a benchmark for assessing trading costs. Moreover, this spread decomposition also allows us to compare market maker revenues before transaction fees across markets through the realized spread.
terciles. Given that even the least active stocks in our sample have a considerable trading volume, this procedure delivers relatively conservative standard errors. Moreover, trade-weighted statistics would bias the results in favour of Chi-X, as it has a larger market share in the most active stocks, which generally exhibit lower effective spreads. In all calculations, we exclude trades that occur when the market is locked or crossed, i.e. when the EBBO spread is non-positive (see Shkilko et al. (2008)). Nevertheless, including these observations does not alter the results qualitatively.
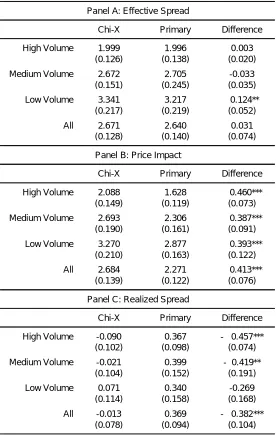
The results are listed in Table A.5. Overall, trading on Chi-X is not cheaper before fees: Across all stocks and days, the effective spread on Chi-X averages 2.67 bps, compared to 2.64 bps in the Primary Market (Panel A). The difference of 0.03 bps is very small in economic terms (roughly 1%) and statistically insignificant. Given that Chi-X charges lower fees for market orders (except for very large trade sizes, see Section 1.3.A), the difference in effective spreads can be expected to be slightly negative net of fees. Exact calculations are not possible because participants in the Primary Markets may be granted rebates depending on their trading activity. Overall, the results suggest that trading on Chi-X is at most marginally cheaper than on the Primary Markets net of fees.
[Insert Table A.5 about here]
Nevertheless, a look at the spread decomposition8 (Panels B and C) reveals
important differences between both markets. Chi-X displays a significantly larger adverse selection component (2.68 bps compared to 2.27 bps), but markedly lower realized spreads (-0.01 bps vs. 0.37 bps). Importantly, the differences are both statistically and economically very significant. Liquidity
8 We set ∆t = 5 minutes. Setting the interval to 15 or 30 minutes delivers
providers on Chi-X are exposed to a much greater adverse selection risk, while their gross revenues are essentially equal to zero. Nevertheless, as Chi-X grants a 0.2 bps rebate per executed limit orders, they still net a small profit after fees. Given that liquidity providers on the Primary Markets face a positive transaction fee9, market makers’ revenues appear to be very similar
across markets. Additionally, the fact that revenues from liquidity provision are very close to zero indicates a very competitive market.
Overall, the effective spread decomposition clearly suggests that liquidity providers on Chi-X face a higher adverse selection risk. This result appears very robust as it holds across all activity terciles, and we observe a higher price impact on Chi-X for all but three stocks10 (these negative differences
are not statistically different from zero). Moreover, the realized spreads nicely illustrate that the liquidity rebate on the MTF helps market makers to sustain this excess risk.
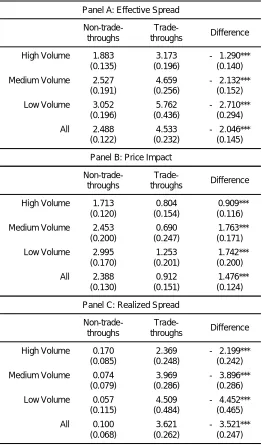
In our model, cross-market differences in adverse selection risk arise because the proportion of informed traders differs between smart routers and captive traders. While a higher price impact for orders executed on Chi-X indicates that smart routers are more likely than captive traders to be informed (θI >θUor equivalentlyµSR >µ), it also implies that we should observe a lower price impact for trade-throughs, as those stem exclusively from less informed captive traders (µCT <µ). In order to verify this, we separate the Primary Market trades into trade-throughs and non-trade-throughs and calculate the effective spread decomposition for both types of transactions.
[Insert Table A.6 about here]
9Except for designated market makers.
The results in Table A.6 strongly confirm that trades violating inter-market price priority are more likely to stem from uninformed traders than transactions that occur while the Primary Market is at the inside quote. The estimated average price impact of a trade-through is 0.91 bps, which is less than half of the 2.39 bps price impact of non-trade-throughs. Naturally, trade-throughs display a significantly larger effective spread (4.53 bps), as they leave money on the table by trading through a better available quote. Paired with the lower price impact, this boosts the realized spread (3.62 bps), which is pocketed by the market maker. Overall, these results indicate that the observed excess adverse selection risk on Chi-X is driven by the absence of mainly uninformed captive traders.
1.4.B. Hasbrouck’s structural VAR
In a seminal contribution, Hasbrouck (1991) suggests a structural VAR model to estimate the permanent price impact of a trade. Since then, this measure has emerged as one of the most frequently employed procedures in the empirical market microstructure literature. The basic idea behind Hasbrouck’s model is that there exists a dynamic linear relationship between price (quote) changes and trades, where current trades have an impact on current and future price changes, while current price changes can only trigger future trades. In our context, the model can be written as
1 0 0
K K K
P C r
t i t i i t i i t i t
i i i
r a r− b x − c x − ε
= = =
=
∑
+∑
+∑
+ (1.5)1 1 1
K K K
P P C P
t i t i i t i i t i t
i i i
x d r− e x− f x− ε
= = =
=
∑
+∑
+∑
+ (1.6)1 1 1
K K K
C P C C
t i t i i t i i t i t
i i i
x g r− h x − i x− ε
= = =
where rt denotes log changes in the EBBO mid-quote and the xtk,
{ }
,k∈ P C are discrete variables that take the value of 1 for a buy, -1 for a
sell, and 0 otherwise. As detailed by Hasbrouck (1991), the discrete nature of the k
t
x does not constitute any obstacle for the structural VAR. We estimate the model in tick time, such that trades across markets are necessarily uncorrelated11, and truncate the VAR after 10 lags12. At the beginning of
each trading day, all lags are set to zero. To judge the long-term (permanent) price impact of a trade, the VAR is inverted to obtain the VMA representation ( ) ( ) ( ) ( ) ( ) ( ) ( ) ( ) ( ) r t t P P t t C C t t
r A L B L C L
x D L E L F L
x G L H L I L
ε ε ε = (1.8)
where A(L) – I(L) are lag polynomials. This is the impulse response function, and the long-term price responses to an unexpected trade in either market
are given by the coefficient sums
0 P
i i
PI ∞ B
=
=
∑
and0 C
i i
PI ∞ C
=
=
∑
.[Insert Table A.7 about here]
Table A.7 contains the permanent price impacts for both markets (impulse responses are truncated after 20 periods), where we again report stock-day averages for the entire sample and the activity terciles. The results are in line with those from the effective spread decomposition. On average, the permanent price impact of a trade on Chi-X amounts to 1.86 bps, compared to 1.61 bps for Primary Market trades. The difference is statistically significant at the 1% level. As in the previous section, we observe a higher
11 Estimating the model with data aggregated to 5-second intervals delivers qualitatively similar results but requires placing upper and lower bounds on a venue’s price impact as the order flows are no longer uncorrelated.
price impact on Chi-X for each activity tercile, which underlines the robustness of our findings. For individual stocks, we find a higher price impact for Primary market trades in only 6 cases, and none of these differences are statistically significant13. Overall, these results provide further
evidence for liquidity providers facing a higher adverse selection risk on Chi-X.
In order to check whether the difference in adverse selection across markets is indeed due to captive traders being mainly uninformed, we modify the VAR from equations (1.5) – (1.7) and split the Primary Market order flow into trade-throughs and non-trade-throughs. This results in the following VAR system
, ,
,
1 0 0 0
K K K K
P NTT P TT C
t i t i i t i i t i i t i r t
i i i i
r a r− b x − c x − d x− ε
= = = =
=
∑
+∑
+∑
+∑
+ (1.9), , ,
,
1 1 1 1
K K K K
P NTT P NTT P TT C
t i t i i t i i t i i t i NTT t
i i i i
x e r− f x− g x− h x − ε
= = = =
=
∑
+∑
+∑
+∑
+ (1.10), , ,
,
1 1 1 1
K K K K
P TT P NTT P TT C
t i t i i t i i t i i t i TT t
i i i i
x i r− j x− k x− l x− ε
= = = =
=
∑
+∑
+∑
+∑
+ (1.11), ,
,
1 1 1 1
K K K K
C P NTT P TT C
t i t i i t i i t i i t i C t
i i i i
x m r− n x− o x − p x − ε
= = = =
=
∑
+∑
+∑
+∑
+ (1.12)where P TT, t i
x− and P NTT, t i
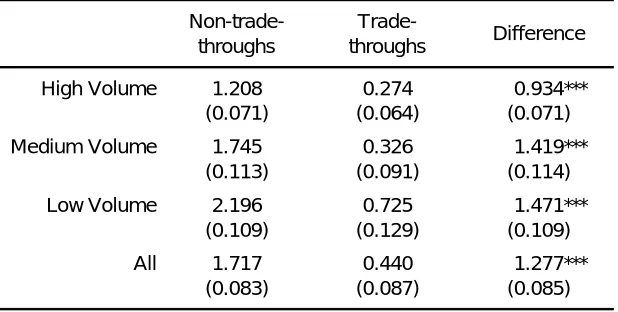
x− refer to Primary Market order flow due to trade-throughs and non-trade-trade-throughs, respectively. Table A.8 reports the permanent price impacts obtained from the corresponding VMA representation. The results are qualitatively similar to those obtained from the effective spread decomposition. The permanent price impact of a trade-through is 0.44 bps, which is significantly lower than 1.72 bps impact of a non-trade-through, with a t-statistic of around 15. This supports the view that market makers on Chi-X face a higher adverse selection risk precisely
13The results for individual stocks, which we do not report for brevity, are available
because their quotes are not exposed to the relatively uninformed captive traders.
[Insert Table A.8 about here]
1.4.C. PIN
Given our theoretical framework, the PIN model by Easley et al. (1996b) is a natural choice for assessing differences in informed trading between Chi-X and the Primary Markets. Nevertheless, a number of recent papers (e.g. Duarte and Young (2009) and Aktas et al. (2007)) have cast doubt on the model’s ability to capture the presence of informed traders. Moreover, it is well-known that the PIN model is subject to numerical problems, particularly for stocks with high trading activity (see e.g. Yan and Zhang (2010) and Easley et al. (2010)). In our case, these problems are additionally amplified by the relatively short sample (43 trading days) and the need to estimate additional parameters for a two-market PIN model as in Easley et al. (1996a) or Grammig et al. (2001). Consequently, we find that the numerical maximization of the likelihood function is not successful for most stocks in our sample. In Appendix A.3, we provide an alternative method for estimating differences in informed trading between two markets via the PIN model and present the associated results.
1.5. Differences in adverse selection and
Chi-X’s quote competitiveness
Proposition 1 in Section 1.2 that in this case, liquidity providers on Chi-X are only able to match the primary market’s quotes if their cost advantage from transaction fees (c) exceeds the excess adverse selection risk they face.
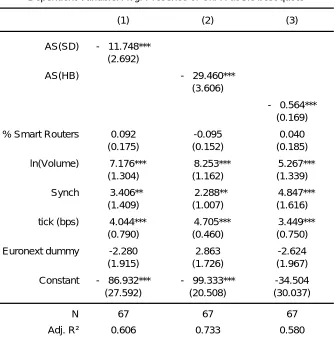
In order to validate our model empirically, we adopt a cross-sectional perspective. According to Corollary 1, Chi-X’s presence at the inside quote is expected to decrease (weakly) in the adverse selection risk differential. As the empirical evidence suggests that the adverse selection risk differential is positive for almost all stocks, we actually expect to observe a strictly negative relationship.
We begin by calculating, for each stock, the fraction of time during which Chi-X is present at the EBBO, taking the average of both sides of the market14. We then regress this measure of Chi-X’s quote competitiveness on
measures that capture the difference in adverse selection across trading venues and additional control variables, i.e. we estimate the cross-sectional regression
[ ]
0 1
_ _ i 1Euronext ( i) i i
Chi at best =α +α + ∆γ AS +φ′X +ε (1.13)
where 1[Euronext] is an indicator variable that takes the value of 1 if the stock is
listed on Euronext and 0 otherwise, ∆ASi denotes the excess adverse
selection risk on Chi-X for stock i, and Xi is a vector of control variables.
We employ three different variables in order to quantify the excess adverse selection risk on Chi-X. The first two are the stock-specific cross-market differences of the price impact measures from Sections 1.4.A and 1.4.B, denoted SD
i AS
∆ and HB
i AS
∆ , respectively. For the third variable, we ignore any cross-sectional variation in the proportion of informed traders and
14 Considering only one side of the market (either bid or ask) delivers qualitatively
simply proxy (µSR−µ)(V V− ) by i
σ , which denotes annualized return volatility based on closing prices for the calendar year prior to our sample period. Table A.9 contains the cross-sectional correlation matrix of our three explanatory variables. Unsurprisingly, we find a strong cross-sectional correlation of 0.63 between SD
i AS
∆ and HB
i AS
∆ . More interestingly, both measures are highly correlated with stock price volatility (between 0.42 and 0.45), which indicates that all three variables are picking up similar effects.
[Insert Table A.9 about here]
We include a number of control variables that we expect to influence Chi-X’s presence at the best quote.
While we have not incorporated the effect of tick sizes in our model for tractability reasons, it is known that a discrete pricing grid leads to rounding errors and therefore artificially inflates the bid-ask spread (see e.g. Harris (1994)). As a consequence, we expect Chi-X’s quote competitiveness to increase in the tick size differential15, which we define as the average16
difference in tick sizes (Primary market minus Chi-X) for stock i scaled by the stock’s average transaction price. We furthermore include the proportion of smart routers as a control variable in order to disentangle our story from that of Foucault and Menkveld (2008). Additionally, we also control for the log of trading volume and a stock’s return synchronicity (based on the
15For some stocks, the difference in tick sizes is considerable. For example, during
most of the sample, the tick size for Infineon is €0.01 on Xetra, compared to €0.001 on Chi-X. Given the stock’s low price level (below €10), the bid-ask spread on the Primary Market is frequently equal to the tick size. Consequently, Chi-X is particularly attractive for trading in this stock as it allows the placement of orders within the primary quotes. A few days before the end of the sample period, Deutsche Börse reduced the tick size to €0.005.
16A total of 9 stocks experience a change in tick sizes during our sample period, all
Square of a market model regression17). While trading volume is simply a
variable outside our model, the results in Hengelbrock and Theissen (2009) suggest that trading in more active stocks has a higher tendency to fragment. Return synchronicity may capture effects of algorithmic traders, which often engage in index arbitrage trades and have been shown to be particularly quick in reacting to “hard” information (Jovanovic and Menkveld (2010)).
[Insert Table A.10 about here]
The coefficient estimates are listed in Table A.10. As predicted by our model, the results indicate that an increase in the adverse selection risk differential is associated with Chi-X being less frequently at the inside quote. The coefficients on SD
i AS
∆ , HB
i AS
∆ and σi are all negative and strongly significant (t-statistics ranging from 3.3 to 8.2). Importantly, the observed effects are also economically important. For example, a one standard deviation increase in SD
i AS
∆ (~0.37 bps) is associated with a decrease of around 4.35% in Chi-X’s presence at the inside quote. The other variables have marginal effects of similar magnitude (7.07% and 3.95% for HB
i AS
∆
and σi, respectively).
All control variables carry the expected sign. Particularly the difference in tick sizes across venues plays an important role for Chi-X’s quote competitiveness. Increasing the tick size differential by one standard deviation (~2.2 bps) leads Chi-X’s presence at the best quote to increase by 7-11%, depending on the specification. Different from Foucault and Menkveld (2008), we find that the proportion of smart routers is not significantly related to Chi-X’s quote competitiveness. This is likely due to
17We use the transformationSYNCH=ln(R2/(1−R2)), see e.g. Teoh et al. (2009).
the fact that exchanges do not charge any fees for order submission, which is an important feature of their model and data. For the other control variables, we find that both higher trading volume and higher return synchronicity are associated with Chi-X being at the inside quote more frequently. Finally, there is some weak evidence for Chi-X offering worse quotes in stocks listed on Euronext. This may be due to the staggered entry of the MTF across countries. While Chi-X entered the German market roughly one year before the start of our sample period, it did not offer trading in French stocks until half a year later.
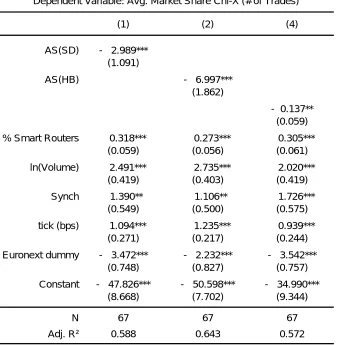
While our theoretical model is strictly speaking about quotes, it has very similar implications regarding Chi-X’s actual market share. Given a fixed number of trading rounds, a higher excess adverse selection risk leads to less trade on Chi-X after controlling for the proportion of smart routers. We therefore re-estimate equation (1.13), but replace Chi-X’s presence at the best quote with the MTF’s market share in terms of trades. The results (Table A.11) are very similar than the results for quotes. All variables capturing the adverse selection risk differential are negative and statistically significant. Again, the economic effects are substantial. For example, a one standard deviation increase in SD
i AS
∆ is associated with an increase of 1.10% in Chi-X’s market share. Unsurprisingly, the explanatory effect of the proportion of smart routers is strongly significant. The coefficients on the remaining control variables are, by and large, similar to the results using Chi-X’s presence at the inside quote.
[Insert Table A.11 about here]
1.6. Conclusion
Motivated by the current regulatory framework in Europe set forth under MiFID, we analyze how adverse selection risk and transaction fees interact in a fragmented financial market where trade-throughs are not prohibited. We argue that liquidity providers on alternative trading platforms will be subject to an increased adverse selection risk if informed traders are more likely to have access to this market via a smart order routing system. Consequently, the Primary Market will dominate (display better quotes) most of the trading day despite charging higher transaction fees. We formalize this argument with an extension of the Glosten and Milgrom (1985) sequential trade model.
The analysis of a recent sample of transactions and quote data for German and French stocks reveals that liquidity providers on Chi-X (a recently launched trading platform) face a significantly greater adverse selection risk. Moreover, trade-throughs that execute “by default” in the Primary Markets are particularly uninformed. In line with our theoretical model, we find a negative relationship between the excess adverse selection risk and Chi-X’s presence at the inside quote. Moreover, our view is additionally supported by anecdotal evidence from Primary Market outages.
Our findings have some implications for the design of best execution policies. Allowing for trade-throughs favors the Primary Markets by ensuring that the least informative order flow does not reach the MTFs, thereby hampering liquidity provision on these platforms due to an increased adverse selection risk. Our findings suggest that protecting orders from trade-throughs in the spirit of RegNMS may foster competition between trading venues as it helps to level the playing field.
technologies as given. This choice follows from noise traders’ willingness to trade at any price and the assumption that agents do not have the chance to trade multiple times. Clearly, a more realistic model would aim to determine these variables endogenously.
2. ALGORITHMIC TRADING IN A DYNAMIC LIMIT
ORDER MARKET
2.1. Introduction
In recent years, the number of financial market transactions taking place without any human intervention has increased dramatically. Recent estimates suggest that algorithmic trading now accounts for more than 70% of the volume traded in US equity markets18. Many of these computer-driven
trading strategies, generally dubbed as high-frequency trading, rely on the execution of a vast number trades within a very short time, spurring an arms race within the financial industry for the most sophisticated technology in an effort to be faster than the competition.
The rise of algorithmic trading is being accompanied by a heated debate among financial economists, practitioners, and regulators about the pros and cons of the increasing computerization of the trading process. While proponents argue that technology increases market efficiency via improved liquidity19, critiques claim that high-frequency traders (HFT) make profits at
the expense of other market participants and have the potential to destabilize markets20.
This chapter contributes to this debate by presenting a model of trading in a limit order market with two types of agents, fast algorithmic traders (ATs) and slow human traders (HTs). While limit orders potentially enable traders to lower their execution costs by earning instead of paying the bid-ask
18 See Financial Times, “High-frequency trading under scrutiny”, July 28th, 2009. 19 See e.g. Optiver, “High Frequency Trading”, Position Paper, 2011,
http://fragmentation.fidessa.com/wp-content/uploads/High-Frequency-Trading-Optiver-Position-Paper.pdf
20 See SEC Chairman Mary Schapiro's speech in front of the Security Traders
spread, they may become stale upon the arrival of new information unless being updated or cancelled in a timely fashion (Copeland and Galai (1983)). Consequently, the use of sophisticated computer programs that enable the continuous monitoring and updating of limit orders may reduce this risk of being “picked off” substantially.
In order to model such usage of automated trading in a tractable way, we propose an extension of Foucault’s (1999) dynamic limit order market. In the original model, traders face the mentioned risk of being picked off in the case of adverse price movements (also called the winner’s curse), as they are not able to cancel or revise their limit orders. We classify these agents as HTs and introduce a new type of trader, ATs. While the use of cutting edge IT technology facilitates the monitoring of limit orders and allows for fast reactions to changing market conditions, it only constitutes an advantage over those market participants that do not have this technology. In other words, ATs exert a negative externality on each other. To capture this idea in the most parsimonious way, we assume that ATs may revise/cancel their limit orders after the arrival of new public information, but only in case the next arriving agent is a HT. We analyze the equilibrium in this dynamic limit order market and compare it to the baseline case without ATs studied by Foucault (1999). Our findings are as follows.