Spatial, temporal and size distribution of particulate matter and its chemical
constituents in Faisalabad, Pakistan
WASIM JAVED
Mechanical Engineering, Texas A&M University at Qatar, Doha, Qatar;
Institute of Soil and Environmental Sciences, University of Agriculture, Faisalabad, Pakistan Corresponding author; e-mail: [email protected]
ANTHONY S. WEXLER
Air Quality Research Center, University of California-Davis, CA, USA
GHULAM MURTAZA and HAMAAD R. AHMAD
Institute of Soil and Environmental Sciences, University of Agriculture, Faisalabad, Pakistan
SHAHZAD M. A. BASRA
Department of Crop Physiology, University of Agriculture, Faisalabad-38040, Pakistan
Received May 25, 2014; accepted February 6, 2015
RESUMEN
Se investigaron las variaciones espaciales y temporales de aerosoles de material particulado (PM, por sus siglas en inglés) en Faisalabad, Pakistán, de junio de 2012 a abril de 2013 para conocer la distribución de componentes químicos y fracciones granulométricas en todas las estaciones del año. Se controlaron cuatro fracciones de PM (partículas totales en suspensión [TSP, por sus siglas en inglés], PM10, PM4 y PM2.5) en
utilizando un dispositivo de alto volumen para toma de muestras de aire. Las muestras de TSP (144) se sometieron a un análisis químico cuantitativo para determinar la presencia de elementos traza (Pb, Cd, Ni, Zn, Cu, Fe) mediante espectroscopia de absorción atómica, así como de cationes solubles en agua (Ca2+,
Mg2+, Na+, K+, NH
4+) y aniones (Cl–, SO42– y NO3–) por cromatografía iónica. Las mayores
concentra-ciones de PM se observaron en sitios industriales; las concentraconcentra-ciones en cruces de vialidades principales fueron menores, y los valores más bajos se obtuvieron en un sitio remoto. Las concentraciones de PM fueron aproximadamente de dos a 20 veces mayores que los estándares establecidos por la Organización Mundial de la Salud y la Agencia de Protección Ambiental estadounidense. Las partículas gruesas (TSP y PM10) registraron mayores niveles durante el verano y las partículas relativamente pequeñas (PM4 y PM2.5)
durante el invierno, en tanto que las concentraciones de partículas de todos los tamaños fueron menores durante la época de monzones en todos los sitios. Las concentraciones de los diferentes elementos y iones solubles en agua siguieron un patrón estacional similar al de las concentraciones de PM. Los elementos de la corteza terrestre Ca, Fe, Mg y Na fueron los mayor contribuyentes a las TSP, en tanto que las con-centraciones de origen antropogénico (Pb, Cd, Ni, Cu y Zn) fueron relativamente bajas y mostraron alta variabilidad espacial. El sulfato (SO42–) contribuyó con 50-60% de la concentración total de aniones y fue
la especie predominante de éstos. Se encontró que la precipitación, la velocidad del viento y la humedad relativa fueron los factores meteorológicos que tuvieron mayor efecto sobre las concentraciones de PM. La evaluación de los datos presentados en este documento servirá como base para la modelación regional y la asignación de fuentes en el futuro.
© 2015 Universidad Nacional Autónoma de México, Centro de Ciencias de la Atmósfera.
ABSTRACT
Spatial and temporal variations in aerosol particulate matter (PM) were investigated for distribution over the four seasons of chemical constituents and particle size fractions in Faisalabad, Pakistan from June 2012 to April 2013. At nine sampling sites, four PM mass size fractions (total suspended particulates [TSP], PM10,
PM4 and PM2.5) were monitored; simultaneously, TSP mass samples were collected on glass fiber filters
using a high volume air sampler. TSP samples (144) were subjected to quantitative chemical analyses for determining trace elements (Pb, Cd, Ni, Zn, Cu, Fe) using atomic absorption spectroscopy, and water-soluble cations (Ca2+, Mg2+, Na+, K+, NH
4+) and anions (Cl–, SO42– and NO3–) by ion chromatography. The highest
PM mass concentrations were observed at industrial sites, while they were somewhat lower in major road intersections and lowest in the remote background site. It was also observed that PM mass concentrations were about two to 20 times higher than the standard limits of the World Health Organization and the US Environmental Protection Agency. Coarse particles (TSP, PM10 and PM4) were found to be highest during
the summer, while relatively fine particles (PM2.5) were higher during the winter period. Concentrations of
all size fractions were lowest during the monsoon sampling period at all sites. Concentrations of different elements and water-soluble ions also followed the similar temporal pattern as PM mass concentrations. The crustal elements Ca, Fe, Mg and Na were the largest contributors to TSP mass while elements of anthro-pogenic origin (Pb, Cd, Ni, Cu and Zn) had relatively lower concentrations and also showed a high spatial variation. Among the anions, sulfate (SO42–) was the predominant species contributing to 50-60% of the total
anion concentration. It was found that rainfall, wind speed and relative humidity were the most important meteorological factors affecting PM concentrations. The evaluation of data presented in this paper will serve as a basis for future regional modeling and source apportionment.
Keywords: TSP, PM10, PM2.5, size distribution, meteorology.
1. Introduction
Atmospheric degradation has become a severe threat to human health and welfare in developing countries like Pakistan, where urbanization, motorization, and industrialization coupled with concomitant growth of energy use are growing rapidly. This threat is especial-ly severe in areas where technologies and strategies for controlling emissions are limited due to lax legislative standards and enforcement of regulations (Colbeck et al., 2010; Shah and Shaheen 2010; Shah et al., 2012). Airborne particulate matter (PM) is ubiquitous in the atmosphere and is a major indicator of air quality in a given area. PM varies widely in size, concen-tration and chemical composition. It is regulated globally under permissible standards based on size fractions ranging from PM2.5 (respirable fine particles,
aerodynamic diameter ≤ 2.5 µm) to PM10 (inhalable
coarse particles, aerodynamic diameter ≤ 10 µm) to
TSP (total suspended particles, aerodynamic diameter
≤ 100 µm). PM4 (aerodynamic diameter ≤ 4 µm) is also known as the respirable size fraction (Mar et al., 2004). PM originates from a variety of natural (e.g., sea spray and dust storms), and anthropogenic (e.g., power plants, brick kilns, waste incineration, industrial emissions, motor vehicles, and agricultural activities) sources, as well as secondary formation processes.
The chemical composition of PM has also been
widely explored because it can determine the impacts on visibility, climate change and consequent health risks, as well as its potential sources and formation processes (Ragosta et al., 2008). Hence, the assess-ment of atmospheric PM concentrations and its toxic constituents is a prerequisite for epidemiological studies and air quality management (Bhaskar et al., 2008; Shah et al., 2012).
Epidemiological studies have consistently
con-firmed a strong association between ambient PM
containing toxic components and respiratory- and cardiovascular-related increases in morbidity and mortality, especially in urban areas (e.g., Pope 2000; Becker et al., 2005). This association has been re-vealed to be stronger for PM2.5 than for PM10 or TSP, since PM2.5 can penetrate deep into the alveolar region of the human lungs (Mar et al., 2004).
pollutants in this part of the world, PM and its asso-ciated chemical species can be a useful index of air quality, providing also indirect information on the presence of other (primary and secondary) pollutants (Ragosta et al., 2008).
Air pollution control in Pakistan has not yet become an electoral issue due to a lack of adequate information for decision and policy makers (Shah et al., 2012), although some sporadic reports that rec-ognize airborne PM as a serious environmental and health concern in urban areas of Pakistan are avail-able (Pak-EPA/JICA, 2001; Pak-EPA, 2005; Colbeck
et al., 2010). In general, PM concentrations are many times higher than the World Health Organization (WHO) and the United States Environmental Protec-tion Agency (US-EPA) permissible limits. According to the World Bank (2006), the annual health burden due to PM is 1% of the gross domestic product and is responsible for 22 000 premature deaths among adults and 700 deaths among children in Pakistan.
The work presented here is based on the hypothe-sis that PM varies broadly (spatially and temporally)
in size, concentration and chemical composition in the study area, Faisalabad, Pakistan, likely due to various sporadic local sources. The study was carried out to assess ambient PM concentrations and their chemical constituents during a one-year monitoring period and then to estimate different possible sources contributing to these concentrations based on mutual correlation patterns. This work could be used as an incentive to initiate other studies on trend analysis,
impact assessment and source identification for this
region. It is anticipated that the present study will be helpful for designing and instituting future abatement strategies and emissions regulations.
2. Materials and methods
2.1 Study area
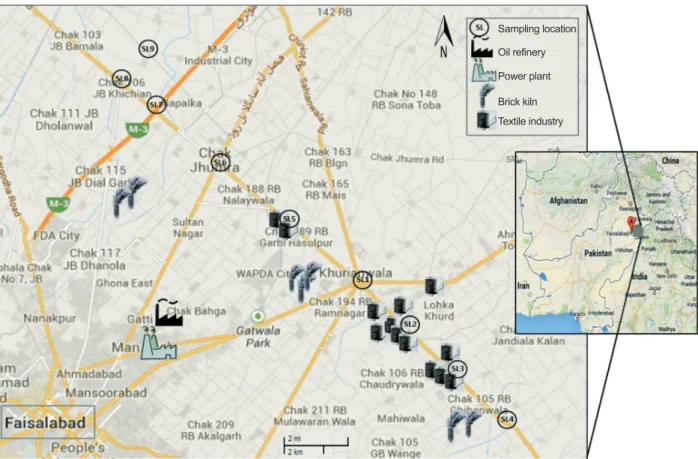
Faisalabad (73-74º E, 30-31.15º N) is the third largest city in Pakistan and a major industrial center, thus its air quality is an eminent environmental concern. It has an area of 1230 km2 and is inhabited by over four million people. Figure 1 shows major industries in the proximity of the sampling sites (SL), including
Sampling location Oil refinery
Power plant
Brick kiln Textile industry
textile mills, brick kilns, a power plant, and a refin -ery. Other major industries include marble factories,
flourmills, chemical and soap factories, engineering
complexes, and food processing units. Also there are
eight intercity highways that are heavily trafficked. This heavy industry along with heavy traffic is a
main source of air pollution in the area. The climate is characterized as hot and dry (arid) with an annual mean rainfall of 350 mm, of which approximately 70% falls during the monsoon season (July-Septem-ber). The climate is divided into four distinct seasons; hot and rainy summer (June-August) followed by autumn (September-November), cold and dry winter (December-February) and a mild spring (March-May). Mean maximum and minimum temperatures in summer are about 40 ºC and 27 ºC and in winter about 21 ºC and 6 ºC, respectively. The predominant wind directions are mostly from the southwest. The average RH in winter and summer ranges from 67 to 85% and 57 to 78%, respectively. The mean RH in the rainy (monsoon) season is ranged from 60 to 88%.
2.2 Sampling sites
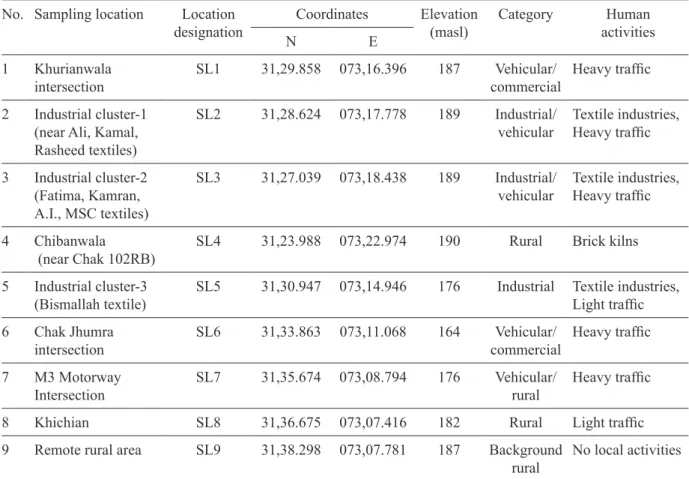
The selection of multiple sampling sites was based on the existing anthropogenic activities responsible for air pollution, and the prevailing wind direction for pollutant distribution and dispersion in the area. Nine different sampling sites were selected to represent different urban, industrial and rural settings located downwind, to the North and East of the city center, as shown in Figure 1. Table I presents sampling sites details. Three vehicular sites (SL1, SL6, SL7) are located near road intersections (10 m) while six industrial and rural sites are located far away from nearby roads.
2.3 Monitoring and sampling procedure
Ambient PM of different size fractions (TSP, PM10, PM4, PM2.5) was monitored with a MicroDust Pro Real Time Aerosol Monitor (model HB3275-07, Casella CEL, UK) on a 6-h average basis at each sampling site. This instrument has a detection range of 0.001-2500 mg m–3 with a resolution 0.001 mg m–3.
Table I. Description of the sampling locations of the study. No. Sampling location Location
designation NCoordinatesE Elevation(masl) Category activitiesHuman
1 Khurianwala
intersection SL1 31,29.858 073,16.396 187 commercialVehicular/ Heavy traffic 2 Industrial cluster-1
(near Ali, Kamal, Rasheed textiles)
SL2 31,28.624 073,17.778 189 Industrial/
vehicular Textile industries, Heavy traffic
3 Industrial cluster-2 (Fatima, Kamran, A.I., MSC textiles)
SL3 31,27.039 073,18.438 189 Industrial/
vehicular Textile industries, Heavy traffic
4 Chibanwala
(near Chak 102RB) SL4 31,23.988 073,22.974 190 Rural Brick kilns 5 Industrial cluster-3
(Bismallah textile) SL5 31,30.947 073,14.946 176 Industrial Textile industries, Light traffic
6 Chak Jhumra
intersection SL6 31,33.863 073,11.068 164 commercialVehicular/ Heavy traffic 7 M3 Motorway
Intersection SL7 31,35.674 073,08.794 176 Vehicular/ rural Heavy traffic
8 Khichian SL8 31,36.675 073,07.416 182 Rural Light traffic
9 Remote rural area SL9 31,38.298 073,07.781 187 Background
A polyurethane foam (PUF) filter adapter with a flow rate of 3.5 L min–1 was used for size-selective
monitoring of PM masses. The PUF filter loaded
into the adapter determined the size of the PM being monitored. Filters are available for PM10, PM4, and PM2.5 size fractions. TSP mass samples were collected
on micro glass fiber filter papers (47 mm) using a
portable air sampler (model CF-1001BRL, Hi-Q,
USA) fitted with a filter holder (model CFPH-25). The sampler flow rate was 5.097 m3 h–1 with manual compensation for increased pressure drop across the
filter as it loads. Sampler and monitor were located
5 m above the ground level.
The PM monitoring and sampling period was spread over all four seasons; summer (June), monsoon (September), winter (January) and spring (April), spanning from June 2012 to April 2013. On sampling days, two 6-h samples were collected from 7:00 am to 1:00 pm and from 1:00 pm to 7:00 pm (June, 2012); 8:00 am to 2:00 pm and 2:00 pm to 8:00 pm
September, 2012; April, 2013); and finally 9:00 am
to 3:00 pm, and 3:00 pm to 9:00 pm (January, 2013). In all, 144 (16 × 9) TSP samples were collected over four sampling periods, two sampling days per nine sites per four months. Sampling was conducted simultaneously at three industrial sites (SL2, SL3, SL5), three vehicular sites (SL1, SL6, SL7) and three rural/remote sites (SL4, SL8, SL9). In addition 36
(4 × 9) field blanks were collected. The sampling
periods were elected on the middle month of each season and the sampling days wholly represented the characteristics of that season. Sampling/monitoring was not performed on rainy and dust storm days.
TSP mass was also determined gravimetrically
from the filters after conditioning in a desiccator
for 24 h at 45 ± 5% RH and 23 ± 3 ºC. The filter
papers containing PM were stored in sealed plastic envelopes, refrigerated and transported promptly to the lab for analysis.
2.4 Meteorological determination
Simultaneous measurements of surface meteorolog-ical parameters such as RH, temperature, wind speed and direction, and solar radiation were carried out with the help of a portable weather station (model 110-WS-18, Nova Lynx, USA) at each sampling site during the sampling hours. The weather station was equipped with different sensors: an anemom-eter for wind speed (with 0.35 m s–1 threshold and
> 0.04 m s–1 resolution) and wind direction (with 0.5 m s–1 threshold and > 1% resolution); a thermo-hy-grometric sensor for air temperature (with 0.05 Cº resolution) and RH (with 0.1% resolution), and a silicon pyranometer for solar radiation (with 80 mV /1000 w m–2 sensitivity). The data for sunshine, pan evaporation and rainfall parameters were obtained daily from the Meteorology Cell of the Crop Phys-iology Department, University of Agriculture, Faisalabad, Pakistan.
2.5 Chemical analysis of PM samples
After gravimetric analysis, each filter was cut into two
equal parts. One half was used for determining trace metals after digestion in a mixture of nitric acid (Su-prapure, 65% GR grade, Merck) and perchloric acid (Suprapure, 70% GR grade, Merck) (10:1,v/v) facili-tated by heating (method IO-3.1, US-EPA, 1999). The
extracted solution was filtered and diluted to 100 ml
with double distilled water and kept in refrigeration in a cleaned polyethylene bottle until analyzed. The
same procedure was carried out for filter and reagent
blanks. Filter and reagent blank concentrations were
always less than 10% of the loaded filter values.
Selected trace metals were determined by atomic absorption spectrophotometry (AAS) (Thermo AA, Solar-Series) following the method IO-3.2, US-EPA (1999). Prior to the analysis of samples, the AAS re-sponse was calibrated using a reagent blank solution and standard solutions at six different concentration levels; also, a series of continuing calibration checks were performed during the analysis of each set of samples and the extracted solution samples were run on AAS in triplicate to minimize errors.
The other filter half was used for determining water-soluble ions; five cations (Ca2+, Mg2+, Na+, K+, NH4+) and three anions (Cl–, SO42– and NO3–) were determined after extraction in double distilled water by ultrasonication for 2 h (Chakraborty and Gupta, 2010). Ionic species were analyzed by ion chroma-tography (IC Vario-940 Metrohom, Switzerland). Peak areas were calibrated by analyzing a series of standards over the range 0.025-10 mg L–1.
2.6 Quality assurance
and high volume air sampler were daily calibrated.
For TSP sampling and analysis field blanks, filter
paper blanks and reagent blanks were also used to minimize errors. Laboratory testing was conducted in a manner that ensured precision and accuracy at all stages. All chemicals and solvents used were of analytical reagent grade provided by Merck (Darm-stadt, Germany). Double distilled water was used in the present study. The atomic absorption spectropho-tometer was standardized with a series of standard solutions supplied by the manufacturer (Thermo Electron S series; Thermo Scientific, Waltham, Mass). The reproducibility test that determines the stability of instruments exhibited a relative standard deviation of 97-101% with an average relative devia-tion of < 5%. Inter-laboratory comparison of the AAS results was also performed at an independent labora-tory (Hi-tech Laboralabora-tory, University of Agriculture, Faisalabad), and a maximum deviation of ± 5% was normally recorded in the results of both laboratories.
3. Results and discussion
3.1. Aerosol particulate matter (PM) concentrations
Real-time monitoring over the measured TSP mass concentrations was performed and compared to the
gravimetric method using a filter-based air sampler,
as shown in Figure 2. The values are very well correlated and a maximum deviation of 10% was observed between the two methods for determining
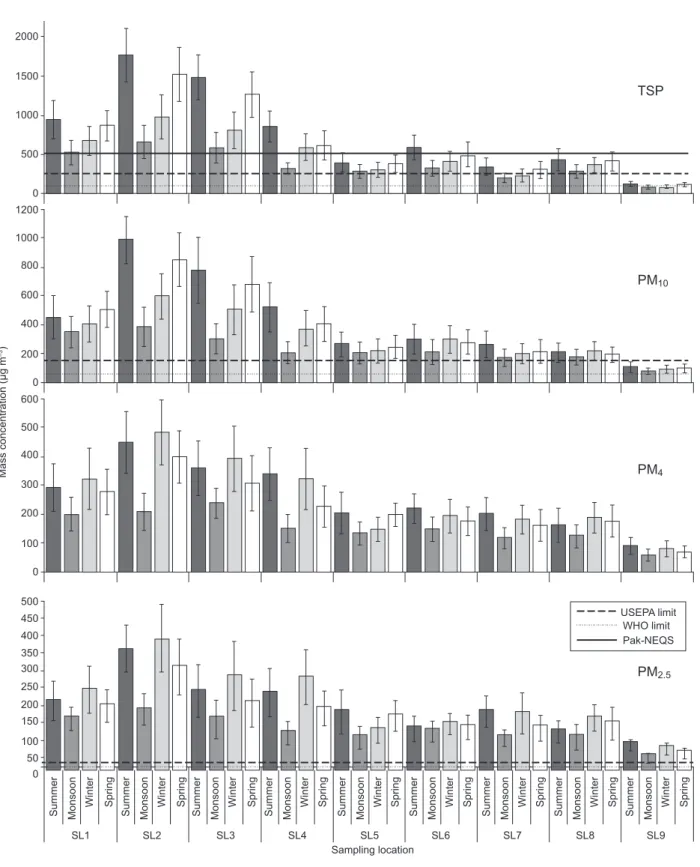
TSP mass. Spatial and temporal mass concentrations of aerosol PM during the whole study period (June 2012-April 2013) are presented in Figure 3. Over-all, ambient PM concentrations far exceed the 24-h standard limits established by US-EPA (2012), WHO (2005) and Pak-EPA (2012).
Two-way analysis of variance (ANOVA) was used to test whether the temporal variations in PM mass concentration were correlated —all of the sampling
sites were significantly different from each other
(p < 0.01). The highest annual average PM con-centrations for all particle sizes (TSP, PM10, PM4 and PM2.5) were observed at SL2 (an industrial site) followed in decreasing order by SL3, SL1, SL4, SL6, and the lowest concentrations were recorded at a remote rural site (SL9). Similar spa-tial patterns were also observed during the four sampling periods within the study area, as shown in Figure 3. TSP concentrations were 2 to 16 and
1.2 to 8 times higher than the WHO (120 µg m–3)
and US-EPA (260 µg m–3) 24-h standard limits, re-spectively, except for the background rural site (SL9). Similarly, PM10 andPM2.5 levels were 2 to 22 and 1.2 to 7 times higher than the WHO limits (50 and
25 µg m–3) and 1.6 to 19 and 1.2 to 13 times higher
than US-EPA (150 and 35 µg m–3) 24-h standards, respectively, at all sites within the study area.
The highest concentrations were observed at in-dustrial sites SL2 and SL3, proximal to a power plant, and textile, plastic, rubber and chemical industries. These sites are also located near narrow, unpaved,
rough roads with heavy traffic emissions that are
trapped in the narrow street canyons. The on-road
vehicular fleet mainly consists of heavy-duty diesel
vehicles, especially trucks, tractor-trailers, vans and local buses.
A power plant and an oil refinery located near and
upwind of these sampling sites might also contribute to PM mass concentrations. Hence, emissions from industries and automobiles were the major sources of PM at these sites during the sampling period (Ashraf
et al., 2013; Mohammed and Namuduri, 2013; Ni et al., 2013).
High PM concentrations were also observed at vehicular sites SL1 and SL6, which are major road
intersections with dense traffic 24 hours per day and busy commercial districts. Traffic is congested due to
the high density of heavy vehicles and the narrowing of available roadway resulting from encroachment
0 0 400
TSP
concentration (µg
m
–3)
measured by real-time monitoring
TSP concentration (µg m–3) measured by the gravimetric method 800
1200 1600 2000
400 800 1200 1600 2000
Fig. 2. Correlation between TSP mass concentrations
(µg m–3) measured with a real time monitor and by the
Mass concentration (µg
m
–3)
2000
1500
1000
500
TSP
0
1000 1200
800
600
400
200
PM10
0
500 600
400
300
200
100
PM4
0
450 400 500
350 300 250 200 150 100 50
PM2.5
0
SL1 SL2 SL3 SL4 SL5
Sampling location SL6 SL7 SL8 SL9
Summe
r
Monsoon Winter Spring Summe
r
Monsoon Winter Spring Summe
r
Monsoon Winter Spring Summe
r
Monsoon Winter Spring Summe
r
Monsoon Winter Spring Summe
r
Monsoon Winter Spring Summe
r
Monsoon Winter Spring Summe
r
Monsoon Winter Spring Summe
r
Monsoon Winter Spring USEPA limit
WHO limit Pak-NEQS
by merchants on both sides of the road. Roads are poorly maintained, unpaved and dusty with limited vegetation along the sides. Vehicles are typically old, poorly maintained, overloaded, smoky, employing
inefficient engines that use poor quality fuel (Colbeck
et al., 2010; Shah et al., 2012; Ashraf et al., 2013). Contribution to PM at these sites during the whole sampling period was mainly due to re-suspended road dust and emissions from public and commercial trans-portation (i.e., buses, trucks, vans, auto-rickshaws and two-wheelers). High PM mass concentrations at SL4 (a rural site) were possibly due to combustion of low quality fuel currently being used in two brick kilns located at this sampling location. Low quality coal, wood, used rubber tires and waste oil are mostly used for fuel in these kilns located within the study area (Javed et al., 2015).
On the contrary, the lowest PM concentration was recorded at a remote rural site (SL9) because the sorrounding area (up to 15 km2) had no vehicu-lar and industrial activities throughout the sampling period. Vegetation is more prevalent and ventilation is better. So this location served as a background site for comparison with more polluted areas.
3.2 Temporal distribution of PM over the study area
The average TSP concentration was significantly
higher (773 ± 240 µg m–3) in summer followed by spring (666 ± 230 µg m–3) and winter (505 ± 210 µg m–3), and its minimum (365 ± 190 µg m–3) was found during the monsoon sampling period (Fig. 4). A similar pattern was observed in the case of PM10 and PM4 mass concentrations —highest during summer
and lowest during the monsoon sampling period. In contrast, the PM2.5 average concentration was highest (209 ± 90 µg m–3) during winter and lowest (124 ± 40 µg m–3) during the monsoon sampling period. This high PM2.5 concentration during the winter period can be attributed to lower temperature and wind speed that result in reduced atmospheric mixing coupled with higher anthropogenic activ-ities such as biomass burning and space heating (Karar et al., 2006; Chakraborty and Gupta, 2010; Pakbin et al., 2010; Ni et al., 2013). That is why visibility in Faisalabad and its surrounding areas during foggy winter days is often as low as 50 m. The lower PM concentrations observed during the monsoon sampling period can be attributed to wash-out by rainfall, wet surfaces and higher RH that reduces re-suspension of road and crustal dust (Budhavant et al., 2009; Celo and Dabek-Zlo-torzynska, 2010; Shah et al., 2012), but also to the shutdown of brick kilns. Higher concentrations of coarse particles (TSP, PM10 and PM4) were found during the summer sampling period likely due to the enhanced re-suspension of road and crustal dust favored by higher temperature and wind speed, coupled with lower rainfall and RH (Pakbin et al., 2010; Shah and Shaheen, 2010). Also, a few dust storms were observed during the summer sampling period. In addition, local brick kilns operate during the dry seasons while most are closed during the wet season. On the whole, it is observed that PM pollution in ambient air of different areas of Fais-alabad, especially those having high vehicular and
100
44%
22%
9%
25% 34%
8% 21%
37% 37%
12% 10%
42%
24% 21%
9%
30% 8%
26% 41%
80
60
%
40
20
Summer Monsoon Winter Spring Annual
TSP-PM10 PM10-PM4 PM4-PM2.5 PM2.5
0
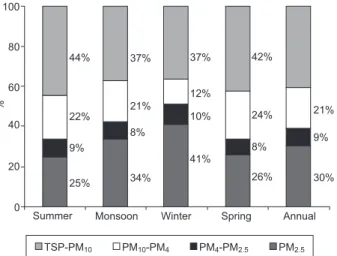
Fig. 5. Percentage (%) of aerosol PM size distribution during the study period.
1000
800
600
Mass concentraton (µg
m
–3)
400
200
Summe
r
Monsoo
n
TSP PM10
PM4
PM2.5
Winter Spring Annua
l
US-E
PA
WH
O
0
Fig. 4. Aerosol PM size distribution and mass
concen-tration (µg m–3) during the study period along with 24-h
industrial activities, has become a serious problem and it is more severe during dry periods.
3.3 Aerosol PM size fractionation
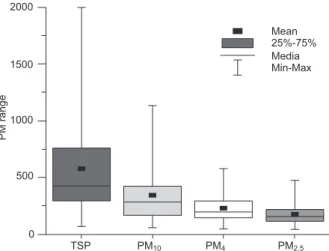
Figure 5 shows the size distribution of PM within the study area. The TSP-PM4 fraction is about 62% of the average TSP mass, whereas PM2.5 is about 30%. The PM2.5 mass is about 52% of PM10, indicating that the dominant sources in the study area are anthro-pogenic processes. During summer and spring the coarse fraction contributes to a larger portion of the average TSP mass (66%) indicating that mechanical processes (i.e., re-suspension of road/crustal dust, stone crushing/cutting, constructions activities, etc.) are the most likely sources (Karar et al., 2006). In addition, a box and whisker plot (Fig. 6) also depicts that coarse PM fractions (TSP, PM10 and PM4) are
not as normally distributed as fine fractions (PM2.5), since in the former mean and median are dissimilar whereas in the latter they have nearly the same value. During the winter sampling period PM2.5 constitutes an overwhelming fraction (41%) of PM, thereby indicating the presence of enhanced anthropogenic activities, favorable conditions for the accumulation
of fine particles (which have higher residence time
in air), and more combustion activities from space heating (Karar et al., 2006; Cheung et al., 2011; Alolayan et al., 2013; Yu et al., 2013).
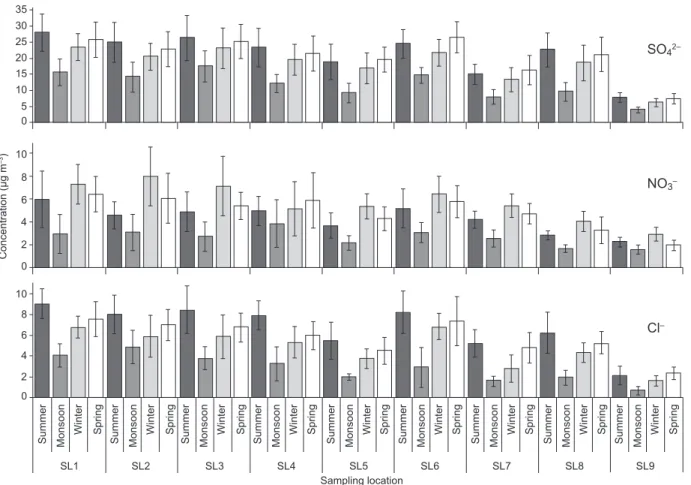
3.4 Aerosol chemical species
The spatial and temporal variations in trace metal and ion concentrations were tested by two-way ANOVA.
Figures 7-9 illustrate that all sampling periods and
sites were significantly different from each other
(p < 0.01) regarding trace metals and ions concen-trations. Chemical species concentrations followed nearly the same spatial pattern as PM mass concen-trations —highest at the industrialized SL2 and SL3
sites, followed by traffic congested SL1 and SL6, and
lowest at the remote rural site (SL9).
The crustal metal Fe was found to be present in higher concentrations as compared to other metals. Higher levels of Zn and Cu were also observed during the summer and spring sampling periods because these metals, which are mostly emitted from lubricant oil, brake linings, and tire wear of poorly maintained and old vehicles plying on the roads (Shah et al., 2012; Alolayan et al., 2013), are also associated with paved road dust. Among the cations, Ca2+, Mg2+, Na+ and K+ also exhibited higher concentrations during the summer (Fig. 8), since these ions are mostly as-sociated with a crustal origin (Cheung et al., 2011; Alolayan et al., 2013). A similar trend was also found for the Cl– anion. Higher concentrations of these elements during the summer period were likely due to higher wind speed and temperature, and dry conditions that resulted in enhanced re-suspension of crustal/road dust (Pakbin et al., 2010; Shah and Shaheen 2010; Ni et al., 2013).
Trace metals of anthropogenic origin, such as Pb, Cd, and N, presented relatively lower concen-trations. These metal concentrations were likely due to anthropogenic emissions (e.g., vehicles, in-dustries, coal and oil combustion, etc.), so maxima were found at locations characterized by nearby intensive industrial and vehicular activities (Mijic
et al., 2012). Higher concentrations of these metals were found during the winter period likely due to increased anthropogenic activities as well as pre-vailing cool and calm meteorological conditions that resulted in reduced mixing-layer height and dispersion conditions that favor accumulation of these metals in the atmosphere (Chakraborty and Gupta, 2010; Yu et al., 2013). In Pakistan, Pb is still being used as an anti-knock agent for gasoline despite a ban on leaded fuel, because compliance is not yet enforced. Also, Pb has become part of the road dust due to the use of leaded fuel over the years (Chakraborty and Gupta, 2010; Colbeck
et al., 2010). Nickel also exhibits similar trends to that of Pb, with higher levels during the winter
Mean 2000
1500
1000
PM rang
e
500
0
TSP PM10 PM4 PM2.5
25%-75% Media Min-Max
Concentration (µg
m
–3)
18 16 14 12 10 8 6 4 2
Fe
0 16 14 12 10 8 6 4 2
Zn
0
10 8 6 4 2
Cu
0
4 5
3 2 1
Pb
0
1.5 2
1
0.5
Ni
0
0.05 0.04
0.02 0.01
0.03 Cd
0
SL1 SL2 SL3 SL4 SL5
Sampling location
SL6 SL7 SL8 SL9
Summer Monsoo
n
Winter Spring Summer Monsoo
n
Winter Spring Summer Monsoo
n
Winter Spring Summer Monsoo
n
Winter Spring Summer Monsoo
n
Winter Spring Summer Monsoo
n
Winter Spring Summer Monsoo
n
Winter Spring Summer Monsoo
n
Winter Spring Summer Monsoo
n
Winter Spring
sampling period. The likely Ni source was crude
oil combustion in a power plant and an oil refinery
located near and upwind of the sampling sites (Mi-jic et al., 2012; Yu et al., 2013). Use of low quality coal, wood, used rubber tires and waste oil as fuel in brick kilns located within the study area was also a likely source of trace metals such as Cd, Zn, Cu and Pb (Celo and Dabek-Zlotorzynska, 2010; Shah
et al., 2012).
K+ and Cl– ions are mostly emitted by coal, biomass and waste burning (Yu et al., 2013), and they are also associated with a crustal origin. As Faisalabad is an in-land city, marine impacts on aerosol PM can be ignored. Higher K+ and Cl– concentrations during summer and spring periods should be due to burning of wheat-straw, sugarcane-trash and cornstalk after harvest (Shen et al., 2009). Non-crustal K has been used as an indicator of biomass burning emissions (Shen et al., 2007) and
Concentration (µg
m
–3)
30 25 20 15 10 5
NH4+
0 20 18 14 12 16
10
4 2 8 6
Ca2+
0 18
14 12 16
10
4 2 8 6
K+
0 14
10 12
4 2 8 6
Na+
0 10
3 2 1 6 9 8 7
5 4
Mg2+
0
SL1 SL2 SL3 SL4 SL5
Sampling location SL6 SL7 SL8 SL9 Summer Monsoo
n
Winter Spring Summer Monsoo
n
Winter Spring Summer Monsoo
n
Winter Spring Summer Monsoo
n
Winter Spring Summer Monsoo
n
Winter Spring Summer Monsoo
n
Winter Spring Summer Monsoo
n
Winter Spring Summer Monsoo
n
Winter Spring Summer Monsoo
n
Winter Spring
could be separated from crustal sources by using an ap-proach described by Miranda et al. (1994) as non-soil K = K – 0.52Fe, by applying a K/Fe ratio (0.52) of coarse soil. From the total average K (6.02 µg m–3), 1.84 µg m–3 are contributed by biomass burning and the remaining fraction (4.18 µg m–3) is associated with crustal origin.
Among the water-soluble anions, sulfate (SO42–) was the predominant species, contributing with 50-60% of the total anion concentration, as found previously by Chakraborty and Gupta (2010). Both SO42– and NO3– anions, as well as the NH4+ cation ex-hibited highest concentrations during winter and low-est during the monsoon sampling period (Figs. 8, 9). This can be attributed to lower temperature, higher RH and calm conditions with lower mixing height during the winter period, which favored accumulation of these ions in the atmosphere, as well as increased anthropogenic activities such as biomass burning and space heating (Cheung et al., 2011; Alolayan et al., 2013; Ni et al., 2013). All measured chemical
species were lowest during the monsoon sampling period when high RH and wet surfaces minimized the re-suspension of crustal/road dust and wash-out by rainfall (Budhavant et al., 2009; Chakraborty and Gupta, 2010; Yu et al., 2013).
It was found that the NO3– concentration in PM is lower than the SO42– concentration. Essentially, nitrate cannot exist in the particle phase unless its acidity is near neutral. In these observations, nitrate was almost invariably observed, which indicates excess of ammonia in the atmosphere that neutral-izes the particulate sulfate and condenses with the nitrate forming the particulates ammonium sulfate
((NH4)2SO4) and ammonium nitrate (NH4NO3) (Han
et al., 2008; Shen et al., 2009; Chakraborty and Gup-ta 2010). In contrast, higher summer temperatures increase dissociation of NH4NO3 to form the gases nitric acid and ammonia (Alolayan et al., 2013).
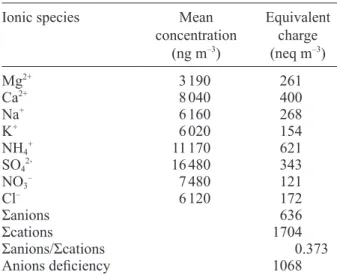
3.5. Aerosol ionic balance
Ionic balance (as mole equivalents) can be a useful
Fig. 9.Spatio-temporal distribution of TSP-associated water-soluble anions in the study area.
Concentration (µg
m
–3)
30 25 35
20 15 10 5 0
10
4 2 8 6
SO42–
NO3–
0
10
2 6 8
4
Cl–
0
SL1 SL2 SL3 SL4 SL5
Sampling location
SL6 SL7 SL8 SL9
Summer Monsoo
n
Winter Spring Summer Monsoo
n
Winter Spring Summer Monsoo
n
Winter Spring Summer Monsoo
n
Winter Spring Summer Monsoo
n
Winter Spring Summer Monsoo
n
Winter Spring Summer Monsoo
n
Winter Spring Summer Monsoo
n
Winter Spring Summer Monsoo
n
tool to determine any possible missing ionic species, so this method was applied to PM from the study area (Table II). The results of Σanions/Σcations for PM were well below one unit, which shows that there
is a quite reasonable anion deficiency in PM, thus
suggesting that positive charges from cations are not totally neutralized by negative charges from anions (Mkoma et al., 2014). The apparent anion deficiency
shows that PM samples are, in fact, alkaline. This buffering of acidity by the PM is certainly due to high mineral dust loadings. If this is the case, CO32– is a prominent alkaline component of dust precursor materials and is expected to associate with Ca2+ in the coarse PM fraction (Shen et al., 2007, 2009). In
the present study, most anions (F–, Br–, I–, PO 42–, S2–, SiO32–, CO32–, HCO3– etc.) and other organic anions (CH3COO–, HCOO–, C2O2–, C2O42– etc.) were not measured in PM samples because the greatest portion (80%) of the chemically analyzed TSP mass remained
unidentified, so there is a huge ionic imbalance in
ion concentrations as found earlier by Mkoma et al.
(2015).
3.6 Correlation analysis
3.6.1 PM mass correlation with meteorological parameters
Table III shows that TSP mass was strongly correlated with PM10 and PM4 fractions, with r2 values of 0.78 and 0.65, respectively. This suggested that these
fractions have a significant contribution to the overall TSP mass. The similarly finer fractions PM4 and PM2.5 exhibited a closer mutual relationship with an r2 value
as high as 0.88. Thereby, coarse and fine fractions
of PM appeared to have an independent behavior, in agreement with the earlier paradigm that abrasive processes emit coarse material and
combustion-ori-ented processes emit ultrafine material that grows by condensation into the fine mode.
A negative correlation was observed between RH and the coarse fractions TSP and PM10 while there is
a positive correlation with the relative fine fractions
PM4 and PM2.5. Fine particle mass (PM2.5) was also negatively correlated with temperature, which
con-firms that lower temperature favors accumulation and
condensation to particles in this size range. On the other hand, high temperature increases dissociation
Table II. Ion balance (neq m–3) of PM samples from the
study area.
Ionic species Mean
concentration (ng m–3)
Equivalent charge (neq m–3)
Mg2+ 3 190 261
Ca2+ 8 040 400
Na+ 6 160 268
K+ 6 020 154
NH4+ 11 170 621
SO42- 16 480 343
NO3– 7 480 121
Cl– 6 120 172
Σanions 636
Σcations 1704
Σanions/Σcations 0.373
Anions deficiency 1068
Table III.Pearson correlation coefficient matrix for PM size fractions and meteorological parameters during the study
period (n = 144).
TSP PM10 PM4 PM2.5 WS RH Temp PE SR SS
PM10 0.78*
PM4 0.65* 0.46*
PM2.5 0.43* 0.65* 0.88*
WS 0.69* 0.52* –0.65* –0.74*
RH –0.72* –0.62* 0.45* 0.85* –0.70*
Temp 0.39 0.37 0.25 –0.42* 0.32 –0.74*
PE 0.23 0.28 0.24 0.32 0.80* –0.82* 0.78*
SR 0.46* 0.56* 0.68* 0.62* 0.37 –0.58* 0.53* 0.84*
SS 0.17 0.19 0.36 0.38 0.25 –0.72* 0.75* 0.89* 0.85*
RF –0.76* –0.72* –0.82* –0.87* 0.46* 0.83* –0.30 –0.26 –0.51* –0.42 *
of fine particles (Alolayan et al., 2013). Rainfall, as accepted, was found to have a negative effect over all size fractions of PM due to its scavenging effect (Karar et al., 2006; Budhavant et al., 2009), especially during the monsoon sampling period (Sep-tember), when 202 mm of rainfall were collected in nine days. Solar radiation was found to positively affect the PM mass, notably PM4 and PM2.5, since
an increased actinic flux leads to formation of con -densable inorganic and organic compounds. Sunshine
and pan evaporation turned out to be non-significant
parameters for PM concentrations. Wind speed was also found to affect positively the coarse fractions, likely due to the suspension of dust, and negatively
the fine fractions, likely due to the dust scavenging
condensable inorganic and organic compounds that
would have condensed on the fine fraction (Pakbin
et al., 2010; Mohammed and Namuduri, 2013). As strong winds (1.11-3.59 m s–1) were encountered during the summer sampling period, a corresponding temporal distribution of PM provided support to this effect of meteorology.
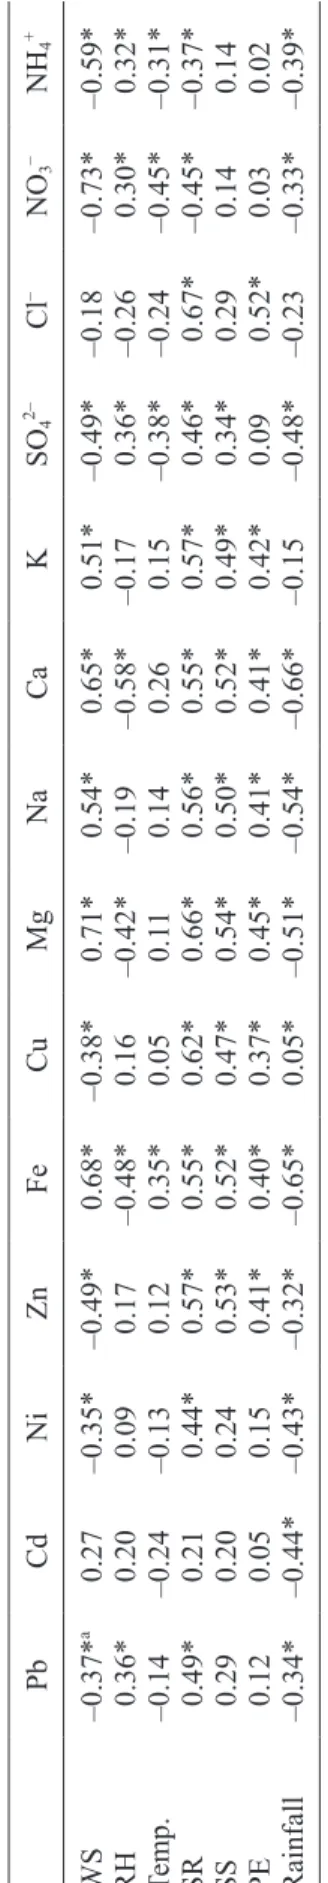
3.6.2 Correlation of TSP chemical species with me-teorological parameters
Table IV shows both positive and negative correla-tions between species concentracorrela-tions and meteo-rological parameters. Crustal elements Fe, Mg, Ca and Na were positively correlated with wind speed,
confirming that these particles were emitted due to
windblown road and crustal dust in the sampling area. Thereby, these elements have a negative relationship with RH. In contrast, metals of anthropogenic origin Zn, Cu, Pb, and Ni and ions (SO42–, NO3– and NH4+) were negatively correlated with the wind speed pos-sibly due to increased dispersion (Mohammed and Namuduri, 2013). These ions are also negatively correlated with temperature and positively correlated with RH; as discussed earlier, lower temperature and higher humidity favored condensation of semi-vola-tile species (Karar et al., 2006; Cheung et al., 2011; Alolayan et al., 2013). It was also found that, as expected, rainfall had a negative and pivotal role on all chemical species, indicating its scavenging effect as was the case of PM mass concentrations (Budhavant et al., 2009; Yu et al., 2013). Solar radi-ation, sunshine and pan evaporation parameters were observed to have mostly a positive correlation with
all chemical species. Table IV
.
Pearson correlation coefficient matrix for
TSP
associated chemical species and eteorological parameters during the study period (n = 144).
Pb Cd Ni Zn Fe Cu Mg Na Ca K SO 4 2– Cl – NO 3 – NH 4 + WS –0.37* a 0.27 –0.35* –0.49* 0.68* –0.38* 0.71* 0.54* 0.65* 0.51* –0.49* –0.18 –0.73* –0.59* RH 0.36* 0.20 0.09 0.17 –0.48* 0.16 –0.42* –0.19 –0.58* –0.17 0.36* –0.26 0.30* 0.32* Temp. –0.14 –0.24 –0.13 0.12 0.35* 0.05 0.1 1 0.14 0.26 0.15 –0.38* –0.24 –0.45* –0.31* SR 0.49* 0.21 0.44* 0.57* 0.55* 0.62* 0.66* 0.56* 0.55* 0.57* 0.46* 0.67* –0.45* –0.37* SS 0.29 0.20 0.24 0.53* 0.52* 0.47* 0.54* 0.50* 0.52* 0.49* 0.34* 0.29 0.14 0.14 PE 0.12 0.05 0.15 0.41* 0.40* 0.37* 0.45* 0.41* 0.41* 0.42* 0.09 0.52* 0.03 0.02 Rainfall –0.34* –0.44* –0.43* –0.32* –0.65* 0.05* –0.51* –0.54* –0.66* –0.15 –0.48* –0.23 –0.33* –0.39* *Significant at p
< 0.01 (two-tailed
t
-test);
Table
V.
Pearson correlation coefficient matrix for aerosol PM size fractions and
TSP
associated chemical species during the study period (n = 144).
Pb
Cd
Ni
Zn
Fe
Cu
Mg
Na
Ca
K
SO
4
2–
Cl
–
NO
3
–
NH
4
+
TSP
0.29
0.32
0.37
0.48*
0.69*
0.45*
0.73*
0.59*
0.67*
0.59*
0.25
0.41*
0.28
0.19
PM
10
0.58*
0.63*
0.57*
0.53*
0.56*
0.43*
0.70*
0.58*
0.55*
0.56*
0.33
0.35
0.25
0.18
PM
4
0.71*
0.76*
0.61*
0.59*
0.35
0.74*
0.28
0.52*
0.33
0.57*
0.54*
0.58*
0.55*
0.60*
PM
2.5
0.69*
0.80*
0.66*
0.68*
0.30
0.70*
0.32
0.47*
0.27
0.51*
0.71*
0.65*
0.59*
0.68*
*Significant at
p
< 0.01 (two-tailed
t
-test).
3.6.3 PM mass correlation with TSP chemical spe-cies
The chemical species concentrations showed inter-mediate to strong correlations with particle sizes, as reported in Table V. In the spectrum of all cor-relations, crustal elements (i.e., Fe, Mg, Ca and Na) were found to be strongly associated with coarse size fractions (TSP and PM10) and the elements of anthropogenic origin (Cd, Pb, Ni, Zn and Cu) were
strongly associated with fine size fractions (PM2.5) (Ni et al., 2013; Yu et al., 2013). Uniquely, Zn, K and Na exhibited strong to intermediate correlations with all particle size fractions suggesting that these might be derived from both crustal/road dust and anthropogenic origin. In particular, Zn is emitted by multiple sources, such as vehicle emissions, tire wear, diesel soot, oil industries and coal combustion (Xia and Gao, 2011). Secondary anions (SO42– and NO3–), Cl– and one cation (NH4+) also turned out to
be strongly associated with fine fractions, thereby suggesting that these ions reside in fine particles. These correlation findings duly supported previous
assertions in this section regarding spatial and tem-poral distributions of these species.
3.6.4 Correlation among TSP chemical species
In Table VI the correlation coefficients with r values
significant at p < 0.01 show some significant mutual
correlations between relevant pairs of elements in terms of their concentrations. Apparently, elements that are strongly correlated indicate some common sources (Shah and Shaheen, 2010).
Hence, a strong correlation between Pb and Cd with r = 0.89 suggests a common source of these elements. Further, it could be noted that Pb also
significantly correlates to Zn, Cu and Ni with r
values of 0.74, 0.73, 0.71 and 0.60, respectively. Similarly, Cd, Zn, Cu and Ni are strongly correlated. So this group of elements (Pb-Cd-Zn-Cu-Ni) that have strong mutual correlations mainly emanates from industrial as well as vehicular emissions (Xia and Gao, 2011). A strong correlation was also found for Fe-Ca (r = 0.82), Fe-Mg (r = 0.81) and Mg-Ca (r = 0.80), indicating a common source for these elements —the Earth’s crust (Balakrishna and
Per-vez, 2009). Some less significant correlations were
Ni et al., 2013). Another significantly associated
group is K-Cl-Na-Ca-Mg, which is mainly originat-ed from coal and biomass burning (Shen et al., 2009; Yu et al., 2013). Similarly, ions like SO42–, NO3– and NH4+ are strongly correlated, indicating their com-mon origin as secondary particle compounds in the atmosphere (Shen et al., 2007, 2009; Cheung et al., 2011). Noted irregular and inconsistent correlation patterns suggested that these elements possibly originate from several sporadic local sources that are described and applied in a companion paper (Javed et al., 2015).
4. Conclusions
The present study showed a significant spatial and
temporal variation of mass concentrations of differ-ent PM size fractions and its chemical constitudiffer-ents in the local atmosphere of Faisalabad, mainly due to changes in anthropogenic activities and prevail-ing meteorological conditions. The highest PM concentrations were observed at industrial sites, followed by busy road intersections, as compared to a background site. Coarse particles (TSP, PM10 and PM4) were found to be highest during the summer
sampling period and fine particles (PM2.5) during the winter period, while concentrations of all size fractions were lowest during the monsoon sampling period. The temporal concentrations of different elements and water-soluble ions showed trends similar to PM mass concentrations —relatively lower during the monsoon and higher during the summer and winter sampling periods. The major elements in the local atmosphere (Ca, Fe, Mg and Na) were of crustal origin while elements of an-thropogenic origin Pb, Cd, Ni, Cu and Zn emerged as minor contributors. Anion concentrations were highest during winter. Among anions, sulfate was the predominant species contributing to 50-60% of the total anion concentration. Correlation results showed that rainfall, wind speed and RH were the most important meteorological factors affecting the concentration of measured pollutants.
Acknowledgments
This study was funded by the Higher Education Commission, Government of Pakistan. It is part of a Ph.D. research work by the corresponding author, who would like to thank Prof. (Ret.) Dr. Abdul Gha-foor for his guidance regarding the research plan,
Table
VI.
Pearson correlation coefficient matrix for
TSP
associated chemical species during the study period (n = 144).
Pb Cd Ni Zn Fe Cu Mg Na Ca K SO 4 2– Cl – NO 3 – Cd 0.89* Ni 0.60* 0.37 Zn 0.74* 0.66* 0.67* Fe 0.71* –0.22 0.52* 0.73* Cu 0.73* 0.61* 0.35 0.77* 0.29 Mg 0.40 0.26 0.31 0.71* 0.81* 0.59* Na 0.32 0.60 0.63 0.66* 0.72* 0.30 0.74* Ca 0.1 1 0.19 0.26 –0.20 0.82* 0.42 0.80* 0.75* K –0.22 0.59* –0.27 0.73* 0.38 –0.14 0.32 0.79* 0.85 SO 4 2– 0.38 0.74* 0.73* 0.67* 0.44 0.37 0.30 0.67* 0.78* 0.34 Cl – 0.59* 0.58* 0.44 0.70* 0.32 0.36 0.74* 0.80* 0.72* 0.85* 0.74* NO 3 – 0.50* 0.53* 0.44 0.55* 0.30 0.63* 0.37 0.35 0.29 0.65* 0.60* 0.62* NH 4 + 0.38 0.27 –0.18 –0.15 –0.02 –0.17 0.26 0.29 0.36 –0.18 0.76* 0.63* 0.96* *Significant at p
< 0.01 (two-tailed
t
as well as personnel from the Air Quality Research Center, UC Davis, for writing assistance.
References
Alolayan M. A., K. W. Brown, J. S. Evans, W. S. Bouhamra
and P. Koutrakis, 2013. Source apportionment of fine
particles in Kuwait City. Sci. Total Environ. 448, 14-25. Ashraf N., M. Mushtaq, B. Sultana, M. Iqbal, I. Ullah
and S. A. Shahid, 2013. Preliminary monitoring of tropospheric air quality of Lahore City in Pakistan. Int. J. Chem. Biochem. Sci.3, 19-28.
Balakrishna G. and S. Pervez, 2009. Source apportionment of atmospheric dust fallout in an urban-industrial en-vironment in India. Aerosol Air Qual. Res.9, 359-367. Becker S., L. A. Dailey, J. M. Soukup, S. C. Grambow,
R. B. Devlin and Y. C. T. Huang, 2005. Seasonal
vari-ations in air pollution particle-induced inflammatory
mediator release and oxidative stress. Environ. Health Persp.113, 1032-1038.
Bhaskar B. V., R. V. J. Rajasekhar, P. Muthusubramanian and A. P. Kesarkar, 2008. Measurement and modeling of respirable particulate (PM10) and lead pollution over
Madurai, India. Air Qual. Atmos. Health.1, 45-55 Budhavant K. B., P. S. P. Rao, P. D. Safai and K. Ali, 2009.
Chemistry of monsoon and post-monsoon rains at a high altitude location, Sinhabad, India. Aerosol Air Qual. Res.9, 65-79.
Celo V. and E. Dabek-Zlotorzynska, 2010. Concentration and source origin of trace metals in PM2.5 collected at
selected Canadian sites within the Canadian National Air Pollution Surveillance Program. In: Urban air-borne particulate matter. Environmental science and engineering (F. Zereini and C. L. S. Wiseman, Eds.). Springer, Heidelberg, 19-38.
Chakraborty A. and T. Gupta, 2010. Chemical characteri-zation and source apportionment of submicron (PM1)
aerosol in Kanpur region, India. Aerosol Air Qual. Res.10, 433-445.
Cheung K., N. Daher, W. Kam, M. M. Shafer, Z. Ning, J. J. Schauer and C. Sioutas, 2011. Spatial and temporal variation of chemical composition and mass closure of ambient coarse particulate matter (PM10-2.5) in the Los
Angeles area. Atmos. Environ.45, 2651-2662. Colbeck I., Z. A. Nasir, S. Ahmad and Z. Ali, 2010. The
state of ambient air quality in Pakistan —a review. Environ. Sci. Pollut. Res.17, 49-63.
Han Y. J., S. K. Tae and H. Kim, 2008. Ionic constituents and source analysis of PM2.5 in three Korean cities.
Atmos. Environ. 42, 4735-4746.
Javed W., A. S. Wexler, G. Murtaza, Y. Zhao, H. R. Ahmad and M. M. Iqbal, 2015. Chemical characterization and source apportionment of total suspended particulate matter in Faisalabad, Pakistan. J. Environ. Sci. (sub-mitted).
Karar K., A. K. Gupta, A. Kumar and A. K. Biswas, 2006.
Characterization and identification of the sources of
chromium, zinc, lead, cadmium, nickel, manganese and iron in PM10 particulates at the two sites of Kolkata,
India. Environ. Monit. Assess.120, 347-360.
Mar T. F., T. V. Larson, R. A. Stier, C. Claiborn and J. Q. Koenig, 2004. An analysis of the association between respiratory symptoms in subjects with asthma and daily air pollution in Spokane, Washington. Inhal. Toxicol. 16, 809-815.
Mijic Z., A. Stojic, M. Perisic, S. Rajsic and M. Tasic, 2012. Receptor modeling studies for the characteriza-tion of PM10 pollution sources in Belgrade. Chem. Ind.
Chem. Eng. Q.18, 623-634.
Miranda J., T. A. Cahill, J. R. Morales, F. Aldape, J. Flores and R. V. Díaz, 1994. Determination of elemental con-centrations in atmospheric aerosols in Mexico-City using proton-induced x-ray-emission, proton elastic-scattering, and laser-absorption. Atmos. Environ. 28, 2299-2306. Mkoma S. L., G. O. Rocha, J. S. Domingos, J. V. Santos,
M. P. Cardoso, R. L. Silva and J. B. Andrade, 2014. At-mospheric particle dry deposition of major ions to the South Atlantic coastal area observed at Baía de Todos os Santos, Brazil. An. Acad. Bras. Cienc.86, 37-55. Mohammed M. P. and S. Namuduri, 2013. Trace elemental
composition in the atmospheric aerosols of Kakinada city, India. Sustain. Environ. Res.23, 315-324 Ni T., P. Li, B. Han, Z. Bai, X. Ding, Q. Wang, J. Huo and
B. Lu, 2013. Spatial and Temporal Variation of Chemi-cal Composition and Mass Closure of Ambient PM10 in
Tianjin, China. Aerosol Air Qual. Res.13, 1832-1846 Pakbin P., N. Hudda, K. L. Cheung, K. F. Moore and
C. Sioutas, 2010. Spatial and temporal variability of coarse (PM10-2.5) particulate matter concentrations in the
Los Angeles area. Aerosol Sci. Technol.44, 514-525, Pak-EPA/JICA, 2001. Three cities investigation of air
and water quality (Lahore, Rawalpindi & Islamabad). Pakistan Environmental Protection Agency/Japan International Cooperation Agency, June. Available at. http://www.environment.gov.pk/pub-pdf/3city-inv.pdf (last accessed on July 3, 2008).
Pak-EPA, 2012. The National Environmental Quality Standards (NEQS) for air. Pakistan Environmental Protection Agency, Ministry of Environment, Gov-ernment of Pakistan.
Pope III C. A., 2000. Review: Epidemiological basis for particulate air pollution health standards. Aerosol Sci. Technol.32, 4-14.
Ragosta M., R. Caggiano, M. Macchiato, S. Sabia, and S. Trippetta, 2008. Trace elements in daily collected
aerosol: level characterization and source identification
in a four-year study. Atmos.Res.89, 206-217
Shah M. H. and N. Shaheen, 2010. Seasonal behaviors in elemental composition of atmospheric aerosols collect-ed in Islamabad, Pakistan. Atmos. Res.95, 210-223. Shah M. H., N. Shaheen and R. Nazir, 2012. Assessment
of the trace elements level in urban atmospheric par-ticulate matter and source apportionment in Islamabad, Pakistan. Atmos. Pollut. Res.3, 39-45.
Shen Z. X., J. J. Cao, R. Arimoto, R. J. Zhang, D. M. Jie, S. X. Liu and C. S. Zhu, 2007. Chemical composition and source characterization of spring aerosol over Horqin sand land in northeastern China. J. Geophys. Res. 112, D14315, doi:10.1029/2006JD007991.
Shen Z., J. Cao, Z. Tong, S. Liu, L. S. S. Reddy, Y. Han, T. Zang and J. Zhou, 2009. Chemical characteristics of submicron particles in winter in Xi’an. Aerosol Air Qual. Res. 9, 80-93.
US-EPA, 1999. Selection, preparation and extraction of
filter material. In: Compendium of methods for the determination of inorganic compounds in ambient air.
Method IO-3.1. United States Environmental Protec-tion Agency, Cincinnati, OH, USA.
US-EPA, 1999. Determination of metals in ambient partic-ulate matter using Atomic Absorption (AA) spectrosco-py. In: Compendium of methods for the determination of inorganic compounds in ambient air. Method IO-3.2. United States Environmental Protection Agency, Cincinnati, OH, USA.
US-EPA, 2012. Revised air quality standards for particle pollution and updates to the Air Quality Index (AQI). United States Environmental Protection Agency,
Of-fice of Air Quality Planning and Standards, EPA 454/
R99-010. Available at: http://www.epa.gov/pm/2012/ decfsstandards.pdf.
WHO, 2005. WHO Air Quality Guidelines Global Update 2005 – Particulate matter, ozone, nitrogen dioxide and sulphur dioxide. World Health Organization, Regional
Office for Europe, Copenhagen. Available at: http://
www.euro.who.int/Document/E90038.pdf.
World Bank, 2006. Pakistan: Strategic country environ-ment assessenviron-ment, vol. II, report No. 36946-PK. World Bank, Washington.
Xia L. and Y. Gao, 2011. Characterization of trace ele-ments in PM2.5 aerosols in the vicinity of highways in
northeast New Jersey in the U.S. East Coast. Atmos. Pollut. Res.2, 34-44.
Yu L., G. Wang, R. Zhang, L. Zhang, Y. Song, B. Wu, X. Li. K. An and J. Chu, 2013. Characterization and source apportionment of PM2.5 in an urban environment in