TítuloAnalysis of pollution by heavy metals in sediments and species of commercial interest of the Galician coast
26
0
0
Texto completo
(2) Index Student's data......................................................................................................................................3 Objectives............................................................................................................................................3 1. Introduction......................................................................................................................................5 2. Materials and methods.....................................................................................................................7 2.1. Sampling and processing......................................................................................................................7 2.2. Physicochemical analysis ....................................................................................................................9 2.3. Chemical analyses................................................................................................................................9 2.4. Statistical analyses.......................................................................................................................9. 3. Results.............................................................................................................................................10 3.1. Grain size............................................................................................................................................10 3.2. Organic matter....................................................................................................................................10 3.3. Pollutant concentrations......................................................................................................................10 3.3.1. Biota...........................................................................................................................................10 3.3.2. Sediments....................................................................................................................................11 3.3.3. Metals.........................................................................................................................................12 3.4. Statistical analysis......................................................................................................................14. 4. Discussion.......................................................................................................................................15 5. Conclusions....................................................................................................................................17 Acknowledgements...........................................................................................................................17 References..........................................................................................................................................17 Appendix. Supplementary material................................................................................................20 Authorization....................................................................................................................................25. 2.
(3) Student's data Name and surname: Marta Gil Molinero Address: Phone number: e-mail: DNI: Objectives The main goal of this project was to compare the levels of heavy metals in sediment and different species of bivalves of commercial interest in Galicia, in a paper styled format. For this several tasks were outlined: . To organize the initial database by checking the correspondence between sites analysed for sediments and for organisms, eliminating those that did not match (in order to compare both matrices).. . To establish the total metal concentrations for each sample, normalizing the concentration in sediments by the background levels of the areas.. . To analyse the spatial pattern of metal pollution in both sediments and organisms.. . To analyse the correlation between the heavy metal levels on sediments and organisms.. . To look for guidelines of maximum allowed levels of metals in sediments and organisms and compare with the measured concentrations.. 3.
(4) Analysis of pollution by heavy metals in sediments. and. species. of. commercial. interest of the Galician coast.. Marta Gil Molinero Calle Campo 12A, 15180, A Coruña, 687130384, [email protected]. Abstract Concentration of different heavy metals was quantified for sediments and bivalves of commercial interest from four different areas of the. Galician coast (NW-Spain).. Analysed species were, Cerastoderma edule, Mytilus galloprovincialis, Ensis siliqua, Venerupis pullastra and. Ruditapes decussatus. Higher metal contamination in. organisms than in sediments show the bioaccumulation. ability of these bivalves,. specially in mussels (Mytilus galloprovincialis) and razor shells (Ensis siliqua). Although two sampled areas are nowadays included in Natura 2000 network (Corrubedo and Mandeo), in 2003, when sampled, they were highly polluted, specially Mandeo and organisms from Corrubedo, these may be and indicator of different wastes and heavy metal inputs in Mandeo and time recovering differences after an oil spill. All areas showed metal concentration above the sediment quality guidelines proposed values by the NOAA, numbers established by OSPAR, and concentrations established by the UE about seafood. Keywords: Heavy metals, Galicia, bivalves, sediment, contamination.. 4.
(5) 1. Introduction Galicia is located in the North-West of the. total fresh catches in 2013, being. Ruditapes. Iberian Peninsula and its coast cannot be described. decussatus the most abundant with the 25,45% of. as a whole, there are many variables and. the total captures. Also in 2013, the 70,09% of the. characteristics that define the different sampling. captured Ruditapes decussatus and the 47,85% of. regions. These variables are the climate, the local. Venerupis pullastra came from Arousa an area that. oceanography and the lithological characteristics. encloses several of the sampled stations in Riveira... (Santiago Rivas, 2007). Among these, the most. These species are very important for this economic. important characteristic for this study is the lithology. activity as. of the region as it will determine the sediment. pullastra and Cerastoderma edule were in 2013 the. enrichment by different metals. As a summary of the. 5th, 7th and 15th most important species for Galician. lithological information, there can be described three. fisheries.. Ruditapes decussatus, Venerupis. different coastal zones: the Cantabric part, which is. Both species of clams, Ruditapes decussatus. mainly composed by schists, gneiss, and also. and Venerupis pullastra live buried in the sand and. sedimentary and ultrabasic rocks; approaching the. mud in the Rías, Venerupis pullastra can be found. west coast, there is a wide part formed by the Golfo. from the low tide limit to 40 m depth , while. Ártabro, composed of granite and schists and the. Ruditapes decussatus, prefers to live between 15 and. west coast which is largely granitic (Carballeira et.. 20 cm depth of the intertidal zone. Cerastoderma. al 1997). In general terms, Galician coastline covers. edule lives just under the bottom surface on sand,. 1.195 Km from the Eo river in the border with. mud and gravel bottoms and it can be found from. Asturias to the Miño in Pontevedra, besides, Galicia. the intertidal zone to only a few meters depth (FAO),. 2. has 278 sandy areas as well as 70 million m of. razor shells (Ensis siliqua) also live buried in sandy. intertidal zone (Mahou Lago, 2008).. or muddy bottoms, on the contrary, mussels (Mytilus. Therefore, shellfishing is a very important. galloprovincialis) live fixed to the rocks, in dense. economic activity. The following species were. aggregations, in the intertidal zone or exposed, this. sampled, Mytilus galloprovincialis, Cerastoderma. characteristic together with both high filtration rate. edule, Ruditapes decussatus, Venerupis pullastra,. and bioaccumulation abilities makes mussels good. Ensis siliqua which Galician names are as follows:. organisms for monitoring the quality of the water. mexillón, berberecho, ameixa fina, ameixa babosa. column.. and longueirón. According to the data published by the. platform. with such economic importance, there is a high risk. (http//:www.pescadegalicia.com) the sum of the. of contamination as 40% of the population live in or. catches. Mytilus. near the Rías, and the main industrialized areas are. galloprovincialis) accounted for the 53,12% of the. also located nearby (Rubio et. al 2000). The. 5. Galician of. technological these. species. fishery. Despite of shellfishing being and activity. (except.
(6) through. photosynthesis and for the formation of the. atmospheric precipitation and dumping of urban and. erythrocytes and the immunological system of. rural waste is mostly responsible for the input of. vertebrates, though, in high concentrations, can be. trace metals into the marine environment, besides all. lethal. Chromium is also relatively abundant in the. the. the. Earth's crust and it is essential for animals. Mercury. construction of hotels, and urban and recreational. is the only element that can occur in a liquid and. areas.. vapour phase at ambient temperature. It is. industrial. waste. sedimentary. reaching. changes. the. sea. produced. by. Water analyses are the obvious methods for. characterized by its high toxicity in virtually all. determining the degree of pollution, but these tests. pathways; inhalation, ingestion, contact dermal.... aren't easy to perform, metal concentrations are very. besides the damage it does, particularly in the. low and samples can be contaminated during the. nervous system, with the emergence of epilepsy, but. sampling process, consequently these analyses are. also for causing dementia, and death caused by. not very efficient. However, metals are easily fixed. severe poisoning. In addition, it is one of the trace. to suspended solid materials, and thus it will lead to. elements with lower representation in the Earth's. their incorporation to the sediments (Rubio et. al. crust. Vanadium is an ubiquitous element in the. 2000). For this reason, sediments accumulate. lithosphere, presenting a significant dispersion, due. contaminants and might act as long-term stores for. to that, it might appear in more than 60 different. metals in the environment (Spencer et. al 2002).. minerals. This element isn't considered very toxic,. Metal ions can be incorporated into food chains and. but can produce harmful effects on several species.. concentrated in aquatic organisms to a level that. Zinc is also widely distributed and it is an essential. affects their physiological state. Heavy metals have. micronutrient, yet in high amounts it might be. a drastic environmental impact on all organisms.. phytotoxic. Manganese is a metallic transition. Although trace metals such as Zn, Cu and Fe play a. element, very abundant in the lithosphere, with the. biochemical role in the life processes of all aquatic. exception of iron, its concentrations are usually. plants and animals; therefore, they are essential in. higher than other micronutrients. Its importance lies. the aquatic environment in trace amounts (Saeed et.. in the fact that it is a part of enzymes such as. al 2008).. oxidoreductases, transferases or hydrolases. Cobalt,. In this study the metals that were studied are. also a metallic transition element, is quite abundant,. Vanadium, Arsenic, Copper, Chromium, Zinc,. it is essential for animals as it is a part of the vitamin. Manganese, Cobalt, Barium, Lead, Boron and. B12. It is important as well for blue-green algae and. Mercury. Arsenic is one of the most dangerous. nitrogen fixing organisms, but not for plants.. elements because of its toxicity. The intake over. Barium is relatively abundant as a constituent of. long periods can lead to chronic arsenic poisoning. different minerals. Lead has a low bioavaiability,. and it is one of the few substances that have been. however, in industrial or urban areas, concentrations. shown to cause cancer in humans (WHO, 2010).. in air and soil are frequently enough high to produce. Copper is relatively abundant on the lithosphere, it. toxic effects on humans and organisms. Boron is a. is an essential element for living organisms, both in. trace element essential for plants (Vázquez et. al. animal and plants, as it is very important for the. 2008).. 6.
(7) Table 1 Sampled areas in this study and analysed species for each of them, with the correspondent sampling dates and coordinates for each station.. 1. Rd: Ruditapes decussatus, Ce: Cerastoderma edule, Mg: Mytilus galloprovincialis, Vp: Venerupis pullastra, Es: Ensis siliqua.. 2. Materials and methods This area is included in Natura 2000 network (DOG. 2.1. Sampling and processing Sediment samples and organisms were. nº62 21/03/2014). O Burgo, located in Ría de O. collected from April to July 2003 in four Galician. Burgo (B1 to B4) formed at the mouth of the river. shellfishing areas with high social and economic. Mero is a sheltered zone with typical estuarine. relevance,. characteristics and a large population, it has. O. Burgo,. Mandeo,. Riveira. and. Corrubedo. Several locations were selected within. historically. been. each area (Fig.1, Table 1) according to their. contamination. environmental characteristics and degree of human. shellfishing in this area has been banned due to the. impact.. presence of toxic muds, high microbiological. and. impacted urban. by. waste.. industrial Nowadays,. The area of Mandeo (site M) is located. contamination, spills and also lipophilic toxins like. within the Ría de Betanzos, currently one of the. ASP produced by red tides (www.intecmar.org).. largest marshlands in Galicia, still has a small port. Riveira (R1 to R4) is a very exposed area with a. and boats, at the confluence of the rivers Mendo and. considerable population, and high density as this. Mandeo embrace the urban area (www.turgalicia.es). municipality is not very large. It has a very. 7.
(8) important artisinal fishing harbour and is the site of a. November. large number of canned fish industries. Corrubedo. sampling, the area was heavily impacted by the. (C1 to C3) is an area with typical oceanic. Prestige oil spill. Various cleaning operations with. characteristics. different gears were carried out in the area, which. and. a. small. population,. but. 2002,. several. months. before. the. frequented by tourists. Due to its ecological and. altered coastal sediments.. Organisms where. environmental attributes its is included in Natura. collected when available. The main ones were. 2000 network (DOG nº62 21/03/2014). However, in. mussels (Mytilus galloprovincialis),. Fig.1. Map of the Galician coast (NW Spain) showing the main sampling locations and areas. Mandeo (M), O Burgo (B1 to B4), Ribeira (R1 to R4) and Corrubedo (C1 to C3). Obtained from Fernández et. al 2013. clams. (Venerupis. pullastra. and. Ruditapes. individual maximum shell length was individually. decussatus), cockles (Cerastoderma edule), and. recorded, and then, pools (3-10 individuals) of shell-. razor shells (Ensis siliqua). These species were. free organisms were frozen at -30ºC in amber glass. collected by hand then cleaned eliminating the. vessels previously rinsed with 5% nitric acid for 48. stomach contents by being kept in 15-20 μm filtered. hours.. seawater for 48 hour (24 h for mussels). The. 8. Sediments were sampled at low tide using a.
(9) PVC core tube (Ø 4.5 cm), transported to the. laser Beckman coulter (Coultronics France), through. laboratory on ice and stored at 4ºC in the dark until. 500–250, 250– 125, 125–62, 62–31, 31–16, 16–8. use no more than 48 h after sampling. The sample. and 8–0 μm. The organic matter content (% OM). cores were then transferred to glass jars and dried at. was estimated by dry sediment combustion at 500ºC. room temperature for chemical analysis. As the. for 4 h.. sampling sites are areas where the sediments are often turned over for shellfishing, a randomly. 2.3. Chemical analyses. selected 15 cm layer was used for the analyses. A total of 22 metals were analysed per. instead of the 2–3 cm of surface sediment usually. sample. All analyses were carried out by the. collected for contamination studies.. independent laboratory of the Servizos de Apoio á. The concentration of those metals whose. Investigación (SAI) of the University of A Coruña.. concentration was under the detection limit of the device used to measure them, was assumed to be. 2.4. Statistical analysis. half of the limit of quantification (LOQ), the limit of. With the aim of determinating if the. quantification. The concentration from the sediments. pollution produced by the different metals was. was normalized vy its background levels, based on. caused by the same source, several correlations were. the. carried, creating a correlation matrix and then the. pedological,. geological. and. chemical. characteristics of the soil (Vázquez et. al 2008).. Pearson's product-moment correlation, all this after checking data normality with. 2.2. Physicochemical analysis The dried sediment was sieved to obtain. the Shapiro-Wilk. normality test. Correlations were made between each metal concentration in organisms, sediments, grain. fractions >1000; 1000– 500 and <500 μm. The size. size and percentage of organic matter.. distribution <500 μm was determined using a light-. R 3.0.1 was used for all the analysis.. scattering particle size analyser Coulter LS 200 by. 3. Results. 3.1. Grain size. larger, as the 49% is between 250 and 125 μm and. Fig.2 Shows the grain size composition and. 39% is between 500 and 250 μm, being classified as. organic matter percentage for the different areas.. fine and medium sand. Mandeo has the most. 71% of the sediments from O Burgo have a grain. homogeneous grain sizes but it has an important part. size between 250 and 125 μm, and thus could be. of very fine sand (0.10 – 0.05 mm).. classified as fine sand (0.25 – 0.1 mm) according to the USDA classifications. Corrubedo is also mainly. 3.2. Organic matter. composed of fine sand as the 61% of the sediments. The highest organic matter content was. are between the same sizes. In Riveira particles are. found in Mandeo (7.53%). In the other areas the. 9.
(10) content of organic matter ranged from 1.09% to. 2.79% (Fig. 3 ).. 100% 80% 60% 40% 20% 0% 121212121212121212121212 B1 B2 B3 B4 M R1 R2 R3 R4 C1 C1C2 C3. < 8 µm 16-8 µm 31-16 µm 62-31 µm 125-62 µm 250-125 µm 500-250 µm. Fig.2. Grain size distribution. ((1)Surface strata 0-15 cm, (2) Deep strata 16-30 cm) from the areas of O Burgo (B1-B4), Mandeo (M), Riveira (R1-R4) and Corrubedo (C1-C3).. 10,00 8,00 6,00 4,00 2,00 0,00 1 2 1 2 1 2 1 2 1 2 1 2 1 2 1 2 1 2 1 2 1 2 1 2 B1 B2 B3 B4 M R1 R2 R3 R4 C1C1 C2 C3. Fig. 3. Organic matter percentage. ((1)Surface strata 0-15 cm, (2) Deep strata 16-30 cm) from the areas of O Burgo (B1-B4), Mandeo (M), Riveira (R1-R4) and Corrubedo (C1-C3). contaminants in their tissues with respect to the. 3.3. Pollutant concentrations3.3.1. Biota Organisms from O Burgo have the lowest. ambient level (Casas et. al 2006). In O Burgo and. concentration of pollutants (never reaching 1ppm in. Mandeo (the area where this mussel was collected). total). However in Mandeo, Riveira and Corrubedo. its total pollutant concentration is almost 3 times. the total average concentration of the different heavy. higher than the other organisms. However the. metals is close to 107.000 ppm (Fig.4 and 5).. pollutant concentration of Venerupis pullastra from. Mytilus galloprovincialis, is the most polluted. Riveira and Ensis siliqua from Corrubedo is not very. organism, probably due to its ability to concentrate,. high, it is respectively 2.35 and 35.1 times higher. and. than their surrounding sediments, showing the. 10. under. certain. conditions,. accumulate.
(11) bioaccumulation. Mandeo is the most polluted, with a total average. abilities, in lower extent than mussels, when their. concentration (different depths) of heavy metals on. environment is polluted.. the sediments of 221.350,32 ppm, 1,4, 4,9, and 71,7. possibility. of. having. similar. times higher than the total average concentration in the other areas, O Burgo, Riveira and Corrubedo. 3.3.2. Sediments The station of Souto (M) from the area of. respectively. This also shows that, in comparison,. Concentration (ppm). the pollution in Corrubedo is very low.. 0,60 0,40 0,20 0,00 Rd Ce Mg Vp Rd Ce Rd Mg Ce Vp Rd Ce B1 B2 B3 B4. Hg Pb Co As Cu V. B Ba Mn Zn Cr. Stations and species. Concentration (ppm). Fig .4. Heavy metals on Galician shellfish commercial species from O Burgo (stations B1 to B4). Rd: Ruditapes decussatus, Ce: Cerastoderma edule, Mg: Mytilus galloprovincialis, Vp: Venerupis pullastra, Es: Ensis siliqua.. 300000 200000 100000 0 Rd Mg Ce Vp Vp Vp Vp Es Es Es M R1 R2 R3 R4 C1 C2 C3. Hg Pb Co As Cu V. B Ba Mn Zn Cr. Stations and species. Fig.5. Heavy metals on Galician shellfish commercial species from Mandeo (M), Riveira (R1-R4) and Corrubedo (C1-C3). Rd: Ruditapes decussatus, Ce: Cerastoderma edule, Mg: Mytilus galloprovincialis, Vp: Venerupis pullastra, Es: Ensis siliqua. Looking. at. the. concentration. on. the. contaminated than the previous stations. Corrubedo. sediments of each station, it shows up, that the site. has the lowest total average concentration of metals.. B4 from O Burgo, is equally or more polluted than. On the other hand, if we look at the different strata. Mandeo, in Riveira the total average concentration,. were the sediment samples were collected (Fig. 6),. increases from R1 to R4 (from the inside to the. from 0 to 15 cm and from 16 to 30 cm, comes out. outside of the ría) being R4 2,5 times more. that in O Burgo, the surface sediments are more. 11.
(12) polluted than the deep ones, the metal concentration. Corrubedo, the difference of the concentration. of the upper strata is 1,5 higher than the lower strata.. between the sediments of different depths is. In Riveira is the opposite, the deep strata is 1,45. minimum,. times more polluted than the surface strata, this. concentration of the surface sediments is again. difference is higher at the station R4 were the. higher than the deep sediments, specifically,. concentration of the deep strata is 2,2 times higher.. times higher.. nevertheless,. in. C2. the. metal 1,8. Concentration (ppm). For the stations M, C1 and C3 of Mandeo and. 300000 200000 100000 0 121212121212121212121212 B1 B2 B3 B4 M R1 R2 R3 R4 C1 C2 C3. Hg Pb Co As Cu V. B Ba Mn Zn Cr. Stations and strata. Fig.6. Heavy metal concentrations of both stratafrom the areas of O Burgo (B1-B4), Mandeo (M), Riveira (R1-R4) and Corrubedo (C1C3). (1)Surface strata 0-15 cm, (2) Deep strata 16-30 cm. B.. 3.3.3. Metals. It is also very correlated to the organic. 3.3.3.1. Vanadium There were 22 sediment samples (Table 2). matter percentage and the grain size.. which were below the LOQ, only 2 samples had a significant concentration, an average of. 32.852. 3.3.3.2. Chromium There were 21 sediment samples which were. ppm, being the second highest total concentration. The average concentration on the different. below the LOQ, only 2 samples had a significant. organisms was 1.449 ppm, being 3.187 ppm for. concentration, an average of 29.762 ppm, being the. Mandeo, Riveira, and Corrubedo and 1,7.10 -3 ppm. third highest total concentration. The average concentration on the different. for O Burgo, it was the fourth highest total. organisms was 368 ppm, being 810 ppm for. concentration. Its concentration in the sediments was highly. correlated. (p-value<0,01)with. the. concentration of Zn and Co. On the other hand its. Mandeo, Riveira, and Corrubedo and 9,5.10 -4 ppm for O Burgo, it was the fifth highest total concentration. Its concentration in the sediments was. concentration on different bivalves was highly correlated (p-value<0,01) with Cr, Cu, Zn, Hg and. 12. highly. correlated. (p-value<0,01)with. the.
(13) concentration of Cu, Co Zn and V. On the other. correlated (p-value<0,01) with As, Cr, Cu, Co, Pb,. hand its concentration in different bivalves was. Hg and V. It is also very correlated to the organic. highly correlated (p-value<0,01) with As, Cu, Co,. matter percentage and the grain size.. Hg, Zn, Pb and V. It is also very correlated to the organic matter percentage and the grain size.. 3.3.3.5. Arsenic. 3.3.3.3. Copper One sediment sample was below the LOQ,. There were 22 sediment samples which were below. 23 samples had a significant concentration, an. the LOQ, only 2 samples had a significant. average of 4.449 ppm, being the tenth highest total. concentration, an average of 6.791 ppm, being the. concentration.. ninth highest total concentration.. The average concentration on the different. The average concentration on the different. organisms was 3.266 ppm being 7.186 ppm for. organisms was 6.795 ppm being 15.346 ppm for. Mandeo, Riveira, and Corrubedo and 1,1.10 -2 ppm. Mandeo, Riveira, and Corrubedo and 2,6.10 -2 ppm. for O Burgo, it was the third highest total. for O Burgo, it was the second highest. concentration.. concentration. Its concentration in then different bivalves. Its concentration in the sediments was highly. correlated. (p-value<0,01)with. the. concentration of Cr. On the other hand its. total. was highly correlated (p-value<0,01) with the concentration of Cr, Co, Cu, Zn and Hg.. concentration in different bivalves was highly correlated (p-value<0,01) with Zn, Pb, Co, Hg and. 3.3.3.6. Manganese Only in the stations from O Burgo sediments. V. It is also very correlated to the organic matter percentage and the grain size.. were sampled and analysed, 8 in total counting both strata, they had an average concentration of 97.912 ppm, being the highest total concentration. The average concentration on the different. 3.3.3.4. Zinc There were 7 sediment samples which were. organisms in O Burgo, the only area that were 9,6.10-3 for , the tenth highest total. below the LOQ, 17 samples had a significant. analysed was. concentration, an average of 28.417 ppm, being the. average concentration. Its concentration in the sediments was. fourth highest total concentration. The average concentration on the different organisms was 40.627 ppm, being 89.379 ppm for. highly. correlated. (p-value<0,01)with. the. concentration of Zn.. Mandeo, Riveira, and Corrubedo and 1,4.10 -1 ppm for O Burgo, it was the highest total concentration. Its concentration in the sediments was highly. 3.3.3.7. Cobalt All samples had a significant concentration. correlated (p-value<0,01)with the concentration of. with an average 7.152 of. Cr, Co, Hg, B and V. On the other hand its. highest total concentration.. concentration in different bivalves was highly. 13. ppm, being the tenth. The average concentration on the different.
(14) organisms was 261 ppm being 574 ppm for Mandeo, Riveira, and Corrubedo and 6,6.10 -4 ppm for O Burgo,. it. was. the. second. highest. 3.3.3.10. Boron There were only 8, they had an average. total. concentration of 8.778 ppm, being the seventh. concentration. Its concentration in the sediments was. highest total concentration.. the. The average concentration on the different. concentration of Cr, Zn and V. On the other hand its. organisms in O Burgo, the only area that were. concentration in different bivalves was highly. sampled was. correlated (p-value<0,01) with As, Cr, Cu, Zn, Ba,. concentration.. highly. correlated. (p-value<0,01)with. 2,2.10-2 for , the ninth highest total. Its concentration in the sediments was. and Pb. It is also very correlated to the organic. highly. correlated. (p-value<0,01)with. the. concentration of Zn and Mn. On the other hand its. matter percentage and the grain size.. concentration in different bivalves was highly correlated (p-value<0,01) with V.. 3.3.3.8. Barium Stations from O Burgo were the only sites were sediments and organisms were sampled and. 3.3.3.11. Mercury. then analysed for this element, they had an average. There were 20 sediment samples which were. concentration of 13.441 ppm, being the fifth highest. below the LOQ, only 4 samples had a significant. total concentration.. concentration, an average of 121 ppm, being the. The average concentration on the different. lowest total concentration.. organisms in O Burgo was 1,7.10 -3, the lowest total. The average concentration on the different organisms was 33 ppm, being 73 ppm for Mandeo,. concentration. Its concentration in the different bivalves was highly correlated (p-value<0,01) with the. Riveira, and Corrubedo and 1,6.10-4 ppm for O Burgo, it was the eight highest total concentration. Its concentration in the sediments was. concentration of Co. highly. correlated. (p-value<0,01)with. the. concentration of Zn. On the other hand its. 3.3.3.9. Lead All samples had a significant concentration. concentration in different bivalves was highly. with an average 9.423 of ppm, being the sixth total. correlated (p-value<0,01) with As, Cr, Cu, Zn, Hg,. concentration.. and V.. The average concentration on the different organisms was 318 ppm being 700 ppm for Mandeo,. 3.4. Statistical analysis. Riveira, and Corrubedo and 6,6.10 -3 ppm for O Burgo,. it was. also the. sixth highest. total. concentration.. The Shapiro-Wilk normality test showed that all the variables (the analysed metals) had a normal. distribution. (p-value<0,01).. Pearson's. Its concentration in the different bivalves. correlation test applied to the metal concentrations. was highly correlated (p-value<0,01) with the. for both sediments and biota did not show any. concentration of Cu, Cr, Co, Zn and Hg.. significant correlation, however the resulting p-value. 14.
(15) for the correlation between Zinc from both. significant correlation (p-value<0,01) and 4 had a. sediments and organisms was 0,08, thus, not. weak correlation (0,01<p-value<0,05). The other. significant. The same analysis for both correlations. two correlations carried between the metals and the. between metals and organic matter and metals and. sediment concentrations and between metals and. the grain size (the percentage with a size between. their concentration in the different organisms. 125 and 250 μm) was significant for the same. showed similar results. In the first case, 10. metals, Chromium, Copper, Cobalt, Vanadium and. combinations were significantly correlated (p-. Zinc, all the p-values were lower than 0,01, with the. value<0,01) and 4 had a weak correlation (0,01<p-. exception of Zinc for the correlation with the grain. value<0,05). In the case of the concentration on the. size, that was between 0,01 and 0,05. The analysis. organisms, tests showed that 25 out of the 55. carried between all the different metals from. possible. sediments and biota showed many correlations, 35. correlated (p-value<0,01) , and again 4 had a weak. out of the total 55 different combinations had a. correlation (0,01<p-value<0,05).. metal. combinations. were. strongly. 4. Discussion The most polluted area was Mandeo (M) for. organisms from the other sampled areas, does show. both sediments and bivalves. Stations from O Burgo. their bioaccumulation ability, since the metal. also had high metal concentrations in sediments, but. concentration in their tissues is higher than the. there were low for the organisms. Riveira and. concentration measured on the sediments.. Corrubedo had the lowest concentrations in their. Studies of monitoring are mainly focused on coastal. sediments, specially Corrubedo. Referring the. areas, like those ones that were sampled for this. differences found in the metal concentration of the. study, because the response of the ecosystem to. different strata, the upper stratum from B2 (O. pollution control measures can be best assessed. Burgo) and the deep stratum from R4 (Riveira) had. there, close to discharge and emission sources.. concentrations that stand out above the rest.. Bivalve molluscs, in particular mussels (in our case. Organisms from O Burgo had the lowest. the species Mytilus galloprovincialis), constitute one. concentration of metals in their tissues, 550.000. of the best biological indicators of coastal pollution. times lower than the rest of the organisms sampled ,. because. the average concentration was 0,21ppm. This,. advantageous characteristics like their sedentary. together with the fact that it is the second most. nature, wide geographical distribution, in general. polluted area (average metal concentration of. there are enough individuals at the sampling sites ,. 155.000 ppm) could reveal an error during the. they can be sampled easily and of course because. sampling of the organisms, since bivalves have high. they accumulate pollutants as contaminant levels in. bioaccumulation capacities and thus are used for. their tissue respond to changes in the environmental. monitoring, and the data of the organisms of this. levels. area does not reflect it.. metabolic transformation (Besada et. al 2011).. Metal concentration on the rest of the. 15. they. and. exhibit. pollutants. several. accumulate. unsurpassed. with. little. Mussels from this study came to have the highest.
(16) sediment quality guidelines (SQGs) intended to be. metal concentration among all the bivalves. supplementary. used, among other things, for compare the degree of. material) showed that in both sediments and. contamination among sub-regions and to identify. organisms. was. chemicals elevated in concentration above the. correlated, but looking at the metal correlations in. guidelines that were also associated with measures. sediments and organisms separately, it comes up the. of adverse effects (See supplementary material).. number of correlations in sediments is much smaller,. They established two factors to compare our data,. this could mean that metals found in organisms, and. the ERL and the ERM. The ERL or “Effects Range-. their concentration, are assimilated in a similar way,. Low” are the 10th percentile values and indicate. and thus many of them are correlated. However, in. concentrations below which adverse effects rarely. the sediments, there are not so many correlated. occur, the ERM are the “Effects Median-Range”. metals because of they may have came from. and they are the 50th percentile which represent. different discharges, with different concentrations of. concentrations above which effects frequently occur.. metals and thus not being related to each other.. Al the data that were above the LOQ were, in. Correlation many. tests. (See. metals'. concentration. The same metals are correlated to the. general, much higher than the ERMs. However,. percentage of organic matter and with the grain size. these guidelines just gives us illustrative values as,. between 125 and 250 μm, Co, Cr, Cu, V and Zn. The. they are American and thus have reference values. accumulation of heavy metals in sediment is. from the local sediments.. controlled by the granular composition of sediment.. OSPAR convention has also created an. Grain size affects the surface area, settling velocity. Agreement on Background Concentrations for. and depositiong rate of suspended solids in the water. Contaminants in Seawater, Biota. column, as well as the degree of chemical. (OSPAR, 2005-6), were they define the term. partitioning onto the sediment. Metals are generally. “Background concentrations” or BCs, which are. found to be associated largely with the fine grain. assessment. fraction of sediment that has been traditionally used. concentrations of certain hazardous substances that. to study the pollution of heavy metals in sediments.. would be expected in the North-East Atlantic if. However, heavy metals sometimes accumulate in the. certain industrial developments had not happened.. coarse grain fraction sediment (Lin et. al 2003). In. Mussels from O Burgo have concentrations below. these case the linear correlation coefficient was. the range background concentration but no those. negative, showing that contaminants accumulate in. ones from Mandeo.. tools. intended. to. and Sediment. represent. the. the finer sediment fraction. Regarding to the. The European Union has also created a list. organic matter, the most polluted area is also the. with the Heavy Metal Maximum Contents in food. one with the highest content of organic matter,. products (UE, 2014), it includes the legislation for. which agrees with the fact that metals are easily fixed to suspended solid materials, and thus incorporated to the sediments. The National Oceanic and Atmospheric Administration. 16. (NOAA,. 1999). have. created. the EU countries but also the limit concentrations for other countries outside the European Union. According to this list, the allowed content for lead is exceeded by the clams and mussels from Mandeo. The concentration of Mercury is exceeded by all the.
(17) species from Riveira and the mussels and clams. material). Prego et. al (2003), measured metal. from Mandeo, but not the cockles. The contents of. concentrations in sediments and organisms from. As, Cu, Cr are also exceeded by all the species from. different parts of Galicia, data from the Rías that. Mandeo, Riveira and Corrubedo.. both reports have analysed compared with the. Different reports, of the same topic show. analysed samples in this study shows again that our. lower metal concentrations in the Rías of Betanzos,. measured concentrations for both sediments and. Coruña and Arousa, areas were our stations were. organisms are much higher.. located. Saavedra et. al (2004), in their study, they. After the comparison of the data with these. explain that Redondela, in the inner part of Ría de. guidelines and values, it shows up the worrisome. Vigo, appears to be a major point of contamination. fact that almost all the samples had metal. as it has the highest industrial and urban activity in. concentrations that exceeded, by far, the acceptable. Galicia, for this, they used mussels to measure the. concentrations, consequently, these ecosystems and. concentration of different metals, in our case,. their equilibria might be endangered as well as the. mussels from Mandeo, exceed measured values in. people from these areas.. Redondela in a great extent (See supplementary. 5. Conclusions The data and results provided by this study,. have really high concentrations and organisms have. about heavy metals on sediments and bivalves from. the lowest. These disparities in O Burgo may reflect. the Galician coast, agrees with the conclusions of. either a lack of metal bioavailability due to physic-. other reports about metal contamination, reinforcing. chemical local conditions or an error during the. the fact that these areas are polluted by giving new. sampling or processing of the samples. information about the situation of the studied areas.. In the contrary Riveira and Mandeo showed. Despite of the scarcity and unbalanced data. a high consistency in correlations among metals in. some certain statements can be performed: bivalves'. both organisms and biota and also organic matter. bioaccumulation abilities result in the correlation of. and grain size, showing that for an adequate. the accumulated metals. The lack of metal. assessment, this factors should be taken into. correlation on sediments could be a proof of. account;. different metal inputs. Mandeo is the most polluted. This study also supports the use of bivalves. area for both organisms and sediments. Sediments. for environmental monitoring, specially mussels. from. metal. (and razor shells must be explored), and contributes. concentrations although razor shells show similar. with new data on the situation of this areas and how. values than those measured in other species in. this species of high commercial interest are affected. Mandeo; O Burgo, it is the opposite case, sediments. by inputs from different sources.. 17. Corrubedo. have. the. lowest.
(18) Acknowledgements I would like to thank Ramón Muíño and Nuria Fernández for all the advices, support and the Marine Resources and Fisheries Research Group of the Faculty of Sciences from University of a Coruña, for the provided data.. References Besada, V., Andrade, J.M., Schultze, F., González,. Instituto tecnolófico para para o control do Medio. J.J., 2011. Monitoring of heavy metals in wild. Mariño en Galicia <http//:www.intecmar.org>.. mussels (Mytilus galloprovincialis) from the Spanish North-Atlantic coast. Constinental Shelf Research,. Lin, J.G., Chen, S.Y., Su, C.R., 2003. Assessment of. 31, p.457-465.. sediment toxicity by metal speciation in different particle-size fractions of river sediment. Water. Carballeira, A., Carral, E., Puente, X.M., Villares,. Science and Technology, 47(7), p.233-241.. R., 1997. Estado de la conservación de la costa de Galicia. Nutrientes y metales pesados en sedimentos. Mahou Lago, J.M., 2008. Implementación y. y. de. Gobernanza: La política del Marisqueo en Galicia.. Galicia,. Escola galega de administración pública (EGAP).. organismos. Santiago. de. intermareales. Compostela,. Universidade. Xunta. de. Consellería de Pesca, Marisqueo e Acuicultura.. Santiago de Compostela, p.310.. Casas, S., Bacher, C., 2006. Modelling trace metal. NOAA, 1999. Sediment quality guideline developed. (Hg and Pb) bioaccumulation in the Mediterranean. for the National Status and Trend Programs.. mussel,. <http//:http://ccma.nos.noaa.gov/publications/sqg.pd. Mytilus. galloprovincialis,. applied. to. environmental monitoring. Journal of Sea Research,. f>.. 56 (2), p.168-181. OSPAR,. 2005-6.. Agreement. on. background. Cobelo-García, A., Labandeira, A., Prego, R., 2005.. concentrations for contaminants in seawater, biota. Dos casos opuestos en la acumulación de metales en. and sediment.. el sedimento de una ría: Ferrol y Corme-Laxe (Galicia, NO Península Ibérica). Ciencias Marinas. Plataforma Tecnolóxica da pesca. Consellería do. 31 (4), p.653–659.. medio rural e do mar. Xunta de Galicia. <http://www.Pescadegalicia.com>.. Food and Agriculture Organization of the United Nations <http//: http://www.fao.org>.. Prego, R., Cobelo-García, A., 2003. Twentieth century overview of heavy metals in the Galician. 18.
(19) Rías. (NW. Iberian. Peninsula).. Environmental. Xunta de Galicia, 2014. Decreto 37/2014, de 27 de Marzo, por el que se declaran zonas especials de. pollution, 121, p.425-452.. conservación los lugares de importancia comunitaria R Core Team, 2013. R: A language and environment. de Galicia y se aprueba el Plan director de la Red. for. Natura 2000 de Galicia. Diario Oficial de Galicia,. statistical. Statistical. computing.. Computing,. R. Foundation. Vienna,. Austria.. for <. 62, p. 13472.. http://www.R-project.org>. Spencer, K.L., MacLeod, C.l., 2002. Distribution Rivas, S.S., 2007. Contribución a la determinación. and partitioning of heavy metals in estuarine. de la fracción de metales traza ligados a las proteínas. sediment cores and implications for the use of. similares a las metalotioneínas en muestras de. sediment quality standards. Hydrology and Earth. mejilló. Santiago de Compostela: Universidade.. System Sciences, 6(06), p.989-998.. Servizo de Publicacións e Intercambio Científico. ISBN: 978-84-9750-858-2. UE, 2014. Contenidos máximos en metales pesados en. productos. alimenticios.. Rubio, B., Nombela, M.A., Vilas, F., 2000.. <http//:http://plaguicidas.comercio.es/MetalPesa.pd. Geochemistry of major and trace elements in. >.. sediments of the ría de Vigo (NW Spain): an assessment of metal pollution. Marine Pollution. Vázquez, F.M., De Anta, R.C., 2008. Niveles. Bulletin, 40, p.968–980.. genéricos de referencia de metales pesados y otros elementos traza de suelos de Galicia. Xunta de. Rubio, B., Nombela, M.A., Vilas, F., 2000. Heavy. Galicia,. metal pollution in the Galician Rías Baixas: new. Desenvolvemento Sostible.. Consellería. de. Medio. Ambiente. e. background values for Ría de Vigo (NW Spain). Journal of Iberian Geology, 26, p.121-141.. WHO, 2010 Preventing disease through healthy environments. Exposure to arsenic: A major public. Saavedra, Y., González, A., Fernández. P., Blanco, J.,. health. 2004. Interspecific variation of metal concentrations. http://www.who.int/ipcs/features/arsenic.pdf>.. concern.. <http//:. in three bivalve mollusks from Galicia. Archives of Environmental Contamination and Toxicology, 47, p.341-351.. Xunta de Galicia (2014, March 31). BetanzosMandeo.. Retrieved. Saeed, S.M., Shaker, I.M., 2008. Assessment of. <http//:http://www.turgalicia.es/ficha-recurso?. heavy metals pollution in water and sediments and. langId=es_ES&cod_rec=16869&ctre=9>.. their effect on oreochromis niloticus in the northern delta lakes. 8th International Symposium of Tilapia in Aquaculture. 19. from:.
(20) 20.
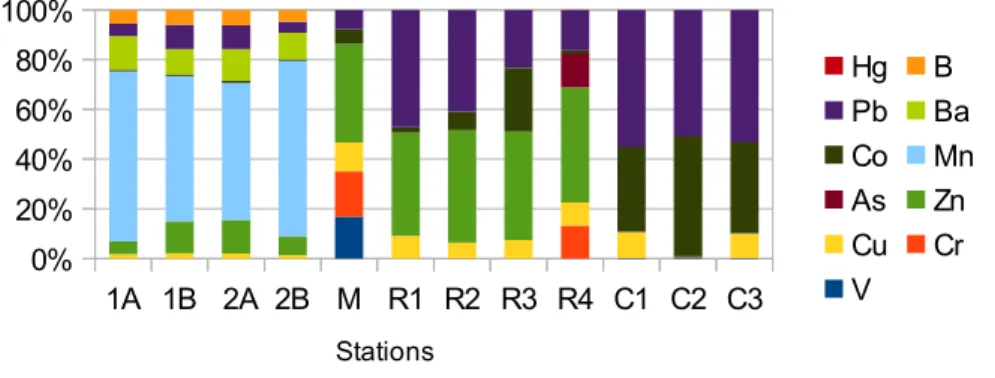
(21) Appendix. Supplementary material Fig. 1. Heavy metals from surface sediments (0 to 15 cm depth) from the areas of O Burgo (B1 to B4), Mandeo (M), Riveira (R1-R4), Corrubedo (C1-C3), contribution of each metal to the total metal content. 100% 80%. Hg Pb Co As Cu V. 60% 40% 20% 0% B1 B2 B3 B4 M R1 R2 R3 R4 C1 C2 C3. B Ba Mn Zn Cr. Station. Fig. 2. Heavy metals from deep sediments (16 to30 cm depth) from the areas of O Burgo (B1 to B4), Mandeo (M), Riveira (R1-R4), Corrubedo (C1-C3), contribution of each metal to the total metal content.. 100% 80%. Hg Pb Co As Cu V. 60% 40% 20% 0% 1A 1B 2A 2B M R1 R2 R3 R4 C1 C2 C3. B Ba Mn Zn Cr. Stations. Fig. 3. Heavy metals on Galician shellfish commercial species from the areas of O Burgo (B1 to B4), Mandeo (M), Riveira (R1-R4), Corrubedo (C1-C3), contribution of each metal to the total metal content. Rd: Ruditapes decussatus, Ce: Cerastoderma edule, Mg: Mytilus galloprovincialis, Vp: Venerupis pullastra, Es: Ensis siliqua.. 100% 80% 60% 40% 20%. 21. Vp. R1R2R3R4C1C2C3. Es. M. Es. Ce. B4. Vp. B3. Vp. Mg. Ce. B2. Mg. B1. Vp. Ce. 0%. Hg Pb Co As Cu V. B Ba Mn Zn Cr.
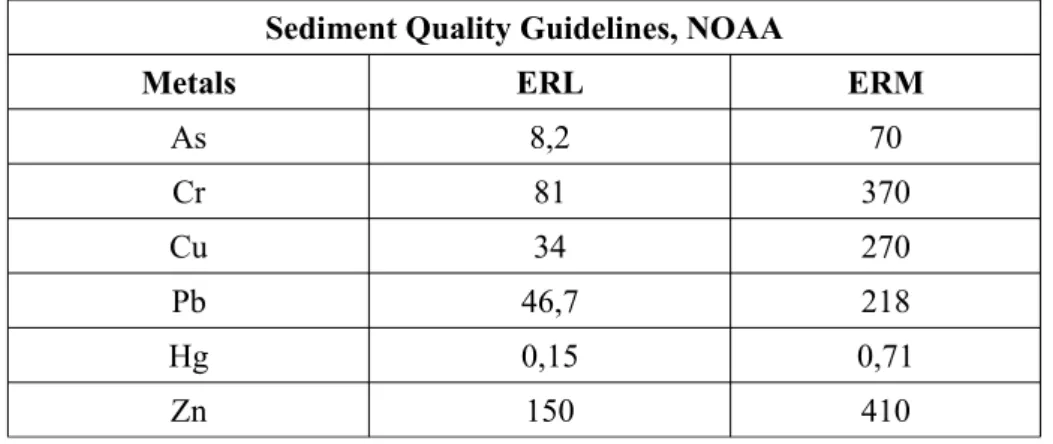
(22) Table 1. ERL and ERM values of the Sediment Quality Guidelines from NOAA. Sediment Quality Guidelines, NOAA Metals. ERL. ERM. As. 8,2. 70. Cr. 81. 370. Cu. 34. 270. Pb. 46,7. 218. Hg. 0,15. 0,71. 150. 410. Zn Values of ERL and ERM in ppm. ERL: Effects Range-Low ERM: Effects Median-Range Data from NOAA (1999). Table 2. Heavy metal range concentration on mussels (Mytilus galloprovincialis) from three Galician Rías (Arousa, O Burgo and Ares-Betanzos) and Redondela, inner Ría de Vigo Ría/Metal. As. Co. Cr. Cu. Arousa. 5,4-7,2. 4,1-5,9. Burgo. 3.5–8.7. AresBetanzos. 3.7. Hg. Mn. Pb. Zn. 32.7–138. 2.3–5.5. 1.9–11.9. 195–717. 5.8–10.7. 31.6–83.0. 4.3–9.9. 11.8–26.5. 346–718. 7.2. 45.3. 5.4. 23.4. 777. Redondela 2,2 0,20 22 0,04 0,4 1,6 Data from Arousa, O Burgo and Ares-Betanzos from Prego et. al (2003). Data about Redondela from Saavedra et. al (2004).. Table 3. Heavy metal range concentration on sediments from three Galician Rías (Arousa, O Burgo and Ares-Betanzos). Ría/Metal. As. Co. Cr. Cu. Hg. Mn. Pb. Zn. 9-16. 2-1700. 4-365. 0,3. 120-3590. 25-325. 20-400. 12-16. 0-115. 0-315. 0-0,1. 170-500. 0-460. 0-1300. Ares5-20 12-16 Betanzos Data from Prego et. al (2003). 0-28. 0-65. 0-0,44. 170-1320. 2-95. 0-250. Arousa Coruña. 22. 0-15.
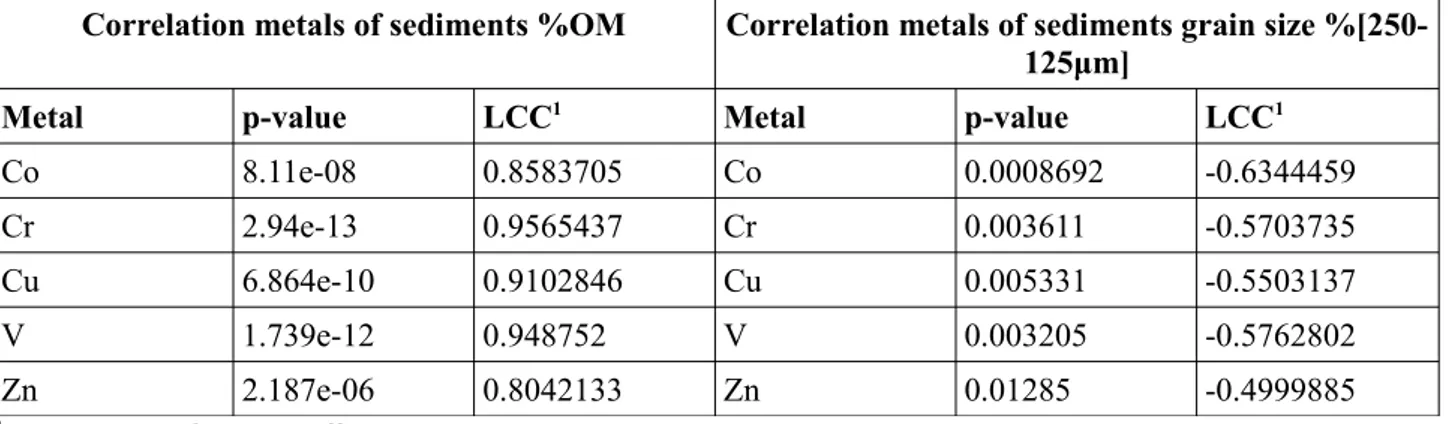
(23) Table 3. and 4. Correlations between metals and percentage of organic matter and metals with the percentage of grain size between 250-125μm respectively. Correlation metals of sediments %OM. Correlation metals of sediments grain size %[250125μm]. Metal. p-value. LCC1. Metal. p-value. LCC1. Co. 8.11e-08. 0.8583705. Co. 0.0008692. -0.6344459. Cr. 2.94e-13. 0.9565437. Cr. 0.003611. -0.5703735. Cu. 6.864e-10. 0.9102846. Cu. 0.005331. -0.5503137. V. 1.739e-12. 0.948752. V. 0.003205. -0.5762802. 0.8042133. Zn. 0.01285. -0.4999885. Zn 2.187e-06 : Linear correlation coefficient. 1. Table 5. Correlated metals in sediment samples from the different areas (O Burgo, Mandeo, Riveira and Corrubedo). Correlated metals for sediments Pairs of metals p-value. LCC1. Pairs of metals p-value. LCC1. Cr-Cu. < 2.2e-16. 0.9794501. Cr-Co. 3.359e-08. 0.8699451. Cr-Zn. 8.483e-10. 0.9084683. Cr-V. 3.042e-14. 0.964775. Co-Zn. 9.57e-06. 0.7728571. Co-V. 1.864e-09. 0.9013743. Zn-Hg. 0.00171. 0.6056749. Zn-B. 0.005023. 0.8695358. Zn-V. 1.082e-07. 0.8543487. Mn-B. 0.0034. 0.8859317. Weak correlations* Cr-Hg. 0.02306. Co-Ba 0.04563 : Linear correlation coefficient. 0.4619245. Cr-Pb. 0.04605. 0.4109607. 0.7163005. Zn-Pb. 0.01051. 0.5121814. 1. *: 0,01<p-value<0,05. Table 6. Correlated metals in organisms samples from the different areas (O Burgo, Mandeo, Riveira and Corrubedo) and species (mussels, clams, cockles and razor shells). Correlated metals for organisms Pairs of metals p-value. 23. LCC1. Pairs of metals p-value. LCC1. As-Cr. 8.982e-10. 0.9235253. As-Cu. 1.545e-12. 0.9601533. As-Co. 5.399e-05. 0.7522045. As-Zn. 1.834e-05. 0.7803926. As-Hg. 4.225e-08. 0.8857785. Cr-Cu. 1.082e-07. 0.8738638. Cr-Co. 1.174e-06. 0.8373359. Cr-Zn. 1.232e-07. 0.8721269. Cr-Hg. 2.681e-07. 0.861125. Cr-Pb. 1.147e-07. 0.8730848. Cr-V. 0.000707. 0.6664695. Cu-Co. 3.59e-06. 0.8164189.
(24) Cu-Zn. 0.0001603. 0.719535. Cu-Hg. 8.788e-05. 0.7381582. Cu-Pb. 7.645e-07. 0.8446717. Cu-V. 1.181e-06. 0.837243. Co-Zn. 0.0009766. 0.6533637. Co-Pb. 2.986e-12. 0.95739. Co-Ba. 6.058e-05. 0.9018963. Zn-Hg. 5.946e-06. 0.8060258. Zn-Pb. 3.244e-05. 0.7659861. Zn-V. 0.003257. 0.5984592. Hg-Pb. 0.006929. 0.5582741. Hg-V. 3.386e-06. 0.8175839. B-V. 0.003689. 0.7657782 Weak correlations*. As-B. 0.01201. Co-Hg 0.01962 : Linear correlation coefficient. -0.6956001. Cr-Ba. 0.03166. 0.6195756. 0.4934024. Pb-V. 0.01964. 0.4933573. 1. *: 0,01<p-value<0,0. Table 7. Correlated metals for both organisms and sediment samples from the different areas (O Burgo, Mandeo, Riveira and Corrubedo) and species (mussels, clams, cockles and razor shells). Correlated metals for sediments and biota Pairs of metals p-value. LCC1. Pairs of metals p-value. LCC1. As-Hg. 0.0008736. 0.4740923. Zn-Mn. 5.903e-09. 0.9242609. Cr-Cu. 8.882e-16. 0.8788884. Zn-Hg. 1.944e-07. 0.6806564. Cr-Co. 1.621e-14. 0.8611839. Zn-Ba. 8.578e-06. 0.8224338. Cr-Mn. 6.359e-09. 0.9236127. Zn-B. 1.716e-12. 0.9699207. Cr-Pb. 0.001986. 0.444185. Zn-V. 0.003441. 0.4225384. Cr-Ba. 1.599e-14. 0.9822003. Cu-Co. 7e-10. 0.7631588. Cr-B. 9.041e-10. 0.9388827. Cu-Zn. 3.106e-06. 3.106e-06. Cr-V. < 2.2e-16. 0.9468565. Cu-Mn. 2.709e-13. 0.9755546. Mn-Pb. 1.051e-06. 0.8617178. Cu-Hg. 8.097e-05. 0.5479241. Mn-Ba. 2.376e-08. 0.9111044. Cu-Pb. 0.007245. 0.3908095. Mn-B. 5.995e-15. 0.9840675. Cu-Ba. 4.537e-08. 0.904205. Mn-V. 6.359e-09. 0.9236126. Cu-B. < 2.2e-16. 0.997806. Pb-Ba. 1.978e-08. 0.9129654. Cu-V. < 2.2e-16. 0.8968562. Ba-B. 3.56e-08. 0.9068537. Co-Mn. 1.169e-10. 0.95156. Ba-V. 1.599e-14. 0.9822003. Co-Pb. 0.0004384. 0.4972768. B-V. 9.041e-10. 0.9388827. Co-Ba. 4.019e-12. 0.9668984. B-Pb. 1.169e-08. 0.9180766. Co-B. 1.588e-12. 0.9701831. Co-V. 1.004e-13. 0.8482131. Weak correlations*. 24. Cr-Zn. 0.01688. 0.3506711. Hg-V. 0.03892. 0.3055538. Cr-Hg. 0.02555. 0.3290687. Pb-V. 0.02348. 0.3335751.
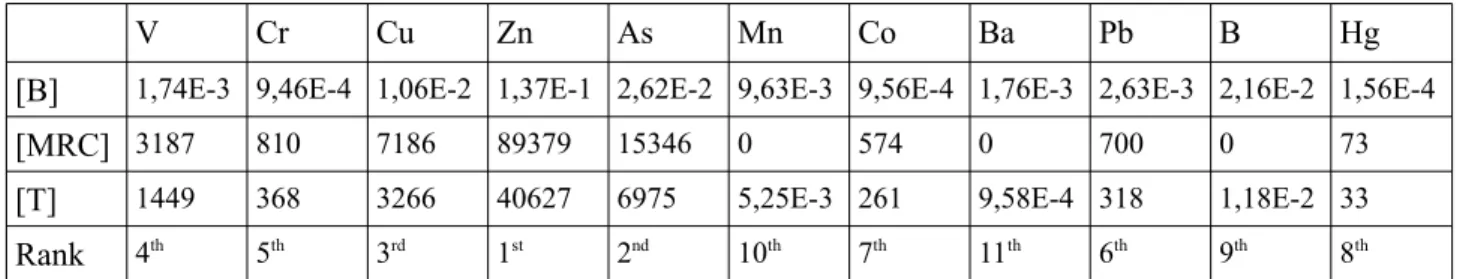
(25) 1. : Linear correlation coefficient. *: 0,01<p-value<0,05. Table 8. Metal average concentrations on sediments (from all the areas, O Burgo, Mandeo, Riveira and Corrubedo) below the limit of detection, samples below the LOQ, and ordered respecting to their abundance.. V <LOQ 2. Cr. Cu. Zn. As. Mn. Co. Ba. Pb. B. Hg. 3. 23. 17. 2. 8. 24. 8. 24. 8. 4. [Sed]. 32852 29672 4449. 28417 6791. 97912 7152. 13441 9423. 8778. 121. Rank. 2nd. 4th. 1st. 5th. 7th. 11th. 3rd. 10th. 9th. 8th. 6th. <LOQ Number of sediment samples with metal concentration below the limit of quantification (LOQ) [Sed]: Average metal concentration on sediments, without the samples with concentrations below the LOQ. Rank: Ordered metal concentrations, related to each other.. Table 9. Metal average concentrations on organisms (mussels, cockles, clams and razor shells) from O Burgo, Mandeo, Riveira and Corrubedo. Ordered respecting to their abundance. V [B]. Cr. Cu. Zn. As. Mn. Co. Pb. B. 810. 7186. 89379. 15346. 0. 1449. 368. 3266. 40627. 6975. 5,25E-3 261. 574. 4th 5th 3rd 1st 2nd 10th 7th Rank [B]: Average metal concentration on organisms from O Burgo.. 0. 700. 0. 1,18E-2 33. 11th. 9th. 6th. [T]: Total average metal concentration, from all areas (O Burgo, Mandeo, Riveira and Corrubedo). Rank: Ordered metal concentrations, related to each other.. 73. 9,58E-4 318. [MRC]: Average metal concentration on organisms from Mandeo, Riveira and Corrubedo.. 25. Hg. 1,74E-3 9,46E-4 1,06E-2 1,37E-1 2,62E-2 9,63E-3 9,56E-4 1,76E-3 2,63E-3 2,16E-2 1,56E-4. [MRC] 3187 [T]. Ba. 8th.
(26) TRABAllO FIN DE GRAO. Nuria Fernández Rodríguez e Ramon Muíño Boedo. autorizan a presentación do. Traballo de Fin de Grao “Analysis of pollution by heavy metals in sediments and species of commercial interest of the Galician coast” presentado por Marta Gil Molinero para a súa defensa ante o tribunal calificador.. En A Coruña, a 22 de xullo de 2014. Asdo.: Nuria Ferández. Asdo. Ramon Muíño.
(27)
Figure


+4

Documento similar
The draft amendments do not operate any more a distinction between different states of emergency; they repeal articles 120, 121and 122 and make it possible for the President to
The main objectives of this study were to evaluate the degree of Pb, Cu, Zn, Cd, Cr and Ni pollution using pollution indexes and geostatistical approach, and to assess metals
No obstante, como esta enfermedad afecta a cada persona de manera diferente, no todas las opciones de cuidado y tratamiento pueden ser apropiadas para cada individuo.. La forma
The Dwellers in the Garden of Allah 109... The Dwellers in the Garden of Allah
The objective was to estimate the association between heavy metals and metalloids in soil and the prevalence of mental disorders in the adult population of Spain.. Methods:
(1985) Distribution of mercury trace organics and other heavy metals in Detroit River sediments.. (1981) Toxicology et
Astrometric and photometric star cata- logues derived from the ESA HIPPARCOS Space Astrometry Mission.
teriza por dos factores, que vienen a determinar la especial responsabilidad que incumbe al Tribunal de Justicia en esta materia: de un lado, la inexistencia, en el
