Predicting 6-week mortality after acute variceal bleeding:
role of classification and regression tree analysis
José Altamirano,*, Laura Zapata,, Salvador Augustin,* Laura Muntaner,* Alberto González Angulo, Ana Laura Ortiz, Louis Degiau,§ Juan Garibay,§ Leonardo Camargo,|| Joan Genescà*
* Liver Unit, Hospital Universitari Vall dHebron, Institut de Recerca, Vall dHebron, Universitat Autònoma de Barcelona, Barcelona, Spain. Gastroenterology Unit.
Dirección de Enseñanza e Investigación. Hospital Juárez de México. México City. México. § Hospital General de México OD, México City, México.
|| Universidad La Salle de México, Faculty of Medicine, Mexico City, México.
ABSTRACT
Background. Available prognostic scores for mortality after acute variceal bleeding are mainly based on logistic re-gression analysis but may have some limitations that can restrict their clinical value. Aims. To assess the efficacy of a novel prognostic approach based on Classification and Regression Tree -CART- analysis to common easy-to-use mod-els (MELD and Child-Pugh) for predicting 6-week mortality in patients with variceal bleeding. Methods. Sixty consec-utive cirrhotic patients with acute variceal bleeding. CART analysis, MELD and Child-Pugh scores were performed to assess 6-week mortality. Receiver operating characteristic (ROC) curves were constructed to evaluate the predictive performance of the models. Results. Six-week rebleeding and mortality were 30% and 22%, respectively. Child-Pugh and MELD scores were clinically relevant for predicting 6 weeks mortality. CART analysis provided a simple algorithm based on just three bedside-available variables (albumin, bilirubin and in-hospital rebleeding), allowing accurate dis-crimination of two distinct prognostic subgroups with 3% and 80% mortality rates. All MELD, Child-Pugh and CART models showed excellent and comparable predictive accuracy, with areas under the ROC curves (AUROC) of 0.88, 0.84 and 0.91,respectively. Conclusions. A simple CART algorithm combining albumin, bilirubin and in-hospital rebleeding allows an accurate predictive assessment of 6-week mortality after acute variceal bleeding.
Key words. Variceal bleeding. Portal hypertension. Cirrhosis. Prognostic scores. Classification And Regression Tree (CART) analysis. Child-Pugh. MELD.
Correspondence and reprint request: José Altamirano M.D.
1. Liver Unit, Department of Internal Medicine, Hospital Universitari Vall dHebron, Passeig Vall dHebron 119, 08035 Barcelona, Spain.
2. Gastroenterology Unit. Hospital Juárez de México. México City. México. Tel: 34-671920419.
Fax: 34-932746068.
E-mail: [email protected].
Manuscript received: August 27, 2009. Manuscript accepted: October 24, 2009. INTRODUCTION
Variceal bleeding is a major complication of por-tal hypertension and the leading cause of death in patients with cirrhosis.1-3 After an episode of vari-ceal bleeding, rebleeding and mortality rates rise du-ring the first 6 weeks and then tend to stabilize.1,4 Over the last two decades, new developments in diagnostic and therapeutic techniques for the mana-gement of the acute episode and during the ensuing critical 6-week window have led to an improvement in the prognosis of this serious complication.5-7 However, mortality rates in these patients still
re-mains markedly high (17-20%) within this 6-week period.6,8-10
Prognostic indicators of mortality within the 6-week period following an episode of acute variceal bleeding have been proposed in different studies.8,10,11 These estimates are based on statistical models infe-rred from cohort data with methods such as logistic regression or Cox proportional analyses. On the other hand, studies assessing the efficiency of Child-Pugh and MELD scores in predicting mortality of any cause in cirrhotic patients with variceal bleeding have also been published.12-15 The use of these me-thods is based on their accuracy and their ease-of-use for the non-statistician. However, clinicians often find it challenging to integrate this prognostic infor-mation into the day to day clinical routine.
together in a common patient dataset. CART analysis for short and long-term survival has only been repor-ted in two preliminary-data studies for prognostic as-sessment of bleeding cirrhotic patients.21,22
These considerations led us to conduct a retrospec-tive study in a single centre cohort of patients in a clinical practice setting to asses 6-week mortality af-ter an acute variceal bleeding. Moreover, we perfor-med a prognostic analysis of mortality in the series and evaluated the efficiency of Child-Pugh, MELD and regression trees (based on CART analysis).
PATIENTS AND METHODS
Patients
All consecutive episodes of esophageal variceal bleeding (EVB) in patients with liver cirrhosis ad-mitted to the Emergency Gastroenterology Unit of the Hospital Juárez de México, Mexico City, México, from January 2006 to January 2007 were prospecti-vely collected. Patients with hepatocellular carcino-ma, aged > 80 years, had infection documented at entrance or suspicion of infection during the first 24 hrs after hospital admission and non-cirrhotic EVB or bleeding from sources other than esophageal vari-ces (e.g., gastric varivari-ces, peptic ulcers, postvariceal ligation scars or portal gastropathy) were not inclu-ded in the study. Baseline and follow-up clinical and biochemical characteristics, as well as the use of ini-tial pharmacological therapy were recorded. All bio-chemical and clinical variables of patients were used for calculations of Child-Pugh and MELD scores at admission. MELD score was calculated with the fo-llowing formula: MELD 9,57Ln(Creatinine) + 3,78Ln(Bilirrubin) + 11,2 Ln(INR) + 6,43.
Cirrhosis was diagnosed on basis of previous liver biopsy or by a combination of the usual clinical, bio-chemical and radiological criteria. The time of inclu-sion was determined as the moment of admisinclu-sion to the Emergency Gastroenterology Unit (Bleeding unit) of our centre. Patients were followed until day 42 (6 weeks) or until their death.
The protocol was approved by the ethics commit-tee of our institution, and all patients or near relati-ve (when patient was unable) garelati-ve a written informed consent.
Treatments
All patients included in the study received oral prophylaxis with norfloxacin PO 400 mg every 12 h for 7 days, at admission to the bleeding unit. An
ini-tial endoscopy was performed within the first 12 h [median time 62-10 h] after admission, and endosco-pic variceal ligation (EVL) was conducted in all ca-ses. A Sengstaken-Blakemore tube was placed as a bridge to a new endoscopy when indicated. Pharma-cological vasoactive therapy was performed with oc-treotide 50 µg IV bolus followed by continuous infusion of 50 µg/h for 5 days, this therapeutic mea-sure was started immediately after admission to the bleeding unit. The pharmacological therapy was only performed in patients with the financial ability to purchase it.
Secondary prophylaxis was initiated in surviving patients passing the 5-day period. Oral propranolol was started at 40 mg/day and subsequently increa-sed until intolerance appeared, the heart rate de-creased below 55 beats per minute or a reduction in at least 25% of the baseline heart rate was obser-ved. All patients underwent EVL at 2-to-3-week in-tervals until variceal eradication was achieved. In addition, patients who were on pharmacological therapy before bleeding had EVL added to the pro-phylactic regime.
Definitions
Statistical analysis
Continuous variables were described as median within 25-75 interquartile range and compared using Students t test or Mann-Whitney U test, as appro-priate, depending on their normality test. Differences between categorical variables were assessed by Fishers exact test or the chi-square test with Yeats correction for continuity, when necessary. A p value of < 0.05 was required for statistical significance.
Three different techniques were used for prognos-tic assessment of mortality and rebleeding at 6-week period. First, the performance of Child Pugh and MELD scores at entrance were evaluated by measu-rement of their discriminative ability, estimated by the concordance c-statistic (AUROC). An AUROC value of > 0.70 was considered clinically relevant. The SPSS statistical package (SPSS Inc., version 15.0, Chicago, IL, USA) was used for these calcula-tions. Second, for CART analysis we used the CART Pro v6.0 software (Salford systems, San Diego, CA, USA), based on the original Breinmans code. Brie-fly, the method allows the construction of inductive decision trees through strictly binary splitting. This algorithm divides each parent node into two homo-geneous child nodes by applying yes/no answers at each decision node. The basic tree-generating or learning process consists of:
1. Selecting the most discriminative variable accor-ding to an impurity function to partition the data 2. Repeating this partition until child nodes are
considered pure enough to be terminal.
3. Pruning the resulting tree to avoid overfitting and redundancy. In our study, sensitivity analysis was based on the Gini index, and 10-fold cross va-lidation was performed to assess internal validity.
Misclassification costs were set at 1.0. The num-ber of patients in terminal nodes was set to a mini-mum of 20 and no specific splitters were forced for root or children nodes. Cut-off points for continuous and categorical variables were automatically genera-ted by the model based on statistical cost assumptio-ns. Optimal trees were then selected according to their relative misclassification costs, predictive accu-racy and clinical relevance.
Finally, a receiver operating characteristic (ROC) curve was constructed with the CART model and statistical differences between scores were assessed comparing the AUROC values by means of the Z test using MEDCALC software (Version 10.0.2 Mariaker-ke, Belgium).
RESULTS
Patient features and treatment
During the 1-year period 75 consecutive patients with cirrhosis and gastrointestinal bleeding were re-ceived at our Bleeding Unit. Fifteen patients were excluded for several reasons: 6 HCC, 5 bleeding from other cause than EVB and 4 infections at entrance. Therefore 60 patients (38 men, 22 women) with EVB were analyzed. Basal demographic and clinical cha-racteristics of patients at admission are shown in Table 1.
The most frequent etiology of cirrhosis was alco-hol abuse (48%). Seventeen patients (28%) showed renal impairment at arrival to the hospital manifes-ted by serum creatinine > 1.5 mg/dL. Clinically ma-nifested hepatic encephalopathy (grade > 2) was present in 24 (40%). Infection of any cause develo-ped during follow-up [median time 20 (4-30) days] in 20 of 60 patients (33%), the sites were: 12 sponta-neous bacterial peritonitis, 4 urinary tract infection, 3 pneumonias and 1 from unknown cause with posi-tive blood culture.
Active bleeding was found in 25 (42%) patients. Recent stigmata of variceal bleeding were seen in
Table 1. Baseline characteristics of patients admitted to the Gastroenterology Unit with esophageal variceal bleeding.
Variable N = 60
Age (yr) 52 (44-60)
Sex (male) 38 (63%)
ETIOLOGY (%)
Alcohol 29 (48%)
Virus 12 (20%)
Alcohol+virus 5 (8%)
Other¶ 14 (23%)
Creatinine (mg/dL) 1 (1.0-1.5)
INR 1.8 (1.5-2.0)
Bilirubin (mg/dL) 1.6 (0.9-3.3) Na (mmol/L) 138 (135-142) Albumin (g/Dl) 2.8 (2.2-3.3) Hemoglobin (g/dL) 7.6 (5.8-9.0)
Ascites 45 (75%)
Child class A/B/C 10/25/25
Child score 9 (7-12)
MELD score 15 (13-21)
Variceal size 1/2/3* 4/16/40
Summary statistics for quantitative variables are stated as median (inter-quartile range 25-75).
*: Grade 1, varices flattened by insuflation; grade 2, varices not flattened by insuflation and separated by areas of normal mucosa; grade 3, confluent varices not flattened by insuflation. ¶:Autoimmune and cryptogenetic
31 (51%), and 4 (7%) had blood in the stomach without any other source of bleeding. Median hos-pital stay was 9 (3-15) days. All patients un-derwent a diagnostic endoscopic procedure in order to confirm the variceal source of bleeding
Figure 1. Mortality (6-weeks). Kaplan-Meier plot showing
the cumulative probability of survival in the 6-week period fo-llowing an acute esophageal variceal bleeding for the whole cohort (60 patients).
Cumulative
probability-Survival
(%) 1.00 0.95
0.90
0.85
0.80
0.75
0.00 10.00 20.00 30.00 40.00 50.00 Time to death (days)
At risk 60 54 51 49 47
Events 0 6 9 11 13
and EVL was performed in all cases. Pharmacolo-gical vasoactive therapy was used in 7 (12%) pa-tients no adverse events were documented in these patients.
Outcomes
Within the 6-week follow-up period, 18 out of a total 60 patients (30%) suffered rebleeding and 13 patients (22%) died due to: 4 inhospital reblee-ding, 5 liver failure and 4 bacterial infection. The median time of presentation of in-hospital reblee-ding was 4 (2-7) days. Kaplan-Meier plot showing survival cumulative proportions in the 6 week ob-servation period for the whole cohort is presented in Figure 1.
The first endoscopy procedure was effective in controlling active bleeding in 92% of cases, in cases where endoscopy could not control active bleeding, a Sengstaken Blakemore tube was placed and a se-cond therapeutic endoscopy was done during the next 24 hrs. No major adverse events were docu-mented during therapeutic endoscopy procedures. Among the 52 (87%) patients who survived the blee-ding episode and could be discharged, all received therapy for secondary prophylaxis of variceal blee-ding.
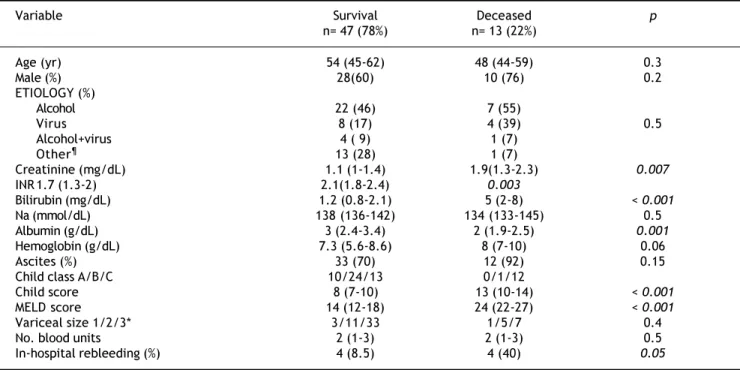
Table 2. Comparison of relevant characteristics of patients according to mortality within 6 weeks.
Variable Survival Deceased p
n= 47 (78%) n= 13 (22%)
Age (yr) 54 (45-62) 48 (44-59) 0.3
Male (%) 28(60) 10 (76) 0.2
ETIOLOGY (%)
Alcohol 22 (46) 7 (55)
Virus 8 (17) 4 (39) 0.5
Alcohol+virus 4 ( 9) 1 (7)
Other¶ 13 (28) 1 (7)
Creatinine (mg/dL) 1.1 (1-1.4) 1.9(1.3-2.3) 0.007
INR 1.7 (1.3-2) 2.1(1.8-2.4) 0.003
Bilirubin (mg/dL) 1.2 (0.8-2.1) 5 (2-8) < 0.001
Na (mmol/dL) 138 (136-142) 134 (133-145) 0.5
Albumin (g/dL) 3 (2.4-3.4) 2 (1.9-2.5) 0.001
Hemoglobin (g/dL) 7.3 (5.6-8.6) 8 (7-10) 0.06
Ascites (%) 33 (70) 12 (92) 0.15
Child class A/B/C 10/24/13 0/1/12
Child score 8 (7-10) 13 (10-14) < 0.001
MELD score 14 (12-18) 24 (22-27) < 0.001
Variceal size 1/2/3* 3/11/33 1/5/7 0.4
No. blood units 2 (1-3) 2 (1-3) 0.5
In-hospital rebleeding (%) 4 (8.5) 4 (40) 0.05
Summary statistics for quantitative variables are stated as median (interquartile range 25-75). *: Grade 1, varices flattened by insuflation; grade 2, varices not flattened by insuflation and separated by areas of normal mucosa; grade 3, confluent varices not flattened by insuflation.¶:Autoimmune and cryptogenetic
Prognostic scores
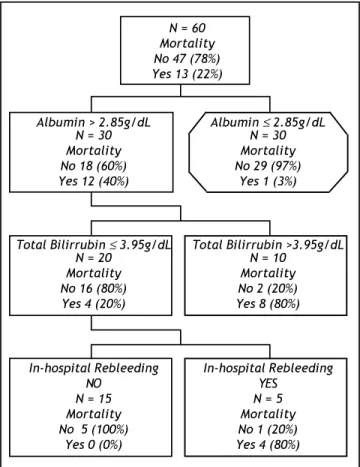
To evaluate the efficiency of scores in terms of 6 weeks mortality ROC curves were constructed for MELD and Child-Pugh scores, both with clinically relevant (0.88 IC 95% 0.78-0.99, 0.84 CI 95% 0.73-0.95, respectively) AUROC. For cohort analysis, we performed 2 groups in relation to survival. After comparison of the groups (Table 2) the most rele-vant clinical and biochemical variables were directly introduced in CART analysis. The best decision tree (Gini´s index 0.35) was constructed with 2 bioche-mical (albumin and total bilirubin) and 1 clinical (in-hospital rebleeding) variables which were the best scores (Figure 2). The best cut-off points for biochemical variables were 2.85 g/dL for albumin and 3.95 mg/bL for bilirubin. The CART model also shown a significant AUROC (0.91 CI 95% 0.82-0.99). The first split in the CART model was with albumin showing a 97% of survival in those with levels above the cut-off point. For the second and third splits
those patients for whom the level of bilirubin were > 3.95 mg/dl or in-hospital rebleeding was documen-ted, mortality rates were 80%. When comparing the efficacy of constructed ROC curves for CART, MELD and Child-Pugh we found no statistical differences (Figure 3).
DISCUSSION
In this study we analysed the clinical outcomes of a single-centre cohort of patients after acute vari-ceal bleeding in day-to-day clinical practice. The main intention was to propose a novel and alternati-ve prognostic approach to the assessment of 6-week mortality in this setting. The data of the present study clearly confirms an improvement in the outco-me of patients with acute variceal bleeding in recent years compared to historical cohorts. The 22% six-week mortality rate in our study (excluding cases of HCC) is markedly lower than the 60% of the semi-nal study by Graham and Smith1 and similar to that of more recent and well conducted studies.6,8-10
Recently, some studies have compared Child-Pugh and MELD scores in cirrhotic patients with variceal
Figure 2. Prognostic model for 6-week mortality based on
an inductive tree generated by CART analysis of 60 patients after an episode of acute esophageal variceal bleeding.
CART: Classification and Regression Tree Analysis.
N = 60 Mortality No 47 (78%) Yes 13 (22%)
Albumin > 2.85g/dL Albumin ≤ 2.85g/dL
N = 30 N = 30
Mortality Mortality
No 18 (60%) No 29 (97%)
Yes 12 (40%) Yes 1 (3%)
Total Bilirrubin ≤ 3.95g/dL Total Bilirrubin >3.95g/dL
N = 20 N = 10
Mortality Mortality
No 16 (80%) No 2 (20%)
Yes 4 (20%) Yes 8 (80%)
In-hospital Rebleeding In-hospital Rebleeding
NO YES
N = 15 N = 5
Mortality Mortality
No 5 (100%) No 1 (20%)
Yes 0 (0%) Yes 4 (80%)
Figure 3. Comparison of the area under the receiver
ope-rating characteristic curves (AUROC) of prognostic models for 6-week mortality obtained by CART analysis, and for
Child-Pugh and MELD scores. CART: Classification and Regression
Tree Analysis. MELD: Model for End Stage Liver Disease.
Sensitivity
1.0
0.8
0.6
0.4
0.2
0.0
0.0 0.2 0.4 0.6 0.8 1.0
1-Specificity
Z statistic Significance
(p) level
CART vs. MELD 0.370 0.71
CART vs. Child-Pugh 1.233 0.21
MIELD vs. Child-Pugh 0.754 0.45
bleeding. All of them documented a similar capabili-ty of Child-Pugh and MELD scores for predicting mortality12-14 Flores-Rendón AR, et al. has recently show the superiority of MELD versus CP for predic-ting in-hospital bleeding-related mortality in a re-trospectively study. However, in the analysis of overall mortality no differences were encountered.15 Our results are concordant with these regarding in the point that no substantial differences for predic-ting 6-week mortality with this 2 prognostic scores were found. Moreover, the results of our analysis also reinforce the relevance of well-known risk fac-tors (Child-Pugh and MELD score and occurrence of early in-hospital rebleeding), which are essentially related to basal patient liver function and their glo-bal clinical status.
Perhaps, the most original feature of our study is the use of CART analysis for the mortality prognos-tic assessment in a cohort of cirrhoprognos-tic patients. An intuitive decision tree (Figure 2), based on the com-bined use of just three variables (albumin, bilirubin, in-hospital rebleeding), usually available at patient bedside, allowed an early discrimination of two prog-nostic subgroups with clearly distinct mortality af-ter an episode of variceal bleeding. First, a low-risk group (all patients with albumin > 2.85 g/dL) is as-sociated with an excellent overall 6-week survival (97%), independent of other prognostic factors, and for whom more aggressive therapeutic measures pro-bably may not be needed. Second, patients with le-vels of albumin ≤ 2.85 g/dL and bilirubin ≤ 3.95 mg/ dL or who develop an in-hospital rebleeding episode would be included in the high-risk group (80% of 6-week mortality, respectively).
This is of great potential value, in order to in-form difficult decisions on daily clinical practice (such as which patients should undergo a more aggressive diagnostic or therapeutic management), physicians tend to classify patients into risk groups (e.i. low/high risk). In the other hand, for the de-sign of controlled trials, an accurate prognostic as-sessment is required in order to identify uniform subgroups of patients as adequate targets for thera-pies.
For these aims, either the straightforward knowledge of risk factors and their odd ratios (as provided by logistic regression analysis) or an exhaustive stratified analysis may reveal insuffi-cient, especially when the outcome of interest is de-termined by many different variables, as in the case of variceal bleeding. As an example, it has already been suggested by post-hoc analysis of two-way inte-ractions in different studies3,8,9 that the prognosis
after variceal bleeding depends on the degree of liver dysfunction. However, the order, relative strength and interactions of the components of the scores for measuring the degree of liver dysfunction that main-ly affect the prognosis of EVB are unclear with avai-lable published data.
Moreover, CART analysis do not only identify the most relevant prognostic variables, also the visual structure of trees helps us to understand the hierar-chy of the variables, uncovers the interactions bet-ween them and highlights local covariate effects (i.e., different effects of the variable in different sub-groups of patients).17-20 The CART model in our stu-dy clearly demonstrates how albumin ranks first in our cohort of patients followed by bilirubin levels.
An important point to highlight is the third split of our model in where in-hospital rebleeding plays the final role for stratification of patients with high mortality.
This, perhaps is the most important flaw of the model, and could lead to reduce its predicting accu-racy; taking into account that prognosis could change day to day. Therefore, in order to elucidate which factors were related to rebleeding and subse-quently a high risk for 6-week mortality we perform a sub-analysis of those patients included in the se-cond split (n 20). Among patients with albumin
≤ 2.85 and bilirubin ≤ 3.95 mg/dL the only variable associated with in-hospital rebleeding was creatinine (HR 24.2; IC 1.24-414.12, p = 0.24) nor number of infunded blood units or other liver dysfunction para-meters were significant. Creatinine showed good performance for this purpose with an AUROC of 0.83 (IC 0.64-1.22) as a single variable. The best cut-off point was 1.6 mg/dL (sensitivity 80%, specifi-city 88%). These results are in keeping with previo-us findings in were renal failure has been catalogued as a prognostic indicator for 6-week mor-tality and rebreeding.8,24 The importance of this spe-cific point is related to the lack of data about the relevance of creatinine among patients with the worst liver function. We found creatinine as the only determining factor of variceal rebleeding and subsequent death in this setting. Importantly, creatinine otherwise bilirubin and albumin could be a modifiable factor and a future therapeutic target for the early prognosis of patients with poor liver function and EVB.
automati-cally select and rank the most discriminative varia-bles according their relevance for a determinate out-come.20
In the other hand, our CART-model shows an ex-cellent overall predictive ability with an AUROC of 0.91 (CI 95% 0.82-0.99). Nevertheless, although CART performs an automatic internal cross-valida-tion for every tree, further studies using different datasets would be required to test the external vali-dity of the model, in view of the established difficul-ty of transferring prognostic models.25
Finally, it should be noted that the comparison of ROC curves showed the global predictive performan-ce of CART in our cohort is statistically non inferior to that of Child-Pugh and MELD scores. We propose using this CART model as an easy algorithm with 3 simple questions in a determined clinical situation as a reproducible option in day-to-day clinical practi-ce. Moreover, this CART analysis allows us to pro-perly stratified subgroups of risk without the subjectivity of some variables of Child-Pugh (e.g. as-cites and encephalopathy) or the need of a device for complex calculations such as MELD.
Certainly, this study has some limitations; first, we did not primary assess in multivariate analysis the influence of other important and controversial variables in the outcome of this patients (e.g. infec-tion or coagulainfec-tion factors). Regard this point we have to mention that patients in our cohort were ex-cluded if they shown signs of infection at admission and, if during the first 24 hrs of hospitalization were any analytic or clinical suspicion of sepsis. Mo-reover, when evaluating the role of infection in our patients we did not found significantly association with mortality (p 0.5) in the univariate analysis. Second, patients with gastric variceal bleeding, por-tal gastropathy or HCC were not included in analy-sis. This, in order to make more pure our analysis to evaluating cirrhotic patients with EVB. On the other hand, several studies have previously shown the negative impact of HCC in the outcome of pa-tients with EVB.11-13 Third, a lack of a split or ex-ternal validation of this CART model is given for sample size reasons.
In summary, our study confirms an improvement in the prognosis of these patients compared to histo-rical cohorts. For the prognostic assessment of 6-week mortality after acute variceal bleeding, we propose a novel and easy-to-use approach based on the combination of two biochemical variables and one clinical variable which is not inferior of com-monly used models. Additionally, in patients with poorer liver function we found creatinine as the
only variable associated to development of in-hospi-tal rebleeding and subsequently high risk of death. There is a need for further larger, prospective and well validated studies in order to confirm our fin-dings.
FUNDING
José Altamirano is a recipient of the fellowship grant Estímulo Héctor Orozco Zepeda 2007 from FUNSALUD, A.C., FUNDACIÓN AMPA-RO and FUNDHEPA, A.C., Mexico.
Salvador Augustin is a recipient of a fellowship grant from the Institut de Recerca Vall d´Hebron/La Caixa, and is enrolled in the post-graduate program of the Universitat Autònoma de Barcelona.
REFERENCES
1. Graham DY, Smith JL. The course of patients after vari-ceal hemorrhage. Gastroenterology 1981; 80: 800-9. 2. Gines P, Quintero E, Arroyo V. Compensated cirrhosis:
na-tural history and prognosis. Hepatology 1987; 7: 122-8. 3. D´Amico G, Luca A. Natural history. Clinical-hemodynamic
correlations. Prediction of the risk of rebleeding. Baillie-res Clin Gastroenterol 1997; 11: 243-6.
4. El-Serag HB, Everhart JE. Improved survival after vari-ceal hemorrhage over an 11-year old period in the De-partment of Veterans Affairs. Am J Gastroenterol 2000; 95: 3566-73.
5. McCormick PA, OKeefe C. Improving prognosis following a first variceal hemorrhage over four decades. Gut 2001; 49: 682-5.
6. Chalasani N, Kahi C, Francois F, et al. Improved patient survival after acute variceal bleeding: a multicenter, co-hort study. Am J Gastroenterol 2003; 98: 653-9.
7. Carbonell N, Pauwels A, Serfaty L, et al. Improved survival after variceal bleeding in patients with cirrhosis over the past two decades. Hepatology 2004; 40: 652-9.
8. D´Amico G, De Franchis R. Upper digestive bleeding in ci-rrhosis. Post-therapeutic outcome and prognostic indica-tors. Hepatology 2003; 38: 599-612.
9. Thomopoulos K, Theocharis G, Mimidis K, et al. Improved survival of patients presenting with acute variceal blee-ding: Prognostic indicators of short- and long-term morta-lity. Dig Liv Dis 2006; 38: 899-904.
10. Bambha K, Kim WR, Pedersen R, et al. Predictors of early re-bleeding and mortality after acute variceal haemorrha-ge in patients with cirrhosis. Gut 2008; 57: 814-20. 11. D´Amico G, García-Tsao G, Pagliaro L. Natural history and
prognostic indicators of survival in cirrhosis: A systema-tic review of 118 studies. J Hepatol 2006; 44: 217-31. 12. Amitrano L, Guardascione MA, Bennato R, et al. MELD score
and hepatocellular carcinoma identify patients at different risk of short-term mortality among cirrhotics bleeding from esophageal varices. J Hepatol 2005; 42: 820-5.
14. Chalasani N, Kahi C, Francois F, et al. Model for End-Stage Liver Disease (MELD) for predicting mortality in patients with acute variceal bleeding. Hepatology 2002; 35: 1282-4. 15. Flores-Rendón AR, González-González JA, García-Compean D, et al. Model for end stage of liver disease (MELD) is bet-ter than the Child-Pugh score for predicting inhospital mortality related to esophageal variceal bleeding. Ann He-patol 2008 Jul-Sep; 7: 230-4.
16. Keller F, Heinze H, Jochimsen F, et al. Risk factors and outcome of 107 patients with decompensated liver disea-se and acute renal failure (including 26 patients with he-patorenal syndrome): the role of hemodialysis. Ren Fail 1995; 17: 135-46.
17. Hess KR, Abbruzzese MC, Lenzi R, et al. Classification and regression tree analysis of 1000 consecutive patients with unknown primary carcinoma. Clin Cancer Res 1999; 5: 3403-10.
18. Horowitz N, Moshkowitz M, Halpern Z, et al. Applying data mining techniques in the development of a diagnostics questionnaire for GERD. Dig Dis Sci 2007; 52: 1871-8. 19. Austin PC. A comparison of regression trees, logistic
re-gression, generalized additive models, and multivariate adaptive regression splines for predicting AMI mortality. Stat Med 2007; 15: 2937-57.
20. Muller R, Möckel M. Logistic regression and CART in the analy-sis of multimarker studies. Clin Chim Acta 2008; 394: 1-6. 21. Augustin S, Muntaner L, Altamirano J, et al. Prognostic
as-sessment of early mortality after acute variceal hemorr-hage based on classification and regression tree analysis. EASLD monothematic conference, Portal hypertension: ad-vances in knowledge, evaluation and management. Abs-tract 32; p. 31.
22. Hernandez-Gea V, Colomo A, Aracil C, et al. Influence of early rebleeding on thelong term outcome of patients treated to prevent recurrent variceal haemorrage. EASLD monothematic conference, Portal hypertension: advances in knowledge, evaluation and management. Abstract 27; p. 25.
23. De Franchis R, Pascal JP, Ancona E, et al. Definitions, me-thodology and therapeutic strategies in portal hyperten-sion. J Hepatol 1992; 15: 256-61.
24. Cárdenas A, Gines P, Uriz J, et al. Renal Failure After Up-per Gastrointestinal Bleeding in Cirrhosis: Incidence, Cli-nical Course, Predictive Factors, and Short-Term Prognosis. Hepatology 2001; 34: 671-6.