Local habitat and landscape influence high predation of bird nests on afforested Mediterranean cropland
42
0
0
Texto completo
(2) *Manuscript Click here to view linked References. 1. Local habitat and landscape influence predation of bird nests. 2. on afforested Mediterranean cropland. 3 4. SÁNCHEZ-OLIVER, J.S. a, REY BENAYAS, J.M.a,* and CARRASCAL, L.M.b. 5. a. 6. Alcalá de Henares, Spain. Tel. +34 91 8856408, Fax +34 91 8854929 (e-mail:. 7. [email protected]; [email protected]). 8. b. 9. José Gutiérrez Abascal, 2, 28006 Madrid, Spain (e-mail: [email protected]). 10. : Dpto. de Ciencias de la Vida, Edificio de Ciencias, Universidad de Alcalá, 28871. : Dpto. Biogeografía y Cambio Global, Museo Nacional de Ciencias Naturales, CSIC,. *: Corresponding author during the review process; e-mail: [email protected]. 11. 1.
(3) 12. ABSTRACT. 13. Afforestation programs such as the one promoted by the EU Common Agrarian Policy. 14. have contributed to spread tree plantations on former cropland. Nevertheless these. 15. afforestations may cause severe damage to open habitat species, especially birds of high. 16. conservation value. We investigated predation of artificial bird nests at young tree. 17. plantations and at the open farmland habitat adjacent to the tree plantations in central. 18. Spain. Predation rates were very high at both tree plantations (95.6%) and open. 19. farmland habitat (94.2%) after two and three week exposure. Plantation edge/area ratio. 20. and development of the tree canopy decreased predation rates and plantation area and. 21. magpie (Pica pica) abundance increased predation rates within tree plantations, which. 22. were also affected by land use types around plantations. The area of nearby tree. 23. plantations (positive effect), distance to the tree plantation edge (negative effect), and. 24. habitat type (mainly attributable to the location of nests in vineyards) explained. 25. predation rates at open farmland habitat. We conclude that predation rates on artificial. 26. nests were particularly high and rapid at or nearby large plantations, with high numbers. 27. of magpies and low tree development, and located in homogenous landscapes. 28. dominated by herbaceous crops and pastures with no remnants of semi-natural woody. 29. vegetation. Landscape planning should not favour tree plantations as the ones studied. 30. here in Mediterranean agricultural areas that are highly valuable for ground-nesting bird. 31. species.. 32 33. Keywords: Artificial nests, Farmland habitat, Land use types, Magpie abundance, Pine. 34. plantations. 35 2.
(4) 36. 1. Introduction. 37. A significant amount of abandoned cropland, low productive cropland and pastureland. 38. has been converted into tree plantations in the last few decades, and ca. 7% of the total. 39. forest land in the world are tree plantations at present (FAO, 2011). Different. 40. afforestation programs have contributed to the spread of such tree plantations at the. 41. regional level. Thus, the Common Agricultural Policy (CAP) has favoured the. 42. conversion of farmland into tree plantations in the European Union since 1992 by. 43. means of a scheme of aid for forestry measures in agriculture (EEC Council Regulation. 44. No. 2080/92), which has resulted in the afforestation of > 8 million ha to date (European. 45. Commission, 2013a, 2013b). Further, afforested cropland is expected to increase in the. 46. near future in countries such as Spain due to subsidies to afforestation of extirpated. 47. vineyards (Spanish Agrarian Guarantee Fund, 2012). This afforestation program. 48. pursues both societal and environmental benefits, including control of erosion,. 49. prevention of desertification, regulation of the water regime, and increasing the fixation. 50. rate of carbon dioxide. However, whereas tree plantations provide a number of benefits. 51. (Rey Benayas et al., 2007), they may have noticeable effects on biological communities,. 52. as it has been exemplarily shown with birds (Shochat et al., 2001; Santos et al., 2006;. 53. Bremer and Farley, 2010; Felton et al., 2010; Lindenmayer et al., 2010; Rey Benayas et. 54. al., 2010).. 55. Agro-ecosystems are important for maintenance of bird diversity in Europe,. 56. especially for species of conservation concern (BirdLife International, 2004). The. 57. Directorate-General for Agriculture and Rural Development (2012), using the common. 58. farmland bird index as “a barometer of change for the biodiversity of agricultural land. 3.
(5) 59. in Europe”, shows a decline in these bird populations of ca. 20% between 1990 and. 60. 2008 (see also Gregory et al., 2005; Butler et al., 2010; Guerrero et al., 2012). Cropland. 61. afforestations in southern Europe are mostly based on coniferous species such as Pinus. 62. halepensis and P. pinaster, and are an example of novel and hybrid ecosystems sensu. 63. Hobbs et al. (2009). These plantations may cause damage to open habitat species,. 64. especially birds, by replacing high quality open farmland habitat and increasing risk of. 65. predation (Díaz et al., 1998; Cresswell, 2008; Reino et al., 2009). Predation has both. 66. direct and indirect effects on bird populations (Batáry and Báldi, 2004), the latter related. 67. to the avoidance of use of habitats that are perceived as risky (Murcia, 1995) or. 68. fecundity reduction (Bonnington et al., 2013). Besides hindering the persistence of. 69. established ground-nesting bird populations, predation may impede the colonization of. 70. the new afforested habitat by bird species (Murcia, 1995; Lindenmayer and Fischer,. 71. 2006).. 72. Tree plantations act as sources of generalist predators of various types, including. 73. rodents, lagomorphs, feral cats, dogs, and corvids (Andren, 1992; Pita et al., 2009;. 74. Reino et al., 2010; Suvorov et al., 2012). These generalist predators usually have very. 75. low densities at treeless open habitats, but thrive in mosaic habitat landscapes where. 76. they exhibit an exploratory behaviour (Andren, 1992; Pita et al., 2009; Reino et al.,. 77. 2010). Particularly, predation by corvids is enhanced in humanized landscapes where. 78. they attain high densities (Jokimaki et al., 2000; Newson et al., 2010), and Salek (2004). 79. experimentally showed that the presence of magpie (Pica pica) nests increased. 80. predation rates on bird eggs. Accordingly, Castilla et al. (2007) attributed in part the. 81. relatively low predation on Red-legged Partridge (Alectoris rufa) eggs at Mediterranean. 82. fallow fields to the low presence of magpies due to their capture by humans. Magpies. 4.
(6) 83. are strongly attracted by trees in deforested landscapes for nesting, and this. 84. phenomenon is highly noticeable at relatively small and isolated tree plantations in. 85. Mediterranean cropland afforestations.. 86. This study aimed to investigate the predation of bird eggs set on artificial nests. 87. at young (< 20 yr) tree plantations established on former cropland and at the open. 88. habitat adjacent to such tree plantations in a farmland and woodland Mediterranean. 89. mosaic. We hypothesized that nest predation will be affected by both (1) the features of. 90. local breeding habitat and (2) the features of landscape –namely proportion of land use. 91. types- surrounding local habitat. At tree plantations, we predicted that (i) a reduced area. 92. and a high edge-area ratio will favour permeability to predators and hence increase nest. 93. predation rates and (ii) magpie abundance and predation rate will be positively. 94. correlated. At open farmland habitat adjacent to tree plantations, we predict that. 95. predation rates will be influenced by (i) plantation area (positive effect), (ii) distance. 96. from plantation (negative) and (iii) magpie abundance (positive).. 97. Our experimental study sheds light on the risk of nest predation at. 98. Mediterranean landscapes that have been subjected to afforestation projects of former. 99. cropland, and provides insights for impact assessment and management of such projects. 100. at the local habitat and landscape scales.. 101 102. 2. Methods. 103. 2.1. Study area. 104. Field work was carried out in afforested cropland and open farmland located in Campo. 105. de Montiel (La Mancha natural region, southern Spanish plateau, 38º41’53”N,. 5.
(7) 106. 2º51’54”W, Figure S1 in Supplemental Material). The study area spreads on ca. 440. 107. km2 with altitude ranging between 690 and 793 m a.s.l. The climate is continental. 108. Mediterranean with dry and hot summers and cold winters. Mean annual temperature. 109. and total annual precipitation in the area during the last 30 years were 13.7 °C and 390. 110. mm, respectively (Agencia Española de Meteorología, 2012). These figures were. 111. 16.6°C and 359.9 mm in 2011 and 15.8ºC and 362.9 mm in 2012, when our nest. 112. predation experiments took place (Junta de Castilla-La Mancha, 2013).. 113. The area is a representative mosaic of different crops, pastures and semi-natural. 114. or planted woody vegetation that are characteristic of large areas in Mediterranean. 115. landscapes. Croplands were mostly occupied by herbaceous crops (wheat and barley). 116. and permanent woody crops (olive groves and vineyards). Natural vegetation consisted. 117. of holm oak (Quercus rotundifolia L.) woodland and riparian forests that have been. 118. mostly extirpated from this region. Until 1992, woodland cover was restricted to open. 119. holm oak parklands, usually grazed by sheep and goats. Major land use changes in the. 120. last 20 years are the abandonment of herbaceous cropland and vineyard extirpation and. 121. their subsequent afforestation with the native Aleppo pine (Pinus halepensis Mill.). 122. alone or mixed with holm oak and (Retama sphaerocarpa (L.) Boiss) (Rey Benayas et. 123. al., 2010). These tree plantations are noticeably dominated by pines as they establish. 124. better and grow faster than the other planted species.. 125 126. 2.2. Selection of tree plantations for predation experiments. 127. The constraints associated with each habitat type, namely tree plantations and open. 128. farmland adjacent to tree plantations, prevented homogeneous experimental designs and. 6.
(8) 129. sampling methods, and consequently data from the different experiments were not. 130. directly analysed together (see below). Thus, we run two independent experiments of. 131. bird nest predation, (1) at tree plantations and (2) on open farmland. First, all tree. 132. plantations in the study area were located using both orto-photos (Geographic. 133. Information System of Farming Land, 2010; hereafter SigPac) and Google Earth®, and. 134. were later verified in the field. We found 99 tree plantations on former cropland that. 135. took place in 1992 or later. Only tree plantations > 0.78 ha were selected for the. 136. predation experiments to take advantage of bird survey plots of this size in the study. 137. area. In addition, a target tree plantation for the experiment on adjacent farmland had to. 138. be placed at least 2-km away from another plantation to avoid that experimental nests. 139. associated with a given tree plantation were affected by another tree plantation.. 140. Following these criteria, we finally selected 30 tree plantations for the experiment at. 141. tree plantations and 38 tree plantations for the experiment on farmland adjacent to the. 142. tree plantations, with 20 plantations that were used in both experiments (Figure S1 in. 143. Supplemental Material).. 144 145. 2.3. Survey of magpie abundance. 146. We recorded the abundance of magpie as a potential nest predator in the studied tree. 147. plantations and open farmland habitat adjacent to such plantations. At every tree. 148. plantation, magpies were surveyed using point-count stations (Bibby et al., 2000). 149. lasting 10 minutes in May 2011. The point-counts were located at the centre of each tree. 150. plantation. All auditory and visual contacts were recorded, but only those within a 50 m. 151. radius (0.78 ha; Figure S2 in Supplemental Material) were used in subsequent. 152. analyses, in order to increase the probability of detection. Every point-count station was. 7.
(9) 153. surveyed by two censuses in different days, one within the first 4 h in the morning and. 154. another in the afternoon beginning 3 h before sunset. We used the average of the two. 155. counts as a measure of magpie abundance. The same trained person conducted all the. 156. censuses (JSS-O) on nearly windless (wind speed <3 m s-1) and rainless days.. 157. The open farmland habitat adjacent to 38 tree plantations was also surveyed for. 158. magpie abundance by means of one line transect of 400-m length and 200-m width in. 159. may 2012 (Figure S2 in Supplemental Material). Again, all censuses were conducted. 160. by the same well trained field ornithologist (JSS-O) on windless (wind speed < 3 m s-1). 161. and rainless days. We employed two different census methods and years for sampling. 162. magpie relative abundance according to the limitations imposed by the size of pine. 163. plantations, where transects were not possible due to their small area. Nevertheless, this. 164. is not a concern in this study as the aim is not to compare magpie abundance inside vs. 165. outside plantations, but to relate the relative abundance of magpies to nest predation. 166. within plantations and outside plantations, separately.. 167. Other corvid species were disregarded as key predators of artificial nests because. 168. they were very scarce in the study area (the Carrion Crow, Corvus corone, was detected. 169. at only one open farmland adjacent to tree plantations, and other species such as the Jay,. 170. Garrulus glandarius, or the Raven, C. corax, were not observed in the study area).. 171 172. 2.4. Nest predation experiments. 173. The two nest predation experiments used quail (Coturnix coturnix) eggs that were layed. 174. on exposed artificial wicker nests (two eggs at each artificial nest; see below details on. 175. egg placement). All eggs had the same origin (i.e., supplier), were washed and then. 8.
(10) 176. dried at air temperature before being used for the field experiments (Vander Haegen and. 177. DeGraaf, 1996; Conner and Perkins, 2003; Piper and Catterall, 2004), and were handled. 178. with gloved hands to minimize human scent (Whelan et al., 1994).. 179. The artificial nests at tree plantations and on open fields near plantations were. 180. not placed on the same date due to limitations inherent to the organization of the field. 181. work, which included a number of tasks, and considering the timing of agricultural. 182. activities in the study area (e.g., ploughing). Nevertheless, the data for the two. 183. experiments were analysed separately and were never directly compared.. 184. We considered an artificial nest as predated when the eggs were either absent or. 185. damaged, excluding from analyses those artificial nests that were ploughed or trampled. 186. (42 and 7, respectively, on open farmland and neither at tree plantations). Types of. 187. predators could not be distinguished for the eggs that were removed from the artificial. 188. nests which, in turn, were most of them (see Results). Nevertheless, unidentified. 189. predation events were probably attributable to small corvids (Schaefer, 2004) such as. 190. magpies considering their ability to store large items of food and to steal and remove. 191. eggs from nests (Henty, 1975; Groom, 1993; Perrins, 1998). We were able to. 192. distinguish predation by rodents (by their characteristic bites and, sometimes, faeces). 193. and by corvids (by their characteristic pecks) from some fresh egg remains, whereas for. 194. the largest part of predated eggs with fresh remains we could not distinguish the source. 195. of predation. However, this issue is not a problem for the aims of this study since we. 196. were interested in the effects of tree plantations on overall predation risk rather than in. 197. the identification of predator assemblages.. 198. Experiment 1.- Predation at the tree plantations. This experiment was run at 30. 199. plantations in the spring of 2011, which averaged 5.6 ± 7.2 ha and ranged between 1.5. 9.
(11) 200. and 36.5 ha. The artificial nests with two quail eggs each were placed at two different. 201. positions (i.e. one nest on the ground and another nest on pine branches) at 25-m. 202. intervals along an a priori line spanning from the edge (0 m) to the centre of the. 203. plantation (Figure S2 in Supplemental Material), in May 22-25. The height above the. 204. ground for those nests located on branches was estimated using a measuring tape. The. 205. line where both on-ground and on-branches artificial nests were placed covered at least. 206. 50 m (i.e. three nest locations at 0, 25, and 50 m from the plantation edge), whereas the. 207. maximum length of that line from the plantation edge was 225 m that included ten nest. 208. locations (average was 70.8 m and sd = 38.9). Total sample size was 230 nests, 115. 209. located on the ground and 115 located on branches. We visited the nests in two. 210. occasions, 7-9 days (May 31 and June 1) and 15-18 days after they were placed (June 9-. 211. 11), counting the number of eggs that had been removed. Artificial nests were not. 212. checked more often in order to reduce the effect of the observer on predation and to. 213. preserve nest concealment (e.g., Major and Kendal, 1996).. 214. Experiment 2.- Predation on open farmland adjacent to tree plantations. This. 215. experiment was run at 38 plantations in the spring of 2012. Each artificial wicker nest. 216. was baited with two treated quail eggs (see above) and was placed on the ground along. 217. an a priori 300-m line; this line spanned at 25-m intervals from the plantation edge (0. 218. m) until 150 m away from such edge, and then at 50-m intervals until 300 m (i.e., nine. 219. nests at 0, 25, 50, 75, 100, 150, 200, 250, and 300 m; Figure S2 in Supplemental. 220. Material). The artificial nests were placed on May 4-9. Total sample size was 342. 221. nests. We took note of the habitat type where each nest was situated, considering five. 222. habitat categories (olive groves, vineyard, abandoned cropland and pastures, semi-. 223. natural woody vegetation, and dry herbaceous cropland). We checked the nests for egg. 10.
(12) 224. predation in two occasions (in May 15-22 and in May 27-June 1, 11-14 days and 21-23. 225. days after the nests were placed), following the same protocol presented in Experiment. 226. 1.. 227 228. 2.5. Local habitat and landscape features. 229. In each of the 46 tree plantations where experiments 1 and 2 took place, we. 230. characterized variables related to vegetation structure, area, edge/area ratio, and. 231. landscape surrounding the tree plantation (Table S1 in Supplemental Material).. 232. Vegetation structure at each surveyed plantation was characterized in one 25-m radius. 233. plot (Figure S2 in Supplemental Material). We directly measured or estimated by eye,. 234. after previous training, the following structural features of the vegetation: percentage. 235. cover of chamaephytes, shrubs and trees, average height of chamaephytes, shrubs and. 236. trees, and number of trunks <5, 5-10, 10–20, 20–40 and >40cm in diameter at breast. 237. height (dbh). Additionally, we estimated percentage cover of herbs and bare soil and. 238. measured the average height of the herb layer in one concentric 10-m radius plots within. 239. the 25-m radius plot (Figure S2 in Supplemental Material) due to perceptual. 240. limitations when carrying out visual estimations. Vegetation structure was sampled by. 241. the same observer (JSS-O) to avoid inter-personal bias in vegetation measurements. We. 242. also measured area and edge/area ratio using ArcGIS 10.0 (ESRI Inc.). Edge/area ratio. 243. was calculated as the quotient between the length of the edge (in m) and the square root. 244. of the plantation area (in m2).. 245. Land use types were identified by means of land use layers taken from SigPac. 246. (see source above) and were analysed with ArcGIS 10.0. We distinguished 14 land use. 11.
(13) 247. types: streams, rivers and lagoons, roads and rural tracks, urban areas and scattered. 248. buildings, semi-natural woodland, dried-fruit orchards, orchards, waste lands, olive. 249. grove, pastures with scattered trees, scrubland, pasture land, dry herbaceous cropland,. 250. vineyard, and vineyard with olive trees. To characterize landscape surrounding the tree. 251. plantations for Experiment 1, the percentage of area of each land use types was obtained. 252. in 1-km buffer-rings centred at each forest plantation (Figure S2 in Supplemental. 253. Material). To characterize landscape for Experiment 2, the proportion of land use types. 254. was measured as above at 600 m x 600 m squares that included the 300-m transects in. 255. farmland habitat were the artificial nests were set (Figure S2 in Supplemental. 256. Material).. 257 258. 2.6. Statistical analysis. 259. The two experiments of nest predation were analysed independently. We used. 260. predation incidence obtained from the first checking date as most artificial nests were. 261. predated within the first 7-14 days after they were placed on the field (see Results).. 262. We looked at the correlation among the independent variables of our models. 263. (see below). Most correlations were not significant. Moreover, the VIF figures (variance. 264. inflation factor) for predictors in the analyses were very low (<1.75). Particularly, the. 265. shared variance between magpie abundance and other explanatory variables was usually. 266. very low (as measured by the coefficient of determination R2): (a) Within tree. 267. plantations: log area 0.03; edge/area ratio <0.001; PC1 vegetation 0.14; PC2 vegetation. 268. 0.04; and PC1 land use 0.08; (b) On open farmland habitat: log area 0.09; pine height. 269. <0.001; and PC1 land use 0.03.. 12.
(14) 270. Two statistical approaches were carried out for each experiment. First, we. 271. analysed the predation of each individual nest using a binomial response variable. 272. (predated-1, non-predated-0) by means of a Generalized Linear Mixed Effects Model,. 273. with the study location (the plantation or the farmed fields outside the plantation) as a. 274. random factor and the position of the nests as fixed effects. Additionally, we analysed. 275. global predation rates at the tree plantations and on open farmland by means of a. 276. generalized Poisson regression model. This model considered the whole sample of. 277. artificial nests at each location. Predictor variables described the characteristics of the. 278. plantations, the density of the magpie and the landscape structure around each study. 279. location.. 280. Experiment 1.- A Generalized Linear Mixed Model was applied to the predation of each. 281. individual nest at tree plantations using a binomial response variable (predated-1, non-. 282. predated-0; logit link function). The plantation was included as a random factor and the. 283. position of the nests were the fixed effects (distance of each artificial nest to the. 284. plantation edge and height of artificial nests above the ground). The continuous. 285. predictor variables were standardized to mean = 0 and sd = 1 in order to obtain. 286. standardized regression coefficients. Statistical significance was estimated using a. 287. robust approach with quasi-ML standard errors (Lindsey, 2004) after correcting for. 288. overdispersion (ɸ = 0.82).. 289. We also used a Generalized Linear Model based on a Poisson distribution (with. 290. the log-link function) for analysing the number of predated nests, with the total number. 291. of artificial nests placed at each plantation as an offset. This model was applied to. 292. analyse the effects of six predictor variables, namely tree plantation area (log-. 293. transformed), plantation edge/area ratio, magpie abundance, two components related to. 13.
(15) 294. vegetation structure, and a principal component related to landscape features (see. 295. below). Statistical significance of the standardized regression coefficients of the. 296. predictor variables was estimated using a robust approach with quasi-ML standard. 297. errors after correcting for overdispersion (ɸ = 0.72).. 298. We performed two different principal components analyses (PCA), one on. 299. vegetation structure variables within tree plantations and another on land use types. 300. surrounding the plantations, to obtain synthetic and independent environmental. 301. gradients that may affect nest predation.. 302. Experiment 2.- A Generalized Linear Mixed Model was applied to the predation. 303. of each individual nest on farmland habitat using a binomial response variable. 304. (predated-1, non-predated-0; logit link function). The plantation was included as a. 305. random factor and the position of the nests were the fixed effects (distance of each. 306. artificial nest to the nearest plantation edge and a factor describing the location in six. 307. different habitat categories). The continuous predictor variables were standardized to. 308. obtain standardized regression coefficients. Statistical significance was estimated using. 309. a robust approach with quasi-ML standard errors after correcting for overdispersion (ɸ. 310. = 0.36).. 311. Additionally, we used another Generalized Linear Model based on a Poisson. 312. distribution (with the log-link function). The response variable was the number of. 313. predated nests placed at each transect, with the total number of artificial nests as an. 314. offset. Predictor variables were: area of the nearby tree plantation (log-transformed),. 315. average tree height of the nearest plantation, magpie abundance on the farmed field. 316. transect, and the principal component related to landscape features (see below). The. 317. continuous predictor variables were standardized in order to obtain standardized. 14.
(16) 318. regression coefficients. Statistical significance of the standardized regression. 319. coefficients of the predictor variables was estimated using a robust approach with quasi-. 320. ML standard errors after correcting for overdispersion (ɸ = 0.43).. 321 322. For this experiment we carried out another PCA on land use type categories measured at 600 m x 600 m squares.. 323. Out of the 342 nests placed in total for the experiment, 40 nests were not found,. 324. seven were trampled, and 42 were located on cropland fields that were ploughed. All. 325. artificial nests at five out of the 38 tree plantations that were initially selected for. 326. Experiment 2 were lost due to ploughing or trampling.. 327. Statistical analyses were carried out using GRETL 1.9.14 (Cottrell and. 328. Lucchetti, 2007) for generalized linear models and STATISTICA 10 (StatSoft, 2011). 329. for principal components analyses.. 330 331. 3. Results. 332. 3.1. Dominant environmental gradients. 333. The first component on vegetation structure variables within tree plantations (51.2% of. 334. total variance) defined a gradient of increasing development of the tree canopy, as it. 335. opposed tree cover (factor loading = 0.897), tree height (0.816) and number of trunks >5. 336. cm in dbh (0.852) to shrub height (-0.724) and cover (-0.523) and herb height (-0.656).. 337. The second component on vegetation structure variables (20.1% of the total variance). 338. was associated with the development of the shrub layer; it opposed shrub cover (0.727). 339. and height (0.602) to herb cover (-0.611). The first component on land use around tree. 340. plantations (36.3% of the total variance) opposed olive groves (0.964) and semi-natural. 15.
(17) 341. woodland (0.718) to roads and rural tracks (-0.842), vineyard (-0.766) and dry. 342. herbaceous cropland (-0.637).. 343. For land use type categories measured at 600 m x 600 m squares on open. 344. farmland habitat, the first component (14.8% of the total variance) opposed semi-natural. 345. woodland (0.644) and pastures with scattered trees (0.626) to dry herbaceous cropland. 346. (-0.715).. 347 348. 3.2. Predation rates and magpie abundance. 349. Overall predation rates were very high at both the tree plantations and adjacent open. 350. farmland (Figure 1). 81.2% and 88.4% of the predated artificial nests were observed at. 351. tree plantations and on open farmland habitat, respectively, by the first counting, one to. 352. two weeks after being set. Only 4.4% and 5.8% of artificial nests at tree plantations and. 353. on open farmland habitat, respectively, were left un-predated two to three weeks after. 354. the start of the experiment (Figure 1).. 355. All artificial nests at 12 (40%) tree plantations were predated by the first. 356. counting, and all artificial nests were left un-predated at only one tree plantation. On. 357. open farmland habitat, all artificial nests were predated in 21 (58.3%) transects by the. 358. first counting. The maximum number of artificial nests left un-predated in a transect by. 359. the first counting was 85.7%.. 360. Of the total nests, 74.2% at tree plantations and 79.2% on open farmland were. 361. removed and, consequently, their source of predation is unknown. Predation by rodents. 362. at tree plantations and on open farmland were, respectively, 1.7% and 2.3%, whereas. 16.
(18) 363. 5.2% and 6.9%, respectively, showed evidence of predation by corvids, namely magpie. 364. as the nearly exclusive corvid species present around and in plantations.. 365. Mean magpie abundance at the 30 tree plantations was 1.37 birds per ha (sd =. 366. 1.87, range = 0-6.41), whereas it averaged 0.11 birds ha-1 (sd = 0.18, range =0-0.63,. 367. n=38) at open farmland near tree plantations.. 368 369. 3.3. Nest predation at tree plantations. 370. The Generalized Linear Mixed Model analysing the predation probability of artificial. 371. nests at tree plantations showed substantial differences among plantations, but distance. 372. of artificial nests to the plantation edge and height of nests above the ground did not. 373. show any significant effect on nest predation (Table 1).. 374. The Generalized Linear Model (Poisson distribution) of the number of predated. 375. nests at tree plantations, using the total number of artificial nests placed at each. 376. plantation as an offset (Table 2), revealed positive effects of tree plantation area and. 377. magpie abundance (Figure 2), and negative effects of edge/area ratio, development of. 378. the tree canopy (first PC of vegetation structure variables), and relative amount of tree. 379. crops and woodland in the landscape (first PC of land use type variables).. 380 381. 3.4. Nest predation on open farmland adjacent to tree plantations. 382. The Generalized Linear Mixed Model analysing nest predation of individual nests on. 383. open farmland adjacent to tree plantations resulted in significant effects of the three. 384. predictors (Table 3). There were important differences among the 33 open farmland. 385. sites adjacent to tree plantations (random factor). Distance of nests to the nearest edge. 17.
(19) 386. of tree plantations had a negative effect on predation risk (i.e., lower predation risk at. 387. longer distances from plantations). The habitat type where artificial nests were placed. 388. had also a significant effect, mainly attributable to the location of nests in vineyards that. 389. increased the probability of predation.. 390. The Generalized Linear Model (Poisson distribution) of the number of predated. 391. nests on open farmland adjacent to tree plantations, using the total number of artificial. 392. nests placed outside plantations as an offset, showed only a significant effect of the. 393. nearby plantation area, global predation risk on open farmland being higher around. 394. larger tree plantations. Mean height of nearby tree plantations, magpie abundance and. 395. the relative amount of tree crops and woodland in the landscape (first PC of land use. 396. variables) did not show any significant effect on nest predation (Table 4).. 397. The area of the tree plantations for predated (n = 224) and non-predated (n = 29). 398. artificial nests were (mean + se) 6.4 ± 0.48 ha and 3.1 ± 0.24 ha, respectively. Predated. 399. and non-predated artificial nests were on average at a distance of 121.0 ± 6.38 m and. 400. 144.0 ± 20.75 from the tree plantations, respectively, and the modal values. 401. corresponded to a distance of 50 m for predated nests and 300 m for non-predated nests.. 402 403. 4. Discussion. 404. Overall, we found that predation of artificial bird nests at young tree plantations. 405. established on former cropland and at adjacent open farmland habitat in a. 406. Mediterranean mosaic located in central Spain was (1) very high at both habitats, (2). 407. influenced by local habitat features, and (3) influenced by landscape context. However,. 408. we obtained different results for specific variables that were hypothesized to affect. 18.
(20) 409. predation rates inside and outside the investigated tree plantations (i.e. area, edge/area. 410. ratio, distance to edge, and magpie abundance).. 411. The use of artificial nests to test predation rates is controversial due to factors. 412. that are not controlled with respect to real nests, and several studies have demonstrated. 413. that artificial nests do not estimate nest predation rates on natural nests precisely (Burke. 414. et al., 2004; Faaborg, 2004; Thompson and Burhans, 2004; Villard and Part, 2004).. 415. Thus, artificial nests can reveal where birds would never choose to nest as opposed to. 416. where their nests would suffer relatively high predation rates. Also, nest predation is. 417. only one of demographic parameters and thus this study provides only a partial view of. 418. the ecological relationships in the studied landscape.. 419 420. 4.1. High predation rates on artificial nests. 421. Nest predation was very high and quick at both the tree plantations and adjacent open. 422. farmland habitat (>80% in less than two weeks after the start of our experiments). These. 423. rates are among the highest reported in the scientific literature (data and references in. 424. Table 5). Previous published figures of nest predation rates at tree plantations average. 425. 59.5% with a range of 23-94% (Table 5a). Similarly, nest predation rates for natural. 426. forest fragments are usually high (mean = 66.4%, range = 38.9-88.0%; Table 5b) but. 427. lower than in our tree plantations (95.6%). Other studies that have assessed nest. 428. predation rates at open habitat adjacent to tree plantations or natural forest fragments. 429. reported figures that average 60.0% (range = 13.7-100%; Table 3c), which are. 430. substantially lower than our 94.2% predation rate. However, comparisons of these. 431. figures with the figures obtained in our study should be cautious due to the different. 19.
(21) 432. experimental designs across studies. In an experiment that used eggs of red-legged. 433. partridge located at Holm oak woodland patches in Central Spain, Castilla et al. (2007). 434. reported a predation rate of 38.9% after a 2-week exposure.. 435. We attribute the high predation rates in our study to the following three. 436. phenomena. First, our tree plantations were overall very small (mean size of 5.7±6.7. 437. ha), which make nests easily accessible to predators in general even at the largest. 438. plantations (Ford et al., 2001; Chalfoun et al., 2002). Second, they were located in an. 439. agricultural and highly humanized landscape, which may favor predation by a number. 440. of animals such as rodents, hares, feral cats and dogs (Danielson et al., 1997; Jokimäki. 441. et al., 2005; Pangau-Adam et al., 2006). Also, short vegetation −such as that in the. 442. fields surrounding the studied plantations- is usually associated with very high predation. 443. rates (Beja et al., 2014). And third, they were a very attractive habitat for magpies, a. 444. documented powerful nest predator (Andren, 1992; Roos, 2004; Suvorov et al., 2012). 445. that was particularly abundant in our study area (Sánchez-Oliver et al., 2013).. 446 447. 4.2. Factors affecting predation rates. 448. Nest predation at tree plantations increased with larger plantation area and abundance of. 449. magpies and with a lower edge-area ratio and development of the tree layer, whereas. 450. nest predation on open farmland habitat was higher if nearby tree plantations were of. 451. large area and nests were located at closer distances from the plantations.. 452. The small size and homogeneity of the studied tree plantations and the high. 453. predation rates explain why distance to edge and average height above the ground of. 454. individual nests did not have any effect on predation rates at tree plantations. However,. 20.
(22) 455. a shorter distance to edge of the tree plantation may enhance predation on the open. 456. farmland habitat because nests are closer to the source of predators (Batáry and Báldi,. 457. 2004; Reino et al., 2010) such as magpies. Lack of association between magpie. 458. abundance and nest predation on open farmland makes unclear if magpies are or not a. 459. major predator in open habitats, an issue that should be tested by using cameras to. 460. identify the actual predators.. 461. Predator identification in our experiments was relatively unsuccessful as the. 462. proportion of eggs that disappeared was high (>74%) and, unfortunately, egg shell. 463. observation did not provide enough information to determine the main sources of. 464. predation. However, we detected a positive relationship between nest predation rates. 465. and magpie abundance inside tree plantations, which points to relevance of nest. 466. predation caused by magpies. Magpies have a high capability of exploring relatively. 467. new habitats and are prone to nesting in the most developed plantations (> 3 m in. 468. height) that we surveyed in our mostly deforested study area (Carrascal et al., 2014).. 469. Andren (1992) found predation rates of bird nests in forest fragments by this corvid that. 470. ranged between 7.2% and 35.7%. As most of the studied tree plantations are of a. 471. rectangular shape, low edge-area ratios mean larger plantations, which may function as. 472. a refuge habitat and harbour a higher abundance of magpies and other generalist. 473. predators of bird nests such as domestic carnivores (Virgós et al., 2002; Barea-Azcón et. 474. al., 2006; Pita et al., 2009; Fandos et al., 2012).. 475. The higher predation rates at tree plantations with lower tree development may. 476. be explained by the facts that these plantations are newer habitats that call more the. 477. attention of exploring predators (Virgós et al., 2002) than older plantations and,. 478. additionally, they are more open and thus artificial nests are more visible (Suvorov et. 21.
(23) 479. al., 2012). The same influence of low vegetation cover can be related to the higher. 480. predation risk suffered by artificial nests located at vineyards outside tree plantations, a. 481. heavily anthropized habitat with no vegetation at ground level due to agricultural. 482. practices that eliminate the natural herbaceous layer that may compete for water and. 483. nutrients with grapevines.. 484. Finally, we found significant landscape effects on nest predation at both the tree. 485. plantations and the surrounding open farmland habitat. Other studies have found. 486. relationships between landscape context and nest predation rates (Huhta et al., 1996;. 487. Bayne and Hobson, 1997). In our study, nest predation in tree plantations was higher in. 488. landscapes with higher proportion of herbaceous crops and pastures and lower. 489. proportion of woody crops and semi-natural woodlands. This finding supported by. 490. correlational evidence hints at the importance of semi-natural vegetation for. 491. conservation of ground-nesting birds in vast open farmed fields (Santos et al., 2006;. 492. Zuria et al., 2007; Ludwig et al., 2012). However, some open farmland birds may have. 493. strong negative reactions to woody habitats, either natural or planted, and they may also. 494. increase the abundance of generalist predators (Pita et al., 2009; Reino et al., 2009 and. 495. 2010). Deforested landscapes with a high proportion of herbaceous crops favour also. 496. the abundance of lagomorphs, which can predate on eggs (Reino et al., 2010). In. 497. general, tree plantations in open, deforested, and homogenous landscapes are better. 498. attractors and refuges of predators than tree plantations in more heterogeneous. 499. landscapes where there is more availability of habitat with trees (e.g. Andren, 1992).. 500 501. 22.
(24) 502. 5. Conclusion. 503. Our experiments on predation rates at young afforestations of Mediterranean cropland. 504. and adjacent open farmland hint local habitat and landscape features that are indicators. 505. of predation risk for bird nests. We conclude that predation rates on artificial nests were. 506. particularly high and rapid at or nearby large plantations, with high numbers of magpies. 507. and low tree development, and located in homogenous landscapes dominated by. 508. herbaceous crops and pastures with no remnants of semi-natural woody vegetation.. 509. Thus, the studied tree plantations should not be favoured, and even be extirpated, in. 510. agricultural landscapes that are highly valuable for ground-nesting bird species and. 511. open farmland bird communities (Traba et al., 2006; Sánchez-Oliver et al., 2013). We. 512. recommend assessments of real nest predation risk following afforestation in. 513. agricultural landscapes to fully understand and, consequently, reduce its impacts on. 514. biodiversity, particularly on ground-nesting birds.. 515 516. Acknowledgments. 517. Projects from the Spanish Ministry of Science and Education (CGL2010-18312) and the. 518. Government of Madrid (S2009AMB-1783, REMEDINAL-2) are currently providing. 519. financial support for this body of research. JSS-O was supported by a contract from. 520. Fundación Internacional para la Restauración de Ecosistemas (www.fundacionfire.org).. 521. We are indebeted to two anonymous reviewers and handling editor Patrick Doncaster. 522. who improved the contents and presentation of a previous version of this manuscript.. 523. We also thank Claire Jasinski for improving the English of the first draft of the. 23.
(25) 524. manuscript. All authors of this manuscript do not have any conflict of interest to. 525. declare.. 526 527. References. 528 529. Agencia Española de Meteorología, 2012. Agencia Española de Meteorología [WWW Document]. URL http://www.aemet.es/. 530 531. Andren, H., 1992. Corvid density and nest predation in relation to forest fragmentation A lansdcape perspective. Ecology 73, 794–804.. 532 533. Arango-Vélez, N., Kattan, G., 1997. Effects of forest fragmentation on experimental nest predation in Andean cloud forest. Biol. Conserv. 3207, 137–143.. 534 535 536. Barea-Azcón, J.M., Virgós, E., Ballesteros-Duperón, E., Moleón, M., Chirosa, M., 2006. Surveying carnivores at large spatial scales: a comparison of four broadapplied methods. Biodivers. Conserv. 16, 1213–1230.. 537 538. Batáry, P., Báldi, A., 2004. Evidence of an Edge Effect on Avian Nest Success. Conserv. Biol. 18, 389–400.. 539 540 541. Bayne, E.M., Hobson, K.A., 1997. Comparing the Effects of Landscape Fragmentation by Forestry and Agriculture on Predation of Artificial Nests. Conserv. Biol. 11, 1418–1429.. 542 543 544. Beja, P., Schindler, S., Santana, J., Porto, M., Morgado, R., Moreira, F., Pita, R., Mira, A., Reino, L., 2014, Predators and livestock reduce bird nest survival in intensive Mediterranean farmland. Eur. J. Wildlife Res. 10.1007/s10344-013-0773-0.. 545 546. Bibby, C., Burgess, N.D., Hill, D.A., Mustoe, S.H., 2000. Bird Census Techniques, 2nd ed. Academic Press, London.. 547 548. BirdLife International, 2004. Birds in Europe: population estimates, trends and conservation status. BirdLife International, Cambridge, U.K.. 549 550 551. Bonnington, C., Gaston, K.J., Evans, K.L., 2013. Fearing the feline: domestic cats reduce avian fecundity through trait-mediated indirect effects that increase nest predation by other species. J. Appl. Ecol. 50, 15–24.. 552 553 554. Bremer, L.L., Farley, K.A., 2010. Does plantation forestry restore biodiversity or create green deserts? A synthesis of the effects of land-use transitions on plant species richness. Biodivers. Conserv. 19, 3893–3915.. 24.
(26) 555 556 557. Burke, D.M., Elliott, K., Moore, L., Dunford, W., Nol, E., Phillips, J., Holmes, S., Freemark, K., 2004. Patterns of Nest Predation on Artificial and Natural Nests in Forests. Conserv. Biol. 18, 381–388.. 558 559 560. Butler, S.J., Boccaccio, L., Gregory, R.D., Vorisek, P., Norris, K., 2010. Quantifying the impact of land-use change to European farmland bird populations. Agric. Ecosyst. Environ. 137, 348–357.. 561 562 563. Carignan, V., Villard, M.-A., 2002. Effects of variations in micro-mammal abundance on artificial nest predation in conifer plantations and adjoining deciduous forests. For. Ecol. Manage. 157, 255–265.. 564 565 566. Carrascal, L.M., Galván, I., Sánchez-Oliver, J.S., Rey-Benayas, J.M., 2014. Regional distribution predicts bird occurrence in Mediterranean cropland afforestations. Ecol. Res. 29, 203–211.. 567 568 569. Castilla, A.M., Dhondt, A.A., Díaz-Uriarte, R., Westmoreland, D., 2007. Predation in Ground-Nesting Birds: an Experimental Study Using Natural Egg-Color. Avian Conserv. Ecol. 2, 2.. 570 571. Chalfoun, A.D., Thompson III, F.R., Ratnaswamy, M.J., 2002. Nest predators and fragmentation: a review and meta-analysis. Conserv. Biol. 16, 306–318.. 572 573. Conner, L.M., Perkins, M.W., 2003. Nest predator use of food plots within a forest matrix: an experiment using artificial nests. For. Ecol. Manage. 179, 223–229.. 574. Cottrell, A., Lucchetti, R., 2007. Gretl User’s Guide.. 575 576. Cresswell, W., 2008. Non‐ lethal effects of predation in birds. Ibis (Lond. 1859). 150, 3–17.. 577 578. Danielson, W.R., DeGraaf, R.M., Fuller, T.K., 1997. Rural and suburban forest edges: effect on egg predators and nest predation rates. Landsc. Urban Plan. 38, 25–36.. 579 580 581. Díaz, M., Carbonell, R., Santos, T., Tellería, J.L., 1998. Breeding bird communities in pine plantations of the Spanish plateaux: biogeography, landscape and vegetation effects. J. Appl. Ecol. 35, 562–574.. 582 583. Directorate-General for Agriculture and Rural Development, 2012. Rural Development in the European Union. Statistical and Economic Information. Report 2012.. 584 585 586. Estrada, A., Rivera, A., Coates-Estrada, R., 2002. Predation of artificial nests in a fragmented landscape in the tropical region of Los Tuxtlas, Mexico. Biol. Conserv. 106, 199–209.. 587 588 589. European Commission, 2013a. Forestry measures under the common agricultural policy [WWW Document]. URL http://ec.europa.eu/agriculture/envir/report/en/forest_en/report.htm. 25.
(27) 590 591 592. European Commission, 2013b. EU agriculture - Statistical and economic information [WWW Document]. URL http://ec.europa.eu/agriculture/statistics/agricultural/index_en.htm. 593. Faaborg, J., 2004. Truly Artificial Nest Studies. Conserv. Biol. 18, 369–370.. 594 595. Fandos, G., Fernández-López, J., Tellería, J.L., 2012. Incursion of domestic carnivores around urban areas: a test in central Spain. Mammalia 76.. 596. FAO, 2011. State of the World’s Forests 2011. FAO, Rome.. 597 598 599. Felton, A., Knight, E., Wood, J., Zammit, C., Lindenmayer, D.B., 2010. A metaanalysis of fauna and flora species richness and abundance in plantations and pasture lands. Biol. Conserv. 143, 545–554.. 600 601. Ford, H., Barrett, G., Saunders, D., Recher, H., 2001. Why have birds in the woodlands of Southern Australia declined? Biol. Conserv. 97.. 602 603 604. Geographic Information System of Farming Land, 2010. Geographic Information System of Farming Land [WWW Document]. URL http://pagina.jccm.es/agricul/sigpac.htm. 605 606 607. Gregory, R.D., van Strien, A., Vorisek, P., Gmelig Meyling, A.W., Noble, D.G., Foppen, R.P.B., Gibbons, D.W., 2005. Developing indicators for European birds. Philos. Trans. R. Soc. Lond. B. Biol. Sci. 360, 269–88.. 608 609. Groom, D.W., 1993. Magpie Pica pica predation on Blackbird Turdus merula nests in urban areas. Bird Study 40, 55–62.. 610 611 612 613 614 615. Guerrero, I., Morales, M.B., Oñate, J.J., Geiger, F., Berendse, F., Snoo, G. De, Eggers, S., Pärt, T., Bengtsson, J., Clement, L.W., Weisser, W.W., Olszewski, A., Ceryngier, P., Hawro, V., Liira, J., Aavik, T., Fischer, C., Flohre, A., Thies, C., Tscharntke, T., 2012. Response of ground-nesting farmland birds to agricultural intensification across Europe: Landscape and field level management factors. Biol. Conserv. 152, 74–80.. 616 617. Vander Haegen, W.M., DeGraaf, R.M., 1996. Predation rates on artificial nests in an industrial forest landscape. For. Ecol. Manage. 86, 171–179.. 618 619. Henty, C.J., 1975. Feeding and food-hiding responses of jackdaws and magpies. Br. Birds 68, 463–466.. 620 621. Hobbs, R.J., Higgs, E., Harris, J.A., 2009. Novel ecosystems: implications for conservation and restoration. Trends Ecol. Evol. 24, 599–605.. 622 623 624. Huhta, E., Mappes, T., Jokimaki, J., 1996. Predation on artificial ground nests in relation to forest fragmentation, agricultural land and habitat structure. Ecography (Cop.). 19, 85–91.. 26.
(28) 625 626. Jokimaki, J., Huhta, E., Jokimäki, J., 2000. Artificial nest predation and abundance of birds along an urban gradient. Condor 102, 838.. 627 628 629. Jokimäki, J., Kaisanlahti-Jokimäki, M.-L., Sorace, A., Fernández-Juricic, E., RodriguezPrieto, I., Jimenez, M.D., 2005. Evaluation of the “safe nesting zone” hypothesis across an urban gradient: a multi-scale study. Ecography (Cop.). 28, 59–70.. 630 631 632. Junta de Castilla-La Mancha, 2013. Datos meteorológicos de Red de la Calidad del Aire de Castilla-La Mancha [WWW Document]. URL http://pagina.jccm.es/medioambiente/rvca/meteo.htm. 633 634. Legendre, P., 1993. Spatial autocorrelation: trouble or new paradigm? Ecology 74, 1659–1673.. 635 636. Lindenmayer, D.B., Fischer, J., 2006. Habitat fragmentation and landscape change: an ecological and conservation synthesis. CSIRO Publishing, Melbourne.. 637 638 639. Lindenmayer, D.B., Knight, E.J., Crane, M.J., Montague-Drake, R., Michael, D.R., MacGregor, C.I., 2010. What makes an effective restoration planting for woodland birds? Biol. Conserv. 143, 289–301.. 640 641. Lindsey, J.K., 2004. Introduction to Applied Statistics. A modelling Approach. Oxford University Press, Oxford.. 642 643 644. Ludwig, M., Schlinkert, H., Holzschuh, A., Fischer, C., Scherber, C., Trnka, A., Tscharntke, T., Batáry, P., 2012. Landscape-moderated bird nest predation in hedges and forest edges. Acta Oecologica 45, 50–56.. 645 646 647. Major, R.E., Kendal, C.E., 1996. The contribution of artificial nest experiments to understanding avian reproductive success: a review of methods and conclusions. Ibis (Lond. 1859). 138, 298–307.. 648 649. Murcia, C., 1995. Edge effects in fragmented forests: implications for conservation. Trends Ecol. Evol. 10, 58–62.. 650 651 652. Newson, S.E., Rexstad, E.A., Baillie, S.R., Buckland, S.T., Aebischer, N.J., 2010. Population change of avian predators and grey squirrels in England: is there evidence for an impact on avian prey populations? J. Appl. Ecol. 47, 244–252.. 653 654 655. Pangau-Adam, M.Z., Waltert, M., Mühlenberg, M., 2006. Nest Predation Risk on Ground and Shrub Nests in Forest Margin Areas of Sulawesi, Indonesia. Biodivers. Conserv. 15, 4143–4158.. 656 657 658. Pedersen, Å.Ø., Yoccoz, N.G., Ims, R. a., 2009. Spatial and temporal patterns of artificial nest predation in mountain birch forests fragmented by spruce plantations. Eur. J. Wildl. Res. 55, 371–384.. 27.
(29) 659 660. Perrins, C.M., 1998. The complete birds of the western Palearctic on CD-ROM, version 1.0. Oxford University Press, Oxford.. 661 662 663. Piper, S.D., Catterall, C.P., 2004. Effects of edge type and nest height on predation of artificial nests within subtropical Australian eucalypt forests. For. Ecol. Manage. 203, 361–372.. 664 665 666. Pita, R., Mira, A., Moreira, F., Morgado, R., Beja, P., 2009. Influence of landscape characteristics on carnivore diversity and abundance in Mediterranean farmland. Agric. Ecosyst. Environ. 132, 57–65.. 667 668. Purger, J.J., Meszaros, L., Purger, D., 2004. Ground nesting in recultivated forest habitats a study with artificial nests. Acta Ornithol. 39, 141–145.. 669 670 671. Reino, L., Beja, P., Osborne, P.E., Morgado, R., Fabião, A., Rotenberry, J.T., 2009. Distance to edges, edge contrast and landscape fragmentation: Interactions affecting farmland birds around forest plantations. Biol. Conserv. 142, 824–838.. 672 673 674. Reino, L., Porto, M., Morgado, R., Carvalho, F., Mira, A., Beja, P., 2010. Does afforestation increase bird nest predation risk in surrounding farmland? For. Ecol. Manage. 260, 1359–1366.. 675 676. Rey Benayas, J.M., Bullock, J.M., 2012. Restoration of Biodiversity and Ecosystem Services on Agricultural Land. Ecosystems 15, 883–899.. 677 678 679 680. Rey Benayas, J.M., de la Montana, E., Pérez-Camacho, L., De la Cruz, M., Moreno, D., Parejo, J.L., Suárez-Seoane, S., Galván, I. 2010. Short-term dynamics and spatial pattern of a nocturnal bird assemblage inhabiting a Mediterranean agricultural mosaic. Ardeola 57: 303-320.. 681 682 683. Rey Benayas, J.M., Galván, I., Carrascal, L.M., 2010. Differential effects of vegetation restoration in Mediterranean abandoned cropland by secondary succession and pine plantations on bird assemblages. For. Ecol. Manage. 260, 87–95.. 684 685 686. Rey Benayas, J.M., Martins, A., Nicolau, J.M., Schulz, J.J., 2007. Abandonment of agricultural land: an overview of drivers and consequences. CAB Rev. Perspect. Agric. Vet. Sci. Nutr. Nat. Resour. 2, 1–14.. 687 688. Roos, S., 2004. Nest Predation Processes and Farmland Birds: Habitat Selection and Population Dynamics of Predators and Prey.. 689 690. Salek, M., 2004. The spatial pattern of the Black-billed Magpie, Pica pica to predation risk on dummy nests. Folia Zool. 53, 57-64.. 691 692 693 694. Sánchez-Oliver, J.S., Rey Benayas, J.M., Carrascal, L.M., 2013. Differential effects of local habitat and landscape characteristics on bird communities in Mediterranean afforestations motivated by the EU Common Agrarian Policy. Eur. J. Wildl. Res. In press.. 28.
(30) 695 696. Santos, T., Tellería, J.L., 1992. Edge effects on nest predation in mediterranean fragmented forests. Biol. Conserv. 60, 1–5.. 697 698 699. Santos, T., Tellería, J.L., Díaz, M., Carbonell, R., 2006. Evaluating the benefits of CAP reforms: Can afforestations restore bird diversity in Mediterranean Spain? Basic Appl. Ecol. 7, 483–495.. 700 701 702. Schaefer, T., 2004. Video monitoring of shrub-nests reveals nest predators: Capsule Jays Garrulus glandarius are the most common predators, but carnivorous mammals and some other species also predate nests. Bird Study 51, 170–177.. 703 704 705. Shochat, E., Abramsky, Z., Pinshow, B., 2001. Breeding bird species diversity in the Negev: Effects of scrub fragmentation by planted forests. J. Appl. Ecol. 38, 1135– 1147.. 706 707. Spanish Agrarian Guarantee Fund, 2012. Spanish Agrarian Guarantee Fund [WWW Document]. URL www.fega.es. 708. StatSoft, 2011. Statistica 10 (data analysis software system).. 709 710 711. Suvorov, P., Svobodová, J., Koubová, M., Dohnalová, L., 2012. Ground Nest Depredation by European Black-Billed Magpies Pica pica : An Experimental Study with Artificial Nests. Acta Ornithol. 47, 55–61.. 712 713 714. Thompson, F.R., Burhans, D.E., 2004. Differences in Predators of Artificial and Real Songbird Nests: Evidence of Bias in Artificial Nest Studies. Conserv. Biol. 18, 373–380.. 715 716 717. Traba, J., García de la Morena, E.L., Morales, M.B., Suárez, F., 2006. Determining high value areas for steppe birds in Spain: hot spots, complementarity and the efficiency of protected areas. Biodivers. Conserv. 16, 3255–3275.. 718 719. Villard, M.-A., Part, T., 2004. Don’t Put All Your Eggs in Real Nests: a Sequel to Faaborg. Conserv. Biol. 18, 371–372.. 720 721 722. Virgós, E., Tellería, J.L., Santos, T., 2002. A comparison on the response to forest fragmentation by medium-sized Iberian carnivores in central Spain. Biodivers. Conserv. 11, 1063–1079–1079.. 723 724. Whelan, C., Dilger, M., Robson, D., Hallyn, N., Dilger, S., 1994. Effects of olfactory cues on artificial-nest experiments. Auk 111, 945–952.. 725 726 727. Zuria, I., Gates, J.E., Castellanos, I., 2007. Artificial nest predation in hedgerows and scrub forest in a human-dominated landscape of central Mexico. Acta Oecologica 31, 158–167.. 728. 29.
(31) 729. Table 1. Results of the Generalized Linear Mixed Model (binomial distribution with. 730. logit link function) analysing the effects on nest predation of distance to edge of tree. 731. plantations and height above ground of individual artificial nests located in 30 tree. 732. plantations on former cropland (random factor). p: statistical significance was estimated. 733. using a robust approach with quasi-ML standard errors. Significant predictor variables. 734. at p<0.05 are emboldened. Beta (): standardized partial regression coefficients; se:. 735. standard error of beta. df. . se. p. Distance to plantation edge (m). 1. -0.207. 0.305. 0.496. Height above ground (m). 1. -0.257. 0.223. 0.250. Plantation (random factor). 29. <<0.001. 736. 737 738. 30.
(32) 739. Table 2. Results of the Generalized Linear Model (Poisson distribution with log-link. 740. function) analyzing the effects of six predictor variables on the number of predated. 741. artificial nests at 30 tree plantations on former cropland. The total number of artificial. 742. nests placed at each plantation was used as an offset of the model. p: statistical. 743. significance was estimated using a robust approach with quasi-ML standard errors.. 744. Significant predictor variables at p<0.05 are emboldened. Beta (): standardized partial. 745. regression coefficients; se: standard error of beta. df. . se. p. Area (ha; log-transformed). 1. 0.127. 0.055. 0.021. Edge/area ratio. 1. -0.153. 0.061. 0.012. Magpie abundance (no. individuals). 1. 0.169. 0.061. 0.006. PC1 Vegetation structure. 1. -0.085. 0.043. 0.050. PC2 Vegetation structure. 1. 0.075. 0.041. 0.066. PC1 Land use types. 1. -0.165. 0.063. 0.009. 746 747. 31.
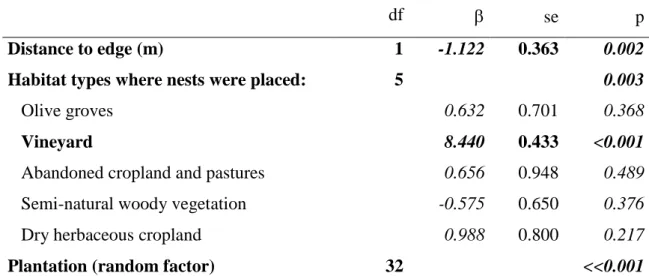
(33) 748. Table 3. Results of the Generalized Linear Mixed Model (binomial distribution with. 749. logit link function) showing the effects of predictor variables on predation of artificial. 750. nests on open farmland adjacent to 33 tree plantations (random factor). p: statistical. 751. significance was estimated using a robust approach with quasi-ML standard errors.. 752. Significant predictor variables at p<0.05 are emboldened. Beta (): standardized partial. 753. regression coefficients for continuous predictors and for the dummy variables built with. 754. the levels of the factor habitat types. df. . se. p. Distance to edge (m). 1. -1.122. 0.363. 0.002. Habitat types where nests were placed:. 5. 0.003. Olive groves. 0.632. 0.701. 0.368. Vineyard. 8.440. 0.433. <0.001. Abandoned cropland and pastures. 0.656. 0.948. 0.489. -0.575. 0.650. 0.376. 0.988. 0.800. 0.217. Semi-natural woody vegetation Dry herbaceous cropland Plantation (random factor). 32. <<0.001. 755 756. 32.
(34) 757. Table 4. Results of the Generalized Linear Model (Poisson distribution with log-link. 758. function) analysing the effects of predictor variables on the number of predated artificial. 759. nests on open farmland adjacent to 33 tree plantations. The total number of artificial. 760. nests in each open farmland habitat was used as an offset of the model. p: statistical. 761. significance was estimated using a robust approach with quasi-ML standard errors.. 762. Significant predictor variables at p<0.05 are emboldened. Beta (): standardized partial. 763. regression coefficients; se: standard error of beta. df. . se. p. Plantation area (ha; log-transformed). 1. 0.052. 0.024. 0.030. Average tree height in plantations (m). 1. -0.017. 0.036. 0.641. Magpie abundance (no. individuals). 1. 0.016. 0.031. 0.602. PC1 Land use types. 1. -0.061. 0.039. 0.116. 764 765. 33.
(35) 766. Table 5. Review of nest predation rates at (a) tree plantations, (b) forest fragments and. 767. (c) open habitat adjacent to tree plantations or forest fragments. The mean and range of. 768. predation rates and the mean ± sd of exposure days for the three habitat types (i.e. a, b. 769. and c) have been calculated by the authors of this study on the basis of the referred. 770. studies.. Habitat type. Landscape context. a) Tree plantations Conifer plantations. Sub-boreal forest. b) Forest fragments. Mean (range) predation rate (%). Mean no. exposed days (±sd). 59.5 (23.0-94.0). 12±2. 83.7 (64.7-94). 10. Pedersen et al. 2009. 23.0. 14. Vander Haegen & DeGraaf 1996. 41.2 (36.7-45.8). 13. Carignan & Villard 2002. 66.4 (38.9-88.0). 11±4. References. Forest fragments. Boreal agricultural. 88.0. 7. Andren 1992. Oak forest fragments. Mediterranean agricultural. 87.5. 8. Santos & Tellería 1992. 38.9. 14. Castilla et al. 2007. Fagus forest fragments. Eurosiberian agricultural. 41.7. 14. Ludwig et al. 2012. Cloud forest fragments. Andean agricultural. 48.9. 15. Arango-Vélez & Kattan 1997. Rainforest fragments. Tropical pastures. 71.9. 9. Estrada et al. 2002. 60.0 (13.7-100). 10±3. 99.0. 7. Andren 1992. 41.0. 14. Vander Haegen & DeGraaf 1996. 49.0. 15. Reino et al. 2010. c) Open habitat adjacent to tree plantation or forest fragments Forest fragments. Tree plantations and Oak forest fragments. Boreal agricultural. Mediterranean agricultural. 34.
(36) 13.7. 14. Castilla et al. 2007. 50.0. 8. Santos & Tellería 1992. Fallow. Template forest. 86.5. 14. Conner & Perkins 2003. Rainforest fragments. Pastures with tropical rainforest remnant. 79.0. 9. Estrada et al. 2002. Clearing. Turkey Oak forest. 24.0. 7. Purger et al. 2004. 771. 35.
(37) 772. Figure 1. Percentage of predated artificial nests by the first counting and by the second. 773. counting and of non predated nests at tree plantations (Experiment 1) and on adjacent. 774. open farmland habitat (Experiment 2).. 775. 36.
(38) 776. Figure 2. Partial residual plot of the influence of magpie abundance on predation. 777. intensity of nests at 30 tree plantations on former cropland. The residual plot shows the. 778. relationship with magpie abundance given that the other independent variables are also. 779. in the model, therefore partialling out their effects (see Table 2 for more details).. 3 2. # predated nests. partial residual of. 1 0 -1 -2 -3 -4 -5 -1. 780. 0. 1. 2. 3. 4. 5. 6. Magpie abundance (no. individuals per 0.78 ha). 37.
(39) Supplementary Material Click here to download Supplementary Material: Egg predation_SOM_AOE.docx. Sánchez-Oliver et al. Local habitat and landscape influence predation of bird nests on afforested Mediterranean cropland Supplemental On-line Material. Figure S1. Location of the study area in central Spain within the Ciudad Real province and distribution of the tree plantations on former cropland that were used to investigate nest predation at the tree plantations (Experiment 1), on open farmland adjacent to tree plantations (Experiment 2) and at both habitat types..
(40) Figure S2. Sketch of the experimental design and associated surveys that were used to investigate nest predation at tree plantations and on adjacent open farmland..
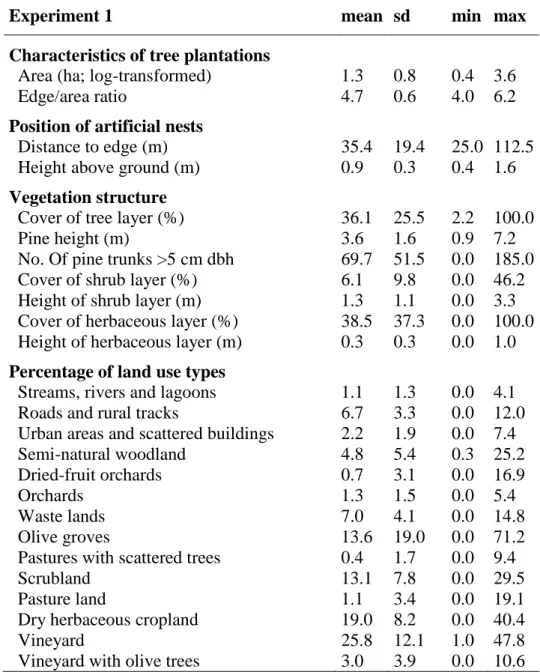
(41) Table S1. Mean, standard deviation (sd) and range (min/max) of the local habitat and landscape variables describing the characteristics of the 30 and 36 studied tree plantations for experiments 1 and 2, respectively. Note: all artificial nests at two out of the 38 tree plantations that were initially selected for Experiment 2 were lost due to ploughing or trampling.. Experiment 1. mean sd. min max. Characteristics of tree plantations Area (ha; log-transformed) Edge/area ratio. 1.3 4.7. 0.8 0.6. 0.4 4.0. Position of artificial nests Distance to edge (m) Height above ground (m). 35.4 0.9. 19.4 0.3. 25.0 112.5 0.4 1.6. Vegetation structure Cover of tree layer (%) Pine height (m) No. Of pine trunks >5 cm dbh Cover of shrub layer (%) Height of shrub layer (m) Cover of herbaceous layer (%) Height of herbaceous layer (m). 36.1 3.6 69.7 6.1 1.3 38.5 0.3. 25.5 1.6 51.5 9.8 1.1 37.3 0.3. 2.2 0.9 0.0 0.0 0.0 0.0 0.0. 100.0 7.2 185.0 46.2 3.3 100.0 1.0. Percentage of land use types Streams, rivers and lagoons Roads and rural tracks Urban areas and scattered buildings Semi-natural woodland Dried-fruit orchards Orchards Waste lands Olive groves Pastures with scattered trees Scrubland Pasture land Dry herbaceous cropland Vineyard Vineyard with olive trees. 1.1 6.7 2.2 4.8 0.7 1.3 7.0 13.6 0.4 13.1 1.1 19.0 25.8 3.0. 1.3 3.3 1.9 5.4 3.1 1.5 4.1 19.0 1.7 7.8 3.4 8.2 12.1 3.9. 0.0 0.0 0.0 0.3 0.0 0.0 0.0 0.0 0.0 0.0 0.0 0.0 1.0 0.0. 4.1 12.0 7.4 25.2 16.9 5.4 14.8 71.2 9.4 29.5 19.1 40.4 47.8 10.6. 3.6 6.2.
(42) Experiment 2. mean sd. min max. Characteristics of tree plantations Area (ha; log-transformed) Average pine height (m). 1.4 3.6. 0.8 1.4. 0.3 1.0. 3.6 6.4. Percentage of land use types Streams, rivers and lagoons Roads and rural tracks Urban areas and scattered buildings Semi-natural woodland Dried-fruit orchards Orchards Waste lands Olive groves Pastures with scattered trees Scrubland Pasture land Dry herbaceous cropland Vineyard Vineyard with olive trees. 0.2 2.3 0.4 0.9 1.0 0.2 1.3 17.1 1.8 0.6 8.7 33.8 29.5 0.9. 0.5 2.4 0.6 2.2 2.3 0.8 2.6 14.9 5.0 1.7 12.4 27.3 24.4 2.7. 0.0 0.0 0.0 0.0 0.0 0.0 0.0 0.0 0.0 0.0 0.0 0.6 0.0 0.0. 2.4 13.7 2.3 9.4 9.9 4.5 13.0 57.4 22.9 11.5 60.0 96.6 82.0 10.6. Habitat type where nests were placed Olive groves Vineyard Abandoned cropland and pastures Semi-natural woody vegetation Dry herbaceous cropland Waste lands, roads and rural tracks. % of nests 17.4 17.4 32.4 10.0 19.7 3.1. No. of nests 45 45 84 26 51 8.
(43)
Figure

+4


Documento similar
No obstante, como esta enfermedad afecta a cada persona de manera diferente, no todas las opciones de cuidado y tratamiento pueden ser apropiadas para cada individuo.. La forma
This study aimed to determine the influence of leachate on the physicochemical quality and hydrogeochemical processes which determine the chemical composition of groundwater in an
The Dwellers in the Garden of Allah 109... The Dwellers in the Garden of Allah
The objective of this study was to determine the diameter growth rates and evaluate the influence of tree size, crown class and neighbouring tree basal area on the growth of common
teriza por dos factores, que vienen a determinar la especial responsabilidad que incumbe al Tribunal de Justicia en esta materia: de un lado, la inexistencia, en el
The main objectives of this thesis were: (1) to investigate variations on bird abundance and species richness in the fields, with respect to past haying events
The purpose of this study was to determine the influence of visual behaviour (visual fixation location, number and duration) on decision making in volleyball blocking.. The
The present study had the objective to study the influence of the presence of bacteria on the tribological response. For that pin-on-plate reciprocating wear tests were
