Product-Line Instantiation Guided By Subdomain
Characterization: A Case Study
∗Patricia Pernich and Agustina Buccella and Alejandra Cechich
and Maximiliano Arias and Matias Pol’la
GIISCO Research Group
Departamento de Ingenier´ıa de Sistemas - Facultad de Inform´
atica
Universidad Nacional del Comahue
Neuquen, Argentina
[email protected],
{agustina.buccella,alejandra.cechich}@fai.uncoma.edu.ar,
{ariasmaxi89,matpolla}@gmail.com
and
Maria del Socorro Doldan and Enrique Morsan
Instituto de Biolog´ıa Marina y Pesquera “Almirante Storni”
Universidad Nacional del Comahue - Ministerio de Producci´
on de Rio Negro
San Antonio Oeste, Argentina
{msdoldan,qmorsan}@gmail.com
Abstract
Reuse-oriented software methodologies have emerged to provide a set of rules or guides for development and evolution of software systems by reusing existing domain engineering artefacts such as requirements, architecture, components, test cases, etc. Domain engineering methods, such as software product lines engineering, aim at reducing develop-ment time, effort, cost, and complexity by taking advantage of the commonality within a portfolio of similar products. However, these methodologies are not based on specific domains, instead they cover a wide range of domains without considering particularities within them. Therefore, in this work we define a novel approach in which the creation of a software product line is guided by a subdomain analysis process, oriented to a particular case within the marine ecology domain. The methodology is then applied to a specific organization in order to create a product of the line.
1
Introduction
The Software Product Line Engineering
(SPLE) [4, 12, 16] proposes a software develop-ment process by considering the main aspects
∗ This work is partially supported by the UNComa
project 04/E072 (Identificaci´on, Evaluaci´on y Uso de Com-posiciones Software) and by the PAE-PICT 2007-02312 (M´etodos y Herramientas para Software Masivamente Dis-tribuidos).
and restrictions of the domains in which the lines are being built. The main characteristics involved in this discipline are [16]: variability, in which individual systems are considered as variations of a common part; architecture-based, in which the software must be developed by considering the similarities among individual systems; and a
extensions of UML diagrams [7, 8, 12, 14, 15]. However, although these different approaches propose advantages with respect to different aspects of defining requirements, there is no standard way or set of specific rules to specify them [3, 13].
In addition, we have to take into account that the tasks of defining which requirements will be part of the line (with their variabilities) and which others will be product-specific are not easy and strongly depend on the domain involved. For ex-ample, in domains in which the level of specificity is higher, commonalities and variabilities should be, in theory, easier to define. This assumption can be analyzed in generic domains such as the geographic one. In this domain, the great number of implemented products share a set of common features1 that are in general available to be used on all of them. For instance common services such as map panning and zoom, edition of geographic features, layer management, etc. can be easily ex-tracted from any GIS. In addition, we can see an-other great number of features that are product-specific and are only implemented in some prod-ucts. Also, the standard information defined by the Open Geospatial Consortium2(OGC) and the ISO Technical Committee 2113(ISO/TC 211, Ge-ographic Information/Geomatics) provides a tax-onomy of geographic services that can be used as a starting point to define these common services. However, although this standard is useful to un-derstand the wide range of services every GIS is able to offer, these services are defined in a very generic and abstract way. Creating a software product line with these services would generate too many open issues that could be handled only by very complex variabilities. Therefore, it is nec-essary to delimit the set of geographic services to a specific subdomain, in our case, themarine ecol-ogy domain. The abstract services defined in the standard can be adapted to this subdomain in or-der to obtain and manipulate information useful for organizations working in this subdomain.
This work emerges as an extension of a previ-ous work presented in [11] in which we have shown an implementation of an SPL in the marine ecol-ogy subdomain. In this work, we define a new methodology for creating a software product line for geographic information within the same sub-domain. Geographic software here shares a set of common services that are essential for every ap-plication; therefore these common services must be identified and modeled as part of the product line together with different variations. To do so,
1
In this work a feature describes the functional and quality characteristics of a system [2, 12]
2
http://www.opengeospatial.org
3
http://www.isotc211.org/
we refine the services provided by the ISO 19119 std adapting them to the user’ requirements in the domain. Also, we define a set of steps and rules used in the creation of an application frame-work to be used as a platform for each product of the line. The framework covers behavior that is common to all products and allows developers to add product-specific features. The methodology applies knowledge obtained in the subdomain in order to guide the activities for creating the SPL. This paper is organized as follows: next section describes our methodology to create a subdomain-oriented software product-line within the geo-graphic domain. Section 3 shows our application of the methodology to create a software product line for the marine ecology subdomain. Then, we describe the instantiation of the product line ap-plied to a real project. Future work and conclu-sions are discussed afterwards.
2
A Subdomain-Oriented Software
Product Line Methodology
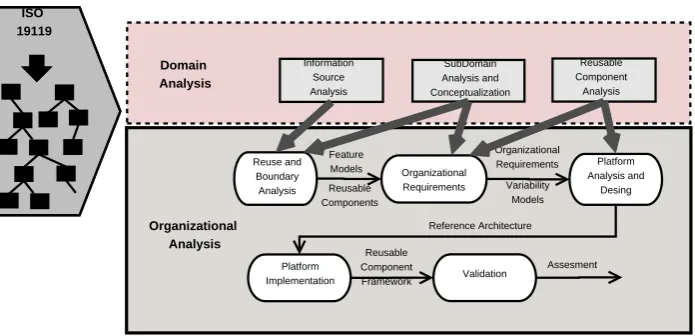
Our development methodology combines ad-vantages of several methodologies widely refer-enced in academy and industry [2, 6, 9, 12] and extends them in order to apply a subdomain view which guides the development of a software prod-uct line. Figure 1 shows the main activities of the methodology concerning the domain engineer-ing phase. This phase is divided into two main analisys: subdomain and organizational. At the first analysis, we define three processes which im-pact directly on the activities defined at the sec-ond analysis. The gray rectangles in the figure de-note the processes of the subdomain analysis and their influence into the activities of the organiza-tional analysis. At the organizaorganiza-tional analysis, the subdomain information is used to analyze organi-zations within the subdomain. The information modeled and implemented at the organizational analysis will be a subset of the information cap-tured at the subdomain analysis.
Next, we briefly describe the main activities of the three processes defined in the subdomain anal-ysis.
• Information source analysis: This process
ISO 19119
Information Source Analysis
SubDomain Analysis and Conceptualization
Reusable Component
Analysis
Organizational Analysis
Reuse and Boundary Analysis
Organizational Requirements
Platform Analysis and
Desing
Platform
Implementation Validation Feature
Models Reusable Components
Organizational Requirements Variability
Models
Reference Architecture
Reusable Component Framework
Assesment
[image:3.595.125.473.68.236.2]Domain Analysis
Figure 1. Activities of the Domain Engineering Process within a Geographic Subdomain
people experienced who can be currently (or not) working at these organizations and collaborating by providing useful information about different aspects to be considered. They provide specific information about their requirements and the way in which they perform their tasks.
• Subdomain analysis and conceptualization:
Here, the information recovered in the pre-vious process is used to analyze and orga-nize the features4or services that the subdo-main should offer. These features are defined by taking into account the standard services (ISO 19119 std) and the information provided by domain experts. In addition, in this pro-cess the subdomain must be conceptualized. Different software artifacts can be used here, such as class models, process models, etc.
• Reusable component analysis: This process
identifies the set of reusable components that could be used to implement the features de-fined in the last process. Aspects as flexibil-ity, evolution and maintenance must be care-fully specified by means of the definition of the general structure of the subdomain. This process defines a reference model which will be refined by the activities at the organiza-tional analysis. Thus, it must be created a preliminary structure composed of reusable components derived from the features ob-tained in the previous processes.
Following, we briefly describe the main ac-tivities at the organizational analysis (Figure 1) driven by the subdomain analysis processes (de-scribed previously).
4
In [2] a feature is defined as logical unit of behavior that is specified by a set of functional and quality requirements
• Reuse and boundary analysis: This activity
defines the organizational boundary and com-monality and variability features. Thus, by considering the features specified in the sub-domain analysis and conceptualization pro-cess and the information from domain ex-perts, the scope of the product line must be defined. Then, this activity analyzes which of the features can be implemented by ge-ographic open source tools. In addition to functional features, other task in this activ-ity is to identify non-functional requirements (quality aspects). In general, this type of re-quirements are modeled by the software engi-neers and will impact on the tasks of the next activities.
• Organizational requirements: In this
activ-ity, we use the information of the common-ality and variability features identified in the last activity and the information provided by thesubdomain analysis and conceptualization
and reusable component analysis processes. The main goal here is to define the range of products and features that the line is able to implement. As our methodology follows a minimalist approach, only the features used in all products are part of the product line. This approach allowed us to fully implement only common features and let the product-specific features be implemented by each dif-ferent organization. Thus, our software prod-uct line is then seen as a platform[16].
• Platform analysis and design: This
order to add the variabilities together with the design decisions to implement them. Sec-ondly, the features are reorganized into two sets of requirements to separate functional from non-functional (quality) needs. These sets will be the basis to define our architec-ture’s components.
• Platform implementation: In this activity the
components that are common for all prod-ucts, that is, the components of the line, are implemented. This activity creates the ap-plication framework which will be used as a platform for each product of the line. The framework must also allow developers to add the product-specific features.
• Validation: There are several aspects to
ana-lyze within this activity. Firstly, some test cases must be defined in order to test the framework and the specification of the prod-uct line. Secondly, when a new prodprod-uct is developed, we must test this new instantia-tion (as the one we will describe in Subsecinstantia-tion 3.1).
3
Building the Software Product
Line at the Ecology Domain Level
In this section we describe the design and im-plementation of the subdomain-oriented software product line methodology within themarine ecol-ogy subdomain. In order to do so, we work in collaboration with two organizations working on this subdomain: the Instituto de Biolog´ıa Ma-rina y Pesquera “Almirante Storni”5 (IBMPAS), and the Centro Nacional Patag´onico6 (CENPAT-CONICET). Both organizations are responsible for analyzing and storing information about sea surveys in three gulfs of the Argentinian Patag-onia (San Mat´ıas, San Jorge and Nuevo Gulfs). Each survey, performed once a year (when it is possible), collects information about the popula-tion of specific species living in this area. This information is then used for spatial processing in order to obtain information about spatial distri-bution of data, population variation patterns in different scales, etc.
Next, in order to describe and analyze our expe-riences on the creation of the marine ecology SPL, we specify the main activities performed within the processes defined in Figure 1. By considering the subdomain analysis, in this case, the marine ecology subdomain, we performed the following activities:
5
http://ibmpas.org/
6
http://www.cenpat.edu.ar/
• Eliciting requirements of domain experts and
analyzing existing applications: The experts working on the ecology marine organizations, provided us the first requirements that they needed to perform their daily activities. This was useful to define the first set of services within this subdomain. Next, we analyzed the existing applications by considering the geographic tools that are currently used in these organizations. In our analysis, we ob-served that few organizations had applica-tions involving geographic information. They had used only office software tools in which almost all the tasks were made manually. In this way, we decided to analyze source soft-ware tools available on the Web that fulfill at least some of the requirements in the subdo-main. In [11] we have classified and analyzed some of these tools. This analysis was useful to know which software components or appli-cations can be reused to implement specific services.
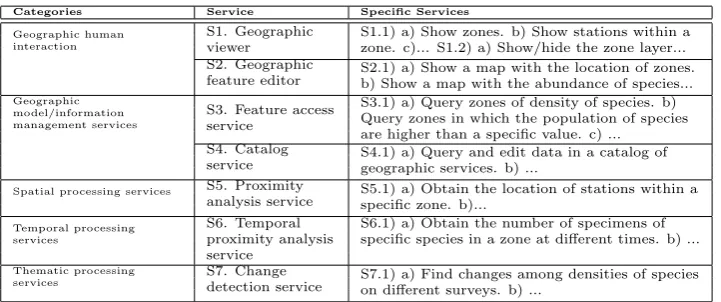
• Specializing the service taxonomy defined in
the ISO 19119: By considering the informa-tion provided by domain experts and the soft-ware tools available, we specialized the ser-vice taxonomy in order to define the set of services that are specific of the marine ecol-ogy domain. Table 1 shows part of these ser-vices in whichcategories andservicecolumns are defined according to the standard. For brevity reasons we do not include here all of them.
• Designing services by using different software
artefacts: In our work, we firstly defined the conceptual model which is used by all the ser-vices in order to implement their functionali-ties. In addition, for each service we defined a set of software artefacts (specifically, use cases and collaboration diagrams) to represent dif-ferent aspects of the services.
• Defining the preliminary reference model by
designing reusable components: By consider-ing the particularities of the marine ecology domain and the n-tier architecture proposed in the ISO 19119 std., we defined a layered architectural style in order to improve mod-ifiability and scalability aspects. It is com-posed of three main layers,geographic model,
geographic processing, and user interface. In addition, for each layer we specified the com-ponents according to the services defined in Table 1. For instance, the second layer defines services involving processing; part of them are services S5-S7 described in table.
Categories Service Specific Services
Geographic human interaction
S1. Geographic viewer
S1.1) a) Show zones. b) Show stations within a zone. c)... S1.2) a) Show/hide the zone layer... S2. Geographic
feature editor S2.1) a) Show a map with the location of zones.b) Show a map with the abundance of species...
Geographic model/information management services
S3. Feature access service
S3.1) a) Query zones of density of species. b) Query zones in which the population of species are higher than a specific value. c) ... S4. Catalog
service S4.1) a) Query and edit data in a catalog ofgeographic services. b) ...
Spatial processing services S5. Proximity
analysis service S5.1) a) Obtain the location of stations within aspecific zone. b)...
Temporal processing services
S6. Temporal proximity analysis service
S6.1) a) Obtain the number of specimens of specific species in a zone at different times. b) ...
Thematic processing
services S7. Changedetection service S7.1) a) Find changes among densities of species
[image:5.595.118.479.68.219.2]on different surveys. b) ...
Table 1. Part of geographic services required by the marine ecology subdomain and defined according to the ISO 19119
within the marine ecology subdomain, we per-formed the following activities:
• Determining the costs and staff needed to
build the SPL: The specific services defined in the last activities and the actual situa-tion of the organizasitua-tions in this subdomain, determined that the costs and staff needed were analyzed by taking into account two main phases. In the first one, we analyzed the aspects needed to implement the prod-uct line and its supporting application frame-work. In the second phase, we analyzed what we needed to implement future product lines by instantiating the framework. The output of this activity was an organizational model considering all these aspects.
• Defining the set of geographic open source
tools to be used: Based on the classifica-tion and analysis of the geographic tools per-formed in the subdomain analysis and the set of services to be implemented we selected the definitive set of these tools to implement them. All this information was put in a fea-ture/tool matrix in order to visualize which open source tools implement which features and define the future component/application reuse.
• Defining the scope of the line and designing
variability: The task here is to create a prod-uct/feature matrix indicating the services re-quired by each product. Then, by using this matrix, the services to be part of the line must be derived. For example, in our SPL, services S1-S3 and S5-S6 are part of the product-line and S7 is a product-specific feature that will be implemented only by Product 1 (see Table 1). Then, service S107is only implemented by Product 2. In addition, within each feature
7
S10 analyzes the advance of the undaria pinnat´ıfida
VP
Show density results
V
Histograms
V
Label Maps
V
Table
Variability Diagram
Figure 2. Variability model item associ-ated with the Sequence Diagram of the service S7.1: Find changes among densi-ties of species
we determined the commonality and variabil-ity models. For example, for the feature S2.1, the variability model described the two vari-ants of editing and seeing geographic features - by using maps or tables.
• Adding and designing variability: We refined
the conceptual model and the models used to represent each service by adding the variabil-ities included on each of them by means of variability models8. Figure 2 shows the vari-ability model associated with the S7.1 service. In the figure we observe different representa-tions of the returned data about the distri-butions of species in different surveys. In the variability model, the data are always shown in a tabular way and histograms and labels are alternative choices.
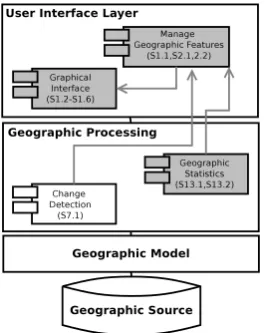
• Designing the reference architecture of the
line: The reference model defined in the
seaweed and its relation with the population of echino-derms
8
subdomain analysis was reorganized and re-fined in order to design the reference architec-ture. Figure 3 shows this model together with which services (defined in Table 1) are imple-mented by which components and the depen-dences among them. For instance, the change detection component (of the geographic pro-cessing layer) implements the service S7.1 and the geographic statistics component imple-ments services S13.1 and S13.29. The com-ponents colored in gray are comcom-ponents that are part of the platform and the others are specific for one o more products in the line.
Figure 3. Reference architecture of the SPL for the marine ecology domain
• Implementing the platform: In a first
proto-type [11] we had built a software platform with a set of 20 common services approxi-mately by using PostGIS10, GeoServer11 and OpenLayers12 on each level of the reference architecture. Then, we instantiated this plat-form in order to create a new product with three product-specific services. This instanti-ation is described in the next subsection.
3.1
Instantiating the Product Line: A
Case Study
In this section we show a instantiation of the SPL created specifically for the marine ecology subdomain. We build the Product 1 containing features of the product line plus a set of product-specific ones (S7). The other products in the soft-ware line will belong to other organizations within the marine ecological domain (Instituto Argentino
9
S13 generates statistics from geographic features pro-viding several ways to represent the information (charts, tables, etc.)
10
http://postgis.refractions.net/
11
http://geoserver.org/
12
http://openlayers.org/
de Oceanograf´ıa13, Centro Nacional Patag´onico14, and Laboratorio de Moluscos y Crust´aceos belong-ing to the University of Mar del Plata).
Product 1 emerged from a project between the GIISCO research group15and the Instituto de Bi-olog´ıa Marina y Pesquera “Almirante Storni”16 (IBMPAS). IBMPAS is responsible for analyzing and storing information about sea surveys in the San Mat´ıas Gulf, Patagonia Argentina. Each sur-vey, performed once a year (when it is possible), collects information about the population of spe-cific species living in this area. This informa-tion is then used for spatial processing in order to obtain information about spatial distribution of data, population variation patterns in different scales, etc.
In order to instantiate and develop the Product 1 we have performed the following steps:
• We have defined the services of Table 1
ac-cording to the requirements of the product. The features were refined to include the spe-cific layers required by the IBMPAS. Thus, in this product we implemented several layers including surveys, sea zones17, and stations18.
• We have instantiated the variability models
associated to the features (Table 2). For in-stance, the feature S7.1 in this product is im-plemented by using labels (not by using his-tograms).
• Finally, we have created the architecture
based on the reference architecture defined in the domain engineering process (Figure 3). This architecture contains the components defined for the SPL and those components specifically created for this product (S7).
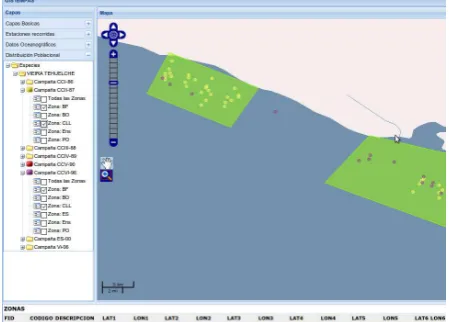
Part of Product 1 is already implemented. As an example, we describe here two of the services implemented – change detection and query geo-graphic feature services. The first one is shown in Figure 4 and returns information about the places (stations) in which a species (Viera Tehuelche) is found in different surveys (year 87 in yellow and year 96 in violet) in different zones (polygons in green). This service is very useful to analyze mi-gration movements of species. Feature S7.1 is im-plemented in this service. The other service, query geographic feature, can be also seen in Figure 4.
13
http://iado.criba.edu.ar/web/
14
http://www.cenpat.edu.ar/
15
http://giisco.uncoma.edu.ar/
16
http://ibmpas.org/
17
A zone is a maritime area bounded and defined with a specific name in the gulf.
18
The service presents a description table in the bot-tom when one or more zones are selected (in this case two zones were selected). This service is the implementation of feature S2.1 with thetable vari-ability instantiated.
Figure 4. A map showing thechange detec-tionandquery geographic feature services
Product 1 is partially implemented and avail-able on Internet at: http://geoserver.ods. org/geoserver/www/webgissao/index.html.
4
Conclusion and Future Work
In this work we have defined a methodology oriented to create a software product line in the marine ecology domain. Our work emerges as a solution to different organizations within this do-main. Although a great effort must be put initially for creating the product line, benefits appear when creating each new product. In this paper we have shown a real case study in which we have instanti-ated the line in order to create a specific product for the IBMPAS. The benefits of this model of de-velopment have not been directly measured, but one indicator of the success is that the develop-ment cost was drastically reduced.
As future work, the methodology and the framework need more validation, but we are aware that developing management guidelines is also crucial for successfully applying the approach. Within this line, we are developing a supporting tool (as Eclipse plug-in) to interact with software engineers and developers in the process of creation of a new product in the line.
References
[1] G. Arango. Domain Analysis. In J. Marciniak, editor, Encyclopedia of Software Engineering, volume 1, pages 424–434. WILEY, 1994.
[2] J. Bosch. Design and use of software architec-tures: adopting and evolving a product-line ap-proach. ACM Press/Addison-Wesley Publishing Co., New York, NY, USA, 2000.
[3] L. Chen and M. A. Babar. A systematic review of evaluation of variability management approaches in software product lines. Information and Soft-ware Technology, 53(4):344 – 362, 2011.
[4] P. Clements and L. Northrop. Software Product Lines : Practices and Patterns. Addison-Wesley Professional, August 2001.
[5] K. Czarnecki and U. Eisenecker. Genera-tive programming: methods, tools, and applica-tions. ACM Press/Addison-Wesley Publishing Co., New York, NY, USA, 2000.
[6] K. Czarnecki, S. Helsen, and U. W. Eisenecker. Formalizing cardinality-based feature models and their specialization. Software Process: Improve-ment and Practice, 10(1):7–29, 2005.
[7] L. Dobrica and E. Niemel¨a. A uml-based vari-ability specification for product line architecture views. InProceedings of the Third International Conference on Software and Data Technologies, ICSOFT, pages 234–239, Porto, Portugal, 2008. [8] H. Gomaa. Designing Software Product Lines
with UML: From Use Cases to Pattern-Based Software Architectures. Addison Wesley Long-man Publishing Co., Inc., Redwood City, CA, USA, 2004.
[9] K. Kang, S. Cohen, J. Hess, W. Nowak, and S. Peterson. Feature-Oriented Domain Analy-sis (FODA) Feasibility Study. Technical Report CMU/SEI-90-TR-21, Software Engineering In-stitute, Carnegie Mellon University Pittsburgh, PA., 1990.
[10] K. Kang, S. Kim, J. Lee, K. Kim, G. Kim, and E. Shin. FORM: A feature-oriented reuse method with domain-specific reference architectures. An-nals of Software Engineering, 5:143–168, 1998. [11] P. Pernich, A. Buccella, A. Cechich, S. Doldan,
and E. Morsan. Reusing geographic e-services: A case study in the marine ecological domain. InSoftware Services for e-World, volume 341 of
IFIP, pages 193–204. Springer Boston, 2010. [12] K. Pohl, G. B¨ockle, and F. Van der Linden.
Soft-ware Product Line Engineering : Foundations, Principles and Techniques. Springer, September 2005.
[13] I. Reinhartz-Berger and A. Tsoury. Specification and utilization of core assets: feature-oriented vs. uml-based methods. In Proceedings of the 30th international conference on Advances in concep-tual modeling, ER’11, pages 302–311, Berlin, Hei-delberg, 2011. Springer-Verlag.
[14] B. Rumpe and F. Robert. Variability in uml lan-guage and semantics.Software and Systems Mod-eling, 10(4):439–440, 2011.
[15] Z. T. and J. J´ez´equel. Software product line en-gineering with the uml: Deriving products. In
Software Product Lines, pages 557–588. 2006. [16] F. Van Der Linden, K. Schmid, and E. Rommes.
Software Product Lines in Action: The Best In-dustrial Practice in Product Line Engineering. Springer-Verlag New York, Inc., Secaucus, NJ, USA, 2007.