A proposal from the point of view of Information Visualization and Human
Computer Interaction for the visualization of distributed system load
Martín Leonardo Larrea
Departamento de Cs. e Ing.de la Computación, Universidad Nacional del Sur
Av. Alem 1253, B8000CPB Bahía Blanca, ARGENTINA
E-mail: [email protected]
Sergio Ruben Martig
Departamento de Cs. e Ing.de la Computación, Universidad Nacional del Sur
Av. Alem 1253, B8000CPB Bahía Blanca, ARGENTINA
E-mail: [email protected]
Silvia Mabel Castro
Departamento de Cs. e Ing.de la Computación, Universidad Nacional del Sur
Av. Alem 1253, B8000CPB Bahía Blanca, ARGENTINA
E-mail: [email protected]
and
Javier Echaiz
Departamento de Cs. e Ing.de la Computación, Universidad Nacional del Sur
Av. Alem 1253, B8000CPB Bahía Blanca, ARGENTINA
E-mail: [email protected]
ABSTRACT
In this article we show how the design of interfaces for the visualization of distributed system load can benefit from the combination of concepts and techniques from Information Visualization and Human Computer Interaction (HCI). Every distributed systems administrator must handle a high volume of information and the exploration and analysis of this data set has become increasingly difficult. We propose how to visualize the parameters involved in the load of a distributed system to obtain an effective visualization tool in order to reduce the user cognitive workload and help the user make the right decisions in a productive way.
Keywords: Distributed Systems, Human-Computer Interaction – Information Visualization – Focus + Context Visualization – Fisheye View.
INTRODUCTION
A process is an operating system abstraction representing an instance of a running computer program. Process migration is the act of transferring a process between two machines during its execution that enables dynamic load distribution, fault resilience, eased system administration, and data access locality. Despite these goals and ongoing research efforts, migration has not achieved widespread use. With the increasing deployment of distributed system in general, and distributed operating systems in particular, process migration is again receiving more attention in both research and product development.
Distributed system typically operates under continuously changing conditions and load balancing is critically important for efficient utilization of their resources since it maximizes their performance, and minimizes the process response time. The average process response time is usually considered the most important value for measuring the actual performance of a multitasking system.
As high-performance facilities shift from supercomputers to workstations networks, and the World Wide Web role is ever-increasing, it is expected that distributed systems and process migration will play a more important role and eventually to be widely adopted.
In many systems, the state of each node and process is distributed among a number of tables in the system, making it hard to extract the information about its behavior and load. This forces the user to explore large volume of information using unnatural representations which may lead to misinterpretations and to wrong decisions.
interface for the visualization of distributed system load can benefit from the combination of concepts and techniques from Information Visualization and Human Computer Interaction (HCI).
The visualization of the distributed system load will help the user to make decisions and allow him/her a better and quick comparison between the states of the nodes involved in the distributed system.
This paper continues the work done by [5], presenting a new visualization technique and adding the system topology as a new visual parameter. This work was developed at the Dpto. de Ciencias e Ingeniería de la Computación, Universidad Nacional del Sur, Bahía Blanca, as a interdisciplinary research between the Laboratorio de Investigación en Visualización y Computación Gráfica (VyGLab) and the Laboratorio de Investigación en Sistemas Distribuidos (LISiDi).
This paper is organized as follows: in the next section we present an introduction to the problem of distributed system load balance and the limitations considered for the visualization. Then we review the distributed system parameters that will be considered for the visual representation and afterwards the visual elements are presented and described. We also present an analysis of visualizations technique and their application in this context. Finally, we apply this result to create an effective visualization tool that reduces the user cognitive workload and help the user decision making process. In the last section we draw the conclusions and outline the future work.
SCOPE OF THIS APPROACH
The goal of this paper is to present the visualization of a distributed system load according to the parameters that will be established in the next section. In what follows we consider an heterogeneous distributed systems with N interconnected nodes. Each node has an identification string, a memory size, a CPU Usage value and the size of the currently memory in use. On each node we have M processes, M > 1, being executed.
We assume that the visualization system will not make nor propose decisions; the user will play that role based on the information presented by the visualization. The system will limit itself to offer all the necessary visual aids to help the user.
VISUALIZATION PARAMETERS The system parameters to be visualized can be divided into three groups.
1. Node base parameters a. Memory Size b. CPU Clock speed c. CPU Usage
d. Total memory in use 2. Processes base parameters
a. Memory size for each process b. Number of files opens c. Number of messages sent d. Number of messages received e. Volume of information sent f. Volume of information received 3. Distributed system topology
In the next section, we develop all aspects present in the visualizations in detail, analyzing the different parameters and their visual representation. Finally, the visual elements are integrated to allow a view of the load state from the distributed system.
NODE BASE PARAMETERS Memory Size
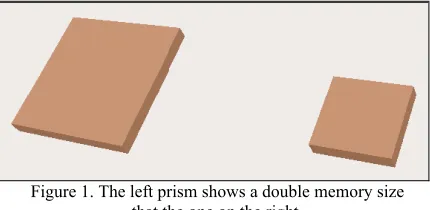
[image:2.595.312.527.474.579.2]The graphical representation of the memory size will be created using a square prism. The height of the prism is fixed and the width of the base depends on the memory size. In order to easily compare different nodes, all widths are normalized according to the maximum memory size present in the system. Figure 1 shows the visual representation for a node with 256 MB and another one with 128 MB. The user can see that the left prism has approximately double memory size compared to the right one.
Figure 1. The left prism shows a double memory size that the one on the right.
CPU Clock Speed
Figure 2. The visual representation on the left shows a CPU clock speed higher than the right one.
CPU Usage
[image:3.595.323.514.104.193.2]Combining the visual representation of the CPU clock speed with a new opaque square prism, will allow to create a new visual indicator. The CPU clock speed prism will have a high degree of transparency, and the height of the new prism will depend on the CPU percentage use.
Figure 3. The composition of the two prisms allows us to represent two parameters, the CPU clock speed and CPU
usage.
When the opaque prism reaches the height of the transparent one, it means that the CPU usage is 100%; when the opaque prism is not visible the CPU usage is around to 0%. Any intermediate height level of the opaque prism will be according to the currently CPU Usage percentage.
Figure 4. The CPU on the left has a CPU usage close to 100% while the one on the right is close to 50%. However the one on the right double the CPU clock
speed of the left one.
[image:3.595.313.526.305.369.2]The combination of all three visual representations will create the basic icon for a node in the distributed system.
Figure 5. The visual representation of a node.
Total Memory in use
[image:3.595.77.276.314.422.2]Finally, we show how to visualize the total memory in use. In order to do this, we will use the base size of the two prisms that conforms the CPU Clock Speed and the CPU usage. The base of this two elements will increase or decrease according to the memory in use. The memory size indicator represents the total real memory that a process can use.
Figure 6. Different states of the memory in use indicator.
However, when the total memory in use exceeds the real memory size and the virtual memory is used, there will be an occlusion on the memory size indicator.
Figure 7. When the memory in use became larger that the real memory size, the two prism hide the total
memory size indicator.
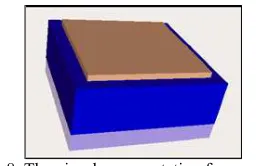
To avoid this situation the icon that represents the node will flip horizontally every time the total memory in use became larger than the real memory size.
Figure 8. The visual representation for a node using virtual memory.
PROCESS BASE PARAMETERS
[image:3.595.327.513.424.519.2] [image:3.595.84.270.508.630.2] [image:3.595.352.480.570.653.2]all the information relative to the nodes and to each process, will create a high amount of information that it will be impossible for the user not only to handle but also to understand.
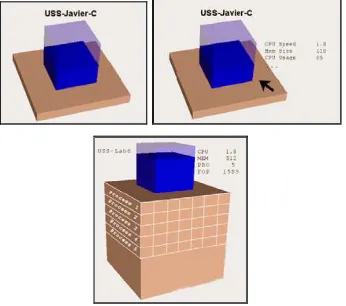
[image:4.595.334.497.204.337.2]To solve this problem, a technique used by both Information Visualization and HCI is semantic zoom. Through semantic zoom, the scale representation of an object is not just a graphical zoom but also a semantic one. We define three levels of semantic zoom, each one presenting more information than the previous one to the user. On the first level, each visual representation of a node presents the node identification. When the user positions his mouse over the node, the second level of semantic zoom is active; in this level the node identification is followed by a set of relevant data, previously defined by the user. Finally, the third level of semantic zoom is reached when the user clicks on a node. This level shows a list of all running process on the node and the process parameters values previously defined. This information is located on the faces of the memory size prism. To allow this, the height of the prism will grow according to the number of processes.
Figure 9. The three level of the semantic zoom.
DISTRIBUTED SYSTEM TOPOLOGY A system parameter that neither belongs to the node nor to the process is the system topology. Our focus is on visualizing not only the data associated with the nodes but also the structure of the network itself, that is, the system topology. In this case, the distributed system topology can be easily viewed as undirected graphs in a three dimensional space in a way that mimics the real network topology. Hence the navigation and exploration of the distributed system can be thought as navigation and exploration of a graph. With the increased use of large distributed system the navigation and exploration of these structures present a very important challenge.
[image:4.595.91.264.386.539.2]This challenge has been studied over the last decades within two major areas such as Information Visualization and Human Computer Interaction. Both areas have presented solutions to similar problems in different contexts. In the next subsections we outline an introduction to visualizations techniques and later we detail the technique used for the visualization of a distributed system load.
Figure 10. A distributed system compose of four nodes
Visualization techniques
One of the important challenges in a visualization system is how to present as much important information as possible in a given finite display area. When the structure of interest is too big to be viewed in detail all at once, the most straightforward solution is to allow the user to pan and zoom the visible area. The disadvantage of simply providing these interactions is that users often lose track of its current position with respect to the global structure. However, the addition of a smaller secondary window that shows a global overview with the current viewport location marked, can provide some guidance but forces the user to continually switch his/her focus of attention from one window to another, leading to disorientation.
A large class of visualization techniques has been developed to address this problem by attempting to smoothly integrate detailed views with as much surrounding context as possible, so that users can see all relevant information in a single view ([5], [6], [7], [10], [11]).
Visual representations
Advanced visualization interfaces attempt to overcome the size limitation problems associated with conventional interfaces by exploiting new visualization techniques. A full review of a large group of techniques can be found in [6] and [7].
An effective visualization must allow the user to know intuitively what sector of the distributed system he/she is looking at. Because of this, it is import to maintain the context of the user location at all times. All undistorted techniques present a lack of context which makes them a poor selection for our objective. Among distorted techniques, those ones with a non continuous magnification fail to provide a smooth transition between the focus areas and the context areas and force the user to mentally create this transition, increasing the cognitive overhead.
Figure 11.
Techniques with continuous magnification provide the best framework (see fig. 3). In this paper we have chosen to use a Fisheye View applied to a graph for the distributed system model
Fisheye View of a graph
A Fisheye View of a graph ([8], [9], [10]) shows things near the center of view in high magnification and detail; at the same time, it shows the whole structure with decreasing magnification and less detail as we get further away from the center of the view. Thus, a Fisheye View seems to have all the advantages of the other approaches without suffering from any of their drawbacks.
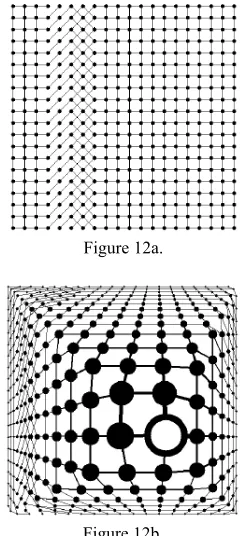
[image:5.595.357.477.106.374.2]Let Figure 12b be the Fisheye version of the graph in Figure 12a. In the Fisheye View, the vertex with thick border is the focus, i.e. the current point of interest of the viewer. The size and detail of a vertex in the Fisheye View depend on the distance from the vertex to the focus, a preassigned importance associated to the vertex, and the values of some user-controlled parameters.
Figure 12a.
Figure 12b.
The initial layout of the graph is called the normal view of the graph, and its coordinates are called normal coordinates. Each vertex has a position specified by its normal coordinates, and a size. Each vertex has also an assigned number to address its relative importance in the global structure. This number is called the a priori importance or the API of the vertex.
The coordinates of the graph in the fisheye view are called the Fisheye coordinates and the focus is a point in the normal coordinates. Each vertex in the Fisheye View is defined by its position, size, and the amount of detail to display. Finally, a visual worth or VW is assigned to each vertex in the Fisheye View, that is computed taking into account its distance to the focus in normal coordinates, and its a priori importance.
The generation of Fisheye Views demands two tasks:
x To apply a geometric transformation to the normal view in order to reposition vertices and magnify and demagnify areas close to and far away from the focus, respectively.
x To use the API corresponding to vertices to obtain their final size, detail and visual worth.
By combining these tasks we obtain a new view that priorizes the element in focus but does not lose the context.
[image:6.595.69.288.352.642.2]Fisheye View on the visualization of system load On Figure 13 we can see a normal view of the distributed system and on Figure 14 the user made focus on node USS-LAB6. As we can see, the distributed system is affected by the Fisheye distortion and the USS-Lab6 node shows all processes and their information.
Figure 13.
Figure 14.
CONCLUSIONS AND FUTURE WORK It is possible to transfer the results from Information Visualization and HCI on large data set exploration to the visualization of distributed system load. By doing this we applied techniques specially designed which have proved to be successful for these purposes and
we obtained an intuitive view of the system load that will assist the user.
We have developed some novel graphical icons for displaying distributed system load data together with focus+context techniques that can help extract meaningful insights from the data currently available.
Now we are working on techniques that permit the graphs to continue to reveal relationships in the context of much more data and also on an extension of the view to make the visualization a way to control the system. In this context an important future goal is to allow more than one focus element at a time.
We are also analyzing how the user will interact with the visualization to migrate a process and finally we are also evaluating the inclusion of SMTP, Symmetric Multiprocessing.
REFERENCES
[1] Daniel A. Kleim, “Information Visualization and Visual Data Mining”. IEEE Transactions on Visualization and Computer Graphics, Vol. 7, No. 1, January-March 2002.
[2] Kosara, R. and Hauser, H., “An Interaction View On Information Visualization”, Proceedings of the Eurographics 2004, pp. 133-140.
[3] Dix, A., Finlay, J., Abowd, G., Beale, R., Human-Computer Interaction, Prentice Hall Europe, Second Edition, 1998.
[4] Shneiderman, B., Designing the User Interface, Addison-Wesley Publishing Company, 1998.
[5] Martig, S., Trutner, G., Vitturini, M., Alvez, C., Di Luca, S., Castro, S., Echaiz, J. and Ardenghi, J. . “Visualización del Balance de Carga en un Sistema Distribuido”. Jornadas Chilenas de Computación. 2001.
[6] Gerstmann, D.. “Advanced visual interfaces for hierarchical structures”. Human Computer Interaction. CSS480, Research Paper, Human Computer Interaction. March 8, 2001.
[8] Noik, E., “Layout-independent FishEye view on nested graphs”. Computer Systems Research Institute. University of Toronto, Toronto, Canada.
[9] Sarkar, M. and Brown, M., “Graphical FishEye views”. Proceedings of the SIGCHI conference on Human factors in computing systems, pp. 83-91, 1992.
[10] Card, S., Mackinlay, J., Shneiderman, B., “Readings in Information Visualization – Using Vision to Think”, Morgan Kaufmann, 1999.
[11] Sarkar, M. and Brown, M. “Graphical FishEye views”. Comunication of the ACM. December 1994/Vol 37, No. 12.
![Figure 13. [3] Dix, A., Finlay, J., Abowd, G., Beale, R., Human-Computer Interaction, Prentice Hall Europe, Second](https://thumb-us.123doks.com/thumbv2/123dok_es/4890048.70993/6.595.69.288.352.642/figure-finlay-abowd-computer-interaction-prentice-europe-second.webp)
