ESSAYS ON FIRM R&D STRATEGIES AND MARKET DESIGN
Olga Slivko
Dipòsit Legal: T. 183-2013
ADVERTIMENT. L'accés als continguts d'aquesta tesi doctoral i la seva utilització ha de respectar els drets de la persona autora. Pot ser utilitzada per a consulta o estudi personal, així com en activitats o materials d'investigació i docència en els termes establerts a l'art. 32 del Text Refós de la Llei de Propietat Intel·lectual (RDL 1/1996). Per altres utilitzacions es requereix l'autorització prèvia i expressa de la persona autora. En qualsevol cas, en la utilització dels seus continguts caldrà indicar de forma clara el nom i cognoms de la persona autora i el títol de la tesi doctoral. No s'autoritza la seva reproducció o altres formes d'explotació efectuades amb finalitats de lucre ni la seva comunicació pública des d'un lloc aliè al servei TDX. Tampoc s'autoritza la presentació del seu contingut en una finestra o marc aliè a TDX (framing). Aquesta reserva de drets afecta tant als continguts de la tesi com als seus resums i índexs.
ADVERTENCIA. El acceso a los contenidos de esta tesis doctoral y su utilización debe respetar los derechos de la persona autora. Puede ser utilizada para consulta o estudio personal, así como en actividades o materiales de investigación y docencia en los términos establecidos en el art. 32 del Texto Refundido de la Ley de Propiedad Intelectual (RDL 1/1996). Para otros usos se requiere la autorización previa y expresa de la persona autora. En cualquier caso, en la utilización de sus contenidos se deberá indicar de forma clara el nombre y apellidos de la persona autora y el título de la tesis doctoral. No se autoriza su reproducción u otras formas de explotación efectuadas con fines lucrativos ni su comunicación pública desde un sitio ajeno al servicio TDR. Tampoco se autoriza la presentación de su contenido en una ventana o marco ajeno a TDR (framing). Esta reserva de derechos afecta tanto al contenido de la tesis como a sus resúmenes e índices.
Essays on Firm R&D Strategies and Market
Design
A Thesis Presented to The Academic Faculty
by
Olga Slivko
In Partial Ful…llment
of the Requirements for the Degree Doctor of Philosophy
Ph.D. Supervisor: Bernd Theilen
ACKNOWLEDGEMENTS
Though few words are not enough to express my gratitude to all those people who were with me
during the years of work on my PhD project, I would still like to say how much I appreciate them.
First of all, I am in…nitely grateful to my supervisor Dr. Bernd Theilen. From the very beginning
of my PhD he o¤ered me invaluable support and advice. These three years he has patiently taught
me, guiding in my research and supporting when I had doubts. I turned to you and have always found
good advice, support and friendship. Thank you very much.
Second, I acknowledge my Master advisor David Perez-Castrillo for his support and insightful
comments.
Third, special thanks to Christian Rammer who allowed me to make my research visit at ZEW
and provided many insightful comments and suggestions in empirical work. I also thank all ZEW
members who made my visiting there very enjoyable.
I acknowledge suggestions and advice of the faculty members of Universitat Rovira i Virgili and
participants of conferences and research seminars in Florence, Saint-Petersburg, Valencia, Mannheim,
Turunc, Reus, Palma, Malaga, Rome. I am especially grateful to Matthias Dahm, Rheinilde
Veugel-ers, Cedric Schneider, Bettina PetVeugel-ers, Galina Zudenkova, Xose-Luís Varela, Ricardo Flores, Carolina
Manzano, Susana Iranzo, Miguel Manjon, Paul W.J. De Bijl for their helpful suggestions. They helped
me a lot to improve this project.
I feel very happy that I have had my friends with me during the years of my PhD. Thank you
dear Svetlana Ivanova, Olga Nikolaeva, Jaume Domenech-Hernandez, Victor Garro, Martin Hud,
Ulrich Laitenberger, Veronica Gombau, Magda Lleixa, Ksenia Gorkova, Elena Korshikova and all
PhD students and administrative personnel of Departament d’Economia at University Rovira i Virgili
and Master students at Barcelona Graduate School of Economics. You contributed to my PhD project
indirectly by drastically increasing my working productivity. Your friendship and support encouraged
to keep on working.
patience every day during these years. This project would be impossible without their love, support
TABLE OF CONTENTS
ACKNOWLEDGEMENTS . . . iii
LIST OF TABLES . . . vii
LIST OF FIGURES . . . viii
SUMMARY. . . ix
I THE EFFECT OF COMPETITION AND INTELLECTUAL PROPERTY PRO-TECTION ON R&D STRATEGY CHOICES OF GERMAN FIRMS: AN ANALY-SIS AT A FIRM AND AN INDUSTRY LEVEL . . . 1
1.1 Introduction . . . 1
1.2 Literature review . . . 3
1.3 Data . . . 7
1.4 Empirical model . . . 12
1.5 Results . . . 15
1.6 Robustness check: an analysis of …rms’R&D strategies at the industry level . . . 17
1.7 Discussion . . . 20
1.8 Concluding remarks . . . 21
II INNOVATION OR IMITATION? THE EFFECT OF SPILLOVERS AND COM-PETITIVE PRESSURE ON FIRMS’R&D STRATEGY CHOICE . . . 31
2.1 Introduction . . . 31
2.2 A duopoly model . . . 36
2.3 Extensions . . . 41
2.3.1 Asymmetric …rms . . . 41
2.3.2 n …rms . . . 44
2.4 Concluding remarks . . . 47
2.5 Appendix. . . 48
2.5.1 Proof of Proposition 1 . . . 48
2.5.2 Proof of Proposition 2 . . . 50
2.5.3 Proof of Proposition 3 . . . 52
2.5.4 Proof of Proposition 4 . . . 53
III DIRECT AND INDIRECT SUBSIDIES IN MARKETS WITH SYSTEM GOODS
IN THE PRESENCE OF EXTERNALITIES . . . 58
3.1 Introduction . . . 58
3.2 The model . . . 64
3.3 Equilibrium ‘laissez faire’outcomes . . . 68
3.4 Subsidies . . . 70
3.4.1 The indirect subsidy . . . 70
3.4.2 The direct subsidy . . . 73
3.4.3 The choice of optimal policy . . . 75
3.5 An alternative timing of consumer choice . . . 76
3.6 Extension: compatibility between S- and E-based components . . . 79
3.7 Concluding remarks . . . 83
3.8 Appendix . . . 86
3.8.1 Proof of Proposition 1 . . . 86
3.8.2 Proof of Proposition 2 . . . 86
3.8.3 Proof of Proposition 3 . . . 87
3.8.4 Proof of Proposition 4 . . . 88
3.8.5 Proof of Proposition 5 . . . 88
LIST OF TABLES
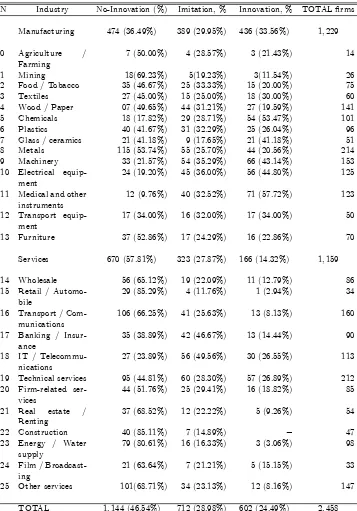
1 The patterns of innovative activity in German manufacturing and services industries
(2488 observations, year 2005) . . . 24
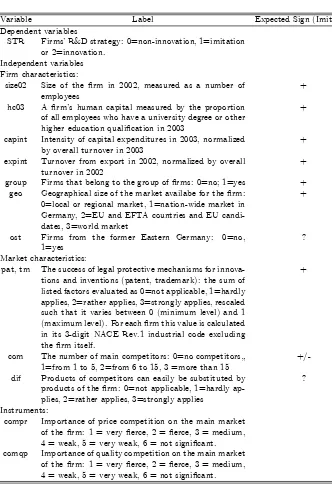
2 Description of variables . . . 25
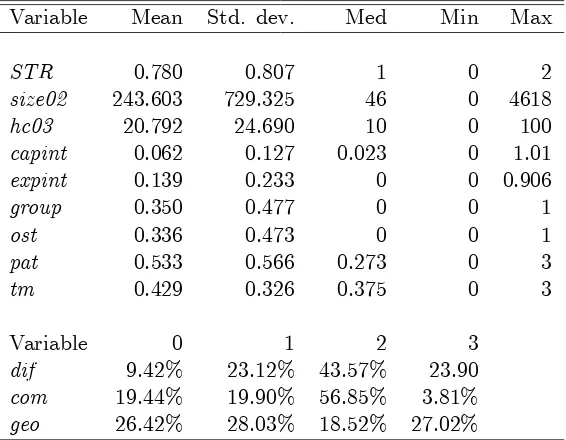
3 Descriptive statistics (2176 observations, year 2005) . . . 26
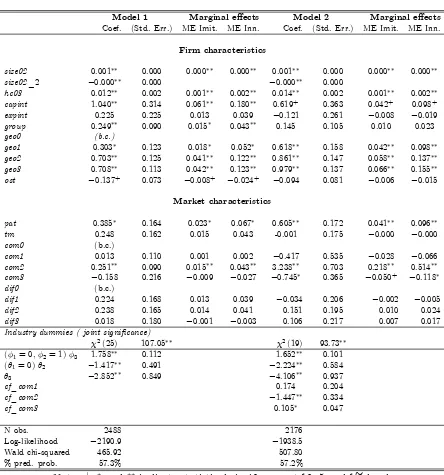
4 Stereotype logit regressions on str (at the …rm level) . . . 27
5 Marginal e¤ects of 1) the number of competitors for a range of patent protection ef-…ciency values; 2) patent protection e¢ ciency for the categories with the number of competitors in Model 2 . . . 28
6 The description of …rm and market characteristics by industry classes (180 observations, year 2005). . . 29
LIST OF FIGURES
1 The three regions of model equilibria for b= 1, = 1,a c= 4and K = 1;5. . . 56
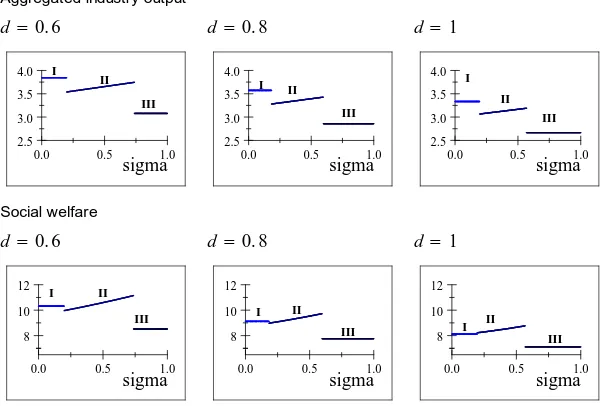
2 Aggregated industry output and social welfare as functions of for b= 1; a c = 4;
= 1, andK = 1:5. . . 56
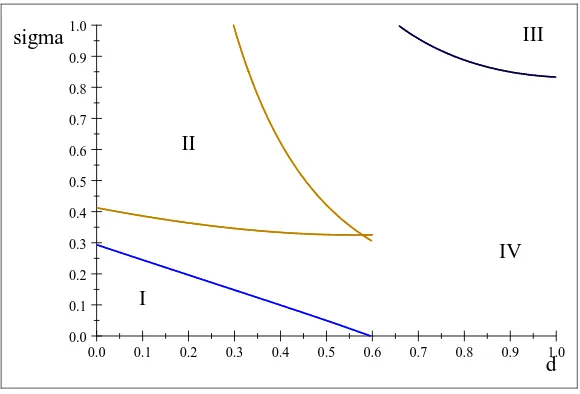
3 The four regions of model equilibria for b= 1, = 1,M = 8, = 1120 and K = 1:5. . . . 57
4 The regions of model equilibria for b= 1, = 1,a c= 4 andK = 1:5. . . 57
5 The structure of a market for system goods. The dashed line shows how the market is divided between producers of S- and E-based system goods. . . 89
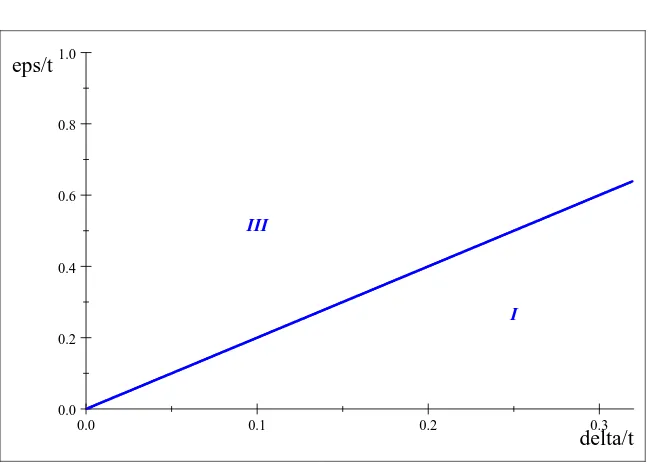
6 The four regions for optimal subsidies in market A for the superior technology adoption. 89
7 The four regions for optimal subsidies in market A for the superior technology adoption. 90
8 The three regions for optimal policy interventions in markets A and B. . . 90
9 The …ve regions for optimal policy interventions in markets A and B. . . 91
10 The structure of a market for system goods in the case of perfect compatibility between S- and E-based components. The dashed line shows how the market is divided between di¤erent system goods. . . 91
SUMMARY
This thesis includes three essays on …rms’R&D strategies and standard choices under
di¤er-ent market structures. The …rst two chapters contribute to the literature on …rm innovation. The
third chapter contributes to the literature on standard adoption. Each chapter can be considered
independently of the rest.
Chapter 1 empirically investigates how …rms choose their R&D strategies depending on both
internal …rm characteristics and external market parameters, focusing on the e¤ect of intellectual
property protection and competitive pressure. Three R&D strategies are considered: to abstain from
innovation, to imitate or to innovate. The analysis draws upon the data for German …rms from
manufacturing and services sectors covering the year 2005. The results show that the e¢ ciency of
patent protection positively a¤ects innovation and imitation for any level of competition except the
case of the markets with few competitors. In markets with few competitors better patent protection
raises …rms’incentives to innovate (to introduce market novelties) and decreases …rms’incentives to
imitate (to introduce improvements into already existing products). Finally, in markets where …rms
have almost monopoly power an increase in patent protection enhances the introduction of improved
products (i.e. imitation) more than the introduction of new products (i.e. innovation). A decrease
in competitive pressure from many to few competitors positively a¤ects the propensity of …rms to
improve already existing products, and to introduce market novelties. This e¤ect varies with patent
protection e¢ ciency. For low levels of patent protection both innovation and imitation are enhanced,
while for high levels of patent protection imitation is reduced and innovation is enhanced. A further
decrease in competitive pressure from few competitors to no competitors diminishes innovation and
favours imitation. The analysis of …rm R&D strategy choices at the industry level provides support
to conclusions obtained at the …rm level.
In order to provide a theoretical rationale for the observed evidence on …rms R&D strategy choice
Chapter 2 assumes a …rm’s R&D strategy to be endogenous and allows it to depend on both internal
in R&D or abstain from own R&D and imitate the outcomes of innovators. This yields three types
of equilibria in which either all …rms innovate, some …rms innovate and others imitate, or no …rm
innovates. Firms’ equilibrium strategies crucially depend on external factors. We …nd that the e¢
-ciency of intellectual property rights protection positively a¤ects …rms’incentives to engage in R&D,
while excessive competitive pressure has a negative e¤ect. In addition, smaller …rms are found to
be more likely to become imitators when the product is homogeneous and the level of spillovers is
high. Regarding social welfare our results indicate that strengthening intellectual property protection
can have an ambiguous e¤ect. In markets characterized by a high rate of innovation a reduction of
intellectual property rights protection can discourage innovative performance substantially. However,
a reduction of patent protection can also increase social welfare because it may induce imitation. This
indicates that policy issues such as the optimal length and breadth of patent protection cannot be
resolved without taking into account speci…c market and …rm characteristics.
Chapter 3 derives a model for markets with system goods and two technological standards. An
established standard incurs lower unit production costs but causes a negative externality. In the
absence of policy intervention, with an established technological standard, …rms have no incentives
to adopt a superior standard. Therefore, the present paper compares the e¤ect of direct and indirect
cost-reducing subsidies in markets with system goods in the presence of externalities. The conditions
for optimal subsidies are indicated depending on the cost di¤erence between standards, the impact
of the externality and the presence of consumers’ "commitment" to a determined technology. If
consumers’purchasing decision is made before the prices of one of the components of the system good
are known, policy intervention is desirable only when the impact of the externality is not lower than
the cost di¤erence between standards. Then, if the impact of the externality is relatively similar to
the cost di¤erence between standards, it is optimal to give a direct subsidy only to the …rst technology
adopter to provide incentives for the transition to the superior standard. Furthermore, the higher the
externality becomes, the more technology adopters must be targeted with subsidies. This means that
in case of direct subsidies, both technology adopters should be given a direct cost-reducing subsidy per
unit of production using the superior standard. In case of indirect subsidies, the necessary amount of
cost-reducing subsidies should be given to the producers of the complementary component per volume
suggests that when the cost di¤erence between technological standards is high and the externality
is low or intermediate, direct subsidies are socially preferable. When the externality cost is high
and the cost di¤erence is low, direct and indirect subsidies perform equally. However, because the
optimal indirect subsidy is higher than the direct subsidy, the direct subsidy leads to higher social
welfare. If consumers’ purchasing decision is made after the prices of all components of the system
good are known the e¤ects of indirect and direct subsidies’are equal. In this case, if the production
cost di¤erence is low the …rst adopter might have natural incentives to adopt the superior technology.
This means that the adoption of the superior technology implies a lower cost for society. If the
production cost di¤erence is high, the adoption requires direct or indirect subsidies. Moreover, the
subsidy to the second adopter is higher than the subsidy to the …rst adopter. Finally, compatibility
between components based on di¤erent technological standards enhances an advantage of indirect
subsidies when both the externality cost and the cost di¤erence between an established and a superior
CHAPTER I
THE EFFECT OF COMPETITION AND INTELLECTUAL
PROPERTY PROTECTION ON R&D STRATEGY CHOICES OF
GERMAN FIRMS: AN ANALYSIS AT A FIRM AND AN
INDUSTRY LEVEL
1.1
Introduction
In recent economic literature the impact of market structure on …rms’ innovativeness has received
much attention. In particular, there are two major debates regarding the impact of intellectual
prop-erty rights (IPR) protection and competitive pressure. The …rst debate discusses the impact of IPR
protection on …rm innovative performance. In line with it, two confronting views are present.
Ac-cording to the …rst view, IPR protection is a necessary mechanism that provides incentives for …rms
to engage in R&D and encourages technology transfer between …rms. Therefore, strong protection of
intellectual property rights would be the optimal R&D policy (Arora and Gambardella, 1994; Gallini
and Scotchmer, 2002; Gans and Stern, 2003; Gans et al., 2008; Boldrin and Levine, 2008). However,
this view has recently been challenged by Aghion et al. (2001), Bessen and Maskin (2009) and Zhou
(2009) who show that stronger imitation fosters innovative e¤orts by incumbent …rms and patent
protection can block the future development of technologies. The second debate concerns the e¤ect of
competitive pressure on …rm innovation. Some studies suggest a monotonic (positive or negative)
re-lationship between competitive pressure and …rm R&D expenditures (Henderson and Cockburn, 1996;
Dasgupta & Stiglitz, 1980; Geroski, 1990; Blundell et al., 1999), while others propose a non-monotonic
inverted-U (Aghion et al., 2005) or U-relationship (Tishler and Milstein, 2009). Noteworthy, most of
the above mentioned studies use total R&D expenditures as a proxy for the entire innovation process
and assume that …rms’ innovation strategies are homogeneous, i.e., all …rms invest in R&D and
R&D activities within as well as across markets. This heterogeneity arises as the result of
…rms’deci-sions to engage in R&D or to abstain from own R&D and imitate the outcomes of innovators. Taking
…rms’R&D strategy choice into consideration indicates that any policy intervention, concretely, IPR
protection and competition policy, might not only a¤ect the amount of …rm R&D expenditures but
also the R&D strategies adopted by …rms.
The present study is novel in three ways. First, it analyzes …rms’ R&D strategy choice
distin-guishing between innovative and imitative strategy. Therefore, it employs a discrete choice model
(stereotype logistic regression). Second, we include explanatory variables that were not considered
jointly in previous studies. These are internal …rm characteristics and external market parameters,
concretely, the intensity of IPR protection, competitive pressure measured by the number of
competi-tors and the degree of product di¤erentiation. To the best of my knowledge, until now no studies have
investigated how both IPR protection and competitive pressure a¤ect …rms’R&D strategy choice. In
addition, no attention has been paid to potentially existing complementarities in the e¤ects of IPR
protection level and competitive pressure on …rms’choice to innovate and to imitate. Third, it extends
the analysis of …rms’ R&D strategy choice at the industry level, providing robustness check to the
results obtained at the …rm level with a count data model (negative binomial regression).
In the empirical model derived in this chapter, the dependent variable represents a …rm’s R&D
strategy choice between the following alternatives: no innovation, imitation and innovation. The
explanatory variables are internal factors (…rm size, human capital, capital and export intensity,
organizational structure and the geographical scope of the market) and external factors (the e¢ ciency
of IPR protection by patents and trademarks, competitive pressure measured by the number of main
competitors, and product substitutability). The results suggest that …rms’R&D strategy choices are
tightly related to internal …rm characteristics and external market factors. Firm size and human capital
quality positively a¤ect a …rm’s propensity to innovation and imitation, although the latter e¤ect is
higher in magnitude than the former. Geographical market size strongly positively a¤ects a …rm’s
propensity to improve existing products (imitation) and to introduce market novelties (innovation).
Regarding external factors, the results show that the e¢ ciency of patent protection positively
a¤ects the propensity of …rms to imitate or to innovate. A decrease in competitive pressure from
and to introduce market novelties. This e¤ect varies with patent protection e¢ ciency. When patent
protection is low, both innovation and imitation are enhanced, while when patent protection is high,
imitation is reduced and innovation is enhanced. A further decrease in competitive pressure from few
competitors to no competitors disseminates innovation and favours imitation.
The …ndings of this study suggest to look beyond overall R&D expenditures when analyzing
in-novative performance in industries. This is because …rms choose R&D strategies that in turn a¤ect
overall innovative performance of industries. In addition, the present analysis derives a link between
IPR protection policy and competition policy. The two policies should be tightly coordinated because
IPR protection and competitive pressure jointly a¤ect …rms’R&D strategy choice. In particular,
bet-ter patent protection or longer patent duration positively a¤ect innovation and imitation for any level
of competition except the case of the markets with few competitors. In markets with few competitors
better patent protection raises …rms’incentives to innovate and decreases …rms’incentives to imitate.
Finally, in markets where …rms have almost monopoly power an increase in patent protection
in-creases the introduction of improved products (imitation) more than the introduction of new products
(innovation).
The rest of the paper is arranged as follows. Section 2 presents a literature review. Section 3
describes the data and variables for the empirical analysis. The econometric model is presented in
Section 4. Section 5 discusses the results. Finally, Section 6 derives some policy implications and
concludes.
1.2
Literature review
This paper is related to a large literature on the relationship between market structure and innovation
strategy. Speci…cally, it is related to two strands. The …rst strand analyzes how …rms’R&D
invest-ments are a¤ected by market competition. Pioneer works in this …eld are those of Schumpeter (1934
and 1942) who argues that, on the one hand, market pressure may foster …rms’innovation, but, on the
other hand, it may decrease …rms’R&D investments because monopoly power of larger …rms acts as a
major accelerator of technological progress. Actually, there is still no accordance on this Schumpeterian
debate in theoretical and empirical studies. For example, some authors argue that more intensive
are temporary, only su¢ cient market power guarantees that …rms invest in R&D (Arrow, 1962; Futia,
1980; Gilbert and Newbery, 1982; Reinganum, 1983; or Zhou, 2009). This argument is supported by
empirical studies, which …nd that market concentration increases the pace of innovative change. For
instance, Henderson and Cockburn (1996) show that large …rms in the US pharmaceutical industry
perform R&D more e¢ ciently, as they can enjoy scale and scope economies. Using patent data of
UK manufacturing …rms, Ce…s (2003) …nds that, due to innovative e¤ort, the contribution of large
…rms to aggregated industrial performance is above the industry mean. On the other hand, market
concentration is also argued to have a dampening e¤ect on innovation because more intensive
compe-tition acts as an important incentive for …rms to innovate (Dasgupta & Stiglitz, 1980). Again, these
theoretical arguments are supported by empirical evidence (Geroski, 1990; Blundell et al., 1999).
These contradictory results led to the hypothesis that the e¤ect of market competition on …rms’
innovative e¤orts is non-monotonic. For example, Boone (2000) …nds that when competition is weak,
the incentives of less e¢ cient …rms to innovate increase. However, when competition becomes more
intense, the incentives of e¢ cient …rms to innovate grow. Aghion et al. (2005) suggest the existence of
an inverted-U relationship. Both, a low or high level of competition provide low incentives to innovate
while a medium level of competition fosters innovation of …rms operating on a similar technological
level (“neck-and-neck …rms”). On the contrary, Tishler and Milstein (2009) …nd that R&D investments
decrease with competitive pressure. However, at a certain level of competition …rms engage in "R&D
wars" and spend excessively on R&D.
The above mentioned literature assumes that …rms’innovation behavior is homogeneous, that is,
that all …rms innovate by spending on R&D. However, empirical evidence suggests that most markets
are characterized by an elevated heterogeneity of R&D activities. For instance, using data of Italian
…rms, Ce…s and Orsenigo (2000) and Ce…s (2003) …nd that in most markets there is a core of …rms that
are persistent innovators while other …rms either are occasional innovators or imitators. Czarnitzki
et al. (2008) …nd that, depending on a …rm’s role in the market, competitive pressure might have
a di¤erent e¤ect on innovative e¤ort. So, while entry pressure decreases the average investment per
…rm, it increases innovative e¤ort of market leaders. Vives (2008) distinguishes between process
R&D aimed at reducing production costs and product innovation aimed at new product introduction.
competitive pressure. The main …nding for process innovation is that an increase in the number
of competitors decreases cost-reduction expenditures, while an increase in product substitutability
increases it. For product innovation the results are ambiguous.
The second strand of the literature to which this paper is related are studies that distinguish
between …rms that innovate and those that imitate the outcomes of innovators’ activity.
Theoret-ical studies have analyzed the e¤ect of the possibility of imitation on innovative incentives in two
frameworks, economic growth models (Grossman & Helpman, 1991; Aghion & Howitt, 1992) and
oligopolistic competition models (Zhou, 2009). In both cases, the imitation rate is assumed to be
exogenously determined. In some studies, imitation is shown to foster the innovation activity of
technological leaders. This …nding challenges the common view that patent protection should be
strengthened. In fact, strong IPR protection may slow down the development of countries and
de-crease world welfare and consumer surplus(Helpman, 1993; Bessen & Maskin 2009; Che et al., 2009; Fershtman & Markovich, 2010). Additionally, Braguinsky et al. (2007) …nd that the relationship
between innovation and imitation itself depends on other factors such as the maturity of an industry.
When the industry is young and small, innovators do not have incentives to prevent imitation. But
when the industry expands, innovative e¤ort decreases because of imitation pressure. In other studies,
IPR protection is shown to be a necessary mechanism that provides incentives for …rms to engage in
R&D and encourages technology transfer between …rms. Therefore, Gans and Stern (2003), Gans et
al. (2008), Boldrin and Levine (2008) suggest strong protection of intellectual property rights as the
optimal R&D policy.
Most of this literature assumes that innovators and imitators are exogenously given. Exceptions in
the theoretical literature are Segestrom (1991) and Amir and Wooders (2000). Applying an economic
growth model, Segestrom (1991) allows …rms to participate in both innovative and imitative R&D
races. In the steady-state, …rms’equilibrium R&D strategies depend on the distribution of previous
R&D outcomes and the relative price of imitation. Firms are found to bene…t more from imitation in
industries with a single leader, while in industries with several leaders innovation is a more pro…table
strategy. In a standard oligopoly framework, Amir and Wooders (2000) show that, in equilibrium, …rms
choose their R&D strategies asymmetrically. This gives rise to an innovator/imitator con…guration in
been studied by a small number of authors. Using US marketing data, Robinson and Min (2002) …nd
that innovators face higher survival risks associated with technological uncertainties. On the other
hand, Zhou (2006) …nds that in the presence of demand uncertainty or with more competitive pressure
…rms obtain higher bene…ts from being pioneers in innovation. Shankar et al. (1998) analyze data on
sales and advertising of 13 brands of ethical drugs in the US. They show that imitators with a slightly
di¤erentiated product can grow faster than initial innovators. Therefore, in the presence of rapidly
changing technologies, in the long run, imitators obtain higher bene…ts than innovators because the
innovator’s initial pro…ts are rapidly discouraged.
The present paper builds upon Link and Neufeld (1986) who distinguish between, innovation,
imitation and non-innovation. Using cross-sectional data they analyze …rms’ strategy choice as a
function of …rm size, market share, and industry concentration. The present paper is similar to their
study in that it explores how market design a¤ects …rms’ choice between innovation and imitation.
However, we improve competitive pressure measures by considering various indicators such as the
number of competitors and product di¤erentiation and take into account IPR protection, which is
important for …rms’ incentives for product innovation. We explore how competition measures a¤ect
…rms’R&D strategy choice given di¤erent levels of IPR protection e¢ ciency in the industry.
Despite the extensive existing research on …rm innovativeness, empirical studies have the following
drawbacks. During the last decades they discussed the determinants of R&D activity mainly based
on internal …rm characteristics such as …rm size, appropriability of the outcomes of innovation, access
to international markets, cooperation with customers, suppliers and others (Patel and Pavitt, 1992;
Crépon et al., 1998; Loof and Heshmati, 2002; Veugelers and Cassiman, 2005). Less attention has
been paid to external factors. This certainly is due to the problems that its measurement rises. For
example, the intensity of market competition has been proxied with concentration measures, such
as concentration ratios or the Hirshman-Her…nadahl index, based on industry data (Geroski, 1990;
Blundel et al., 1999; Aghion et al., 2005). The problem with this approach is that the market in which
…rms compete can hardly be identi…ed by the industrial sector. So, …rms within one sector might not
compete at all if their products meet di¤erent consumer needs. Another example is the measurement
of spillovers. The average spillover level has been measured with industry data as an average of …rm
can protect the outcomes of their R&D activity by using legal protection mechanisms as well as by
secrecy. So, this indicator might wrongly re‡ect the spillover level in the industry or in the market.
The present empirical analysis contributes to the literature by including …rm internal
charac-teristics as well as external market parameters (competitive pressure, spillover level, and product
substitutability) in the analysis of a …rms’R&D strategy choice. This is important, because the
inno-vation strategy of a …rm must be considered in the context of its global market strategy as it serves
to maintain and improve the …rm’s market position. Therefore, when managers decide to launch
an R&D project, they consider both internal …rm characteristics and external factors such as rivals’
strategies, competitive pressure, knowledge speci…city, intellectual property protection, availability of
funding, public support, etc. A variation in one of these external factors might critically a¤ect the
…rm’s resources and capabilities and thereby the …rm’s innovation strategy.
The common problem with the measurement of these variables is that market characteristics such
as the …rm’s market position or the level of knowledge protection are not directly observable. The
Mannheim Innovation Panel (MIP), a survey used in this study, allows to improve the measures of
external factors. This is because …rms provide information about these factors according to their own
perceptions of market characteristics, which de…nitely determine their R&D strategies.
1.3
Data
To investigate the determinants of …rms’ R&D strategy choices, the data from the MIP innovation
survey is applied. This survey is conducted by the Centre for European Economic Research (ZEW)
on a yearly basis. It covers a representative sample of German …rms in manufacturing and service
sectors during the period 1995-2007. The data includes information regarding the introduction of new
products, services and innovation processes within …rms. The database has cross-sectional structure
such that survey questions di¤er across waves. Because only the 2005 innovation survey, which is
the 13th wave of the MIP, provides necessary data it is used for the purposes of this study. In this
survey, …rms are asked about both internal and external factors that a¤ect their commercialization and
innovation decisions during the period 2002-2004. Enterprises with 5 or more employees are covered.
The drawing probabilities are disproportional with higher drawing quotas applied for large enterprises,
the analysis at the industry level, additionally, the data provided by the Monopolkomission (Germany)
are used.
The dependent variable of the analysis at the …rm level represents a …rm’s R&D strategy choice
(str). str is a categorical variable that indicates if, between 2002 and 2004, a …rm did not conduct
innovations (0), introduced a product that is new for the …rm but known in the market (1) or introduced
a product that is new for the market (2). The questions in the survey that allow to distinguish
between innovators and imitators refer only to product innovations, therefore, implications derived in
the present study are applied, mainly, to product innovation. In addition, …rms that haven’t introduce
any new product because they aborted or did not …nish innovation during the period of observation
are excluded from the sample. This allows to exclude from consideration those factors that impede
innovation success despite a …rm’s willingness to innovate.
As it is common in the economic literature, we interpret the introduction of a product that is
new for the market as innovation while the introduction of a product that is new for the …rm (but
not for the market) as imitation. This interpretation is supported by Link and Neufeld (1986), who
surveyed 76 R&D active US manufacturing companies. The vice presidents were asked whether their
…rm’s overall R&D strategy was innovative or imitative and whether this classi…cation is meaningful.
All of them reported that although their …rms operated in several lines of business, one dominant
strategy characterized the overall R&D e¤ort. However, the dependent variable of their analysis has
an important drawback. It is based on the subjective vision of vice presidents of the companies
and has retrospective nature. Therefore, in the regression analysis with contemporaneous market
characteristics the problem of endogeneity arises. On the contrary, the dependent variable of the
present paper allows to identify the outcome of the strategy chosen by a …rm. Thereby, the direct
endogeneity due to the simultaneity in observations is avoided. The dependent variable employed in
this study can also be interpreted as the degree of innovation. Then, category 1 refers to incremental
innovation (the improvement of already existing products) and category 2 refers to more radical
innovation (the introduction of a new product, which did not exist in the market before).
The representative sample of German …rms used for this study shows that the rate of innovating
and imitating …rms varies across industries. In Table 1 we display the rate of innovating …rms for
observed in manufacturing sectors such as agriculture, mining, wood / paper, metals and furniture,
and many of the services sectors. On the other hand, in sectors such as chemicals, medical instruments
and electrical equipment we …nd that most …rms are innovators. Thus, we observe that …rms’R&D
strategies vary across industries and markets. Hereafter, to study …rms’ R&D strategy choices, we
include two categories of independent variables into our empirical model: variables that measure
internal and external factors. As commonly used in …rm-level studies, our internal factors are: …rm
size (size02) and its square (size02_2), the quality of human capital (hc03), capital intensity (capint),
export intensity (expint), a dummy for …rms’group membership (group), geographical market size to
which a …rm accesses (geo), and, speci…c to our data, …rm location in the territory of former Eastern
Germany (ost).1
Most studies on …rm innovation control for …rm size, measured by the number of employees or
turnover, as larger …rms are supposed to be more e¢ cient in the conduct of innovation (Henderson
and Cockburn, 1996; Shefer and Frenkel, 2005). In the present study size02 and size02_2 measure
the number of employees and its squared value to control for a non-monotonic e¤ect of …rm size.
Regarding size02, a positive e¤ect is expected. However, the magnitude of the e¤ect is expected to
decreases for very large …rms, resulting in a negative e¤ect ofsize02_2. Regarding thegroupdummy,
previous studies suggest that …rms, which belong to a group, have more incentives and resources for
innovation. geo is used as a proxy for the …rm’s market size. We create 4 dummies to distinguish
between geographical scope of markets that …rms access: local or regional markets, the German (i.e.
nation-wide) market, the market of EU member, EU candidate and EFTA member countries and the
world market. Following previous studies, positive e¤ects of groupand geo on a …rm’s propensity to
engage in R&D are expected.
Apart from the traditional internal factors mentioned above, the literature stresses the importance
of the so called "absorptive capacity" for …rms’innovation activity. According to Cohen and Levinthal
(1989), this term stands for a …rm’s ability to identify, assimilate and apply new knowledge given the
…rm’s experience, human capital skills, and organizational procedures’‡exibility and relevance. Firms
that have more advanced human capital are expected to dispose of more capability for R&D. Therefore,
hc03 is considered among …rm characteristics as a measure of human capital. There is a number of
1
ways to measure a …rm’s human capital (see Schmidt, 2005). Given the cross-sectional structure of our
data,hc03is measured as a …rm’s proportion of all employees with a university degree or other higher
education quali…cation in 2003. As …rm performance depends on its employees skills, the general level
of education, experience and training of employees, this seems to be a good proxy for a …rm’s human
capital quality. Finally, we use the dummy variableostto control whether a …rm is located in former
Eastern Germany. Historically, …rms that belong to the western and the eastern part of Germany
were a¤ected by di¤erent policies (subsidies, taxes, institutions). As a consequence, there might exist
a systematic di¤erence in the innovative performance between …rms in these regions.
Regarding the external factors, our variables are: intellectual property rights protection by patents
(pat) and trademarks (tm), competitive pressure (com), and the degree of product di¤erentiation (dif).
The MIP survey is based on …rms’perceptions regarding their external environment. Because
man-ager’s decisions are based on their subjective perceptions of external factors this allows to assess better
the determinants of …rms’R&D strategy choices. The external factorspat,tm,dif are represented by
categorical variables. In order to obtain information on them, each …rm was asked to what extent it
was a¤ected by these factors. Firms’answers are evaluated in Likert scale from 0 ("not applicable")
to 3 ("applies strongly").
The level of intellectual property protection is proxied bypatand tm. These indexes are measured
by the scores of the success of legal protection mechanisms for innovations and inventions (patents
and trademarks) reported by …rms. To deal with the possible endogeneity of these indexes, following
Schmidt (2006), we calculate for each …rm the average index value across the NACE 3-digit industry
code excluding the …rm in observation. A higher value of this index for each IPR protection mechanism
means that this mechanism achieves better intellectual property protection in the industry. A priori,
positive e¤ects of patents and trademarks e¢ ciency in the industry on …rms’incentives to imitate and
to innovate are expected. Nevertheless, the e¤ect on imitation might be smaller and would be rather
indirect via encouraging innovation.
The categorical variable com measures the number of main competitors reported by a …rm: more
than 15, from 6 to 15, from 1 to 5, or no competitors. Since a …rm has a better vision of its own market
structure, this indicator measures closer the intensity of market competition. For the estimation 4
from 1 to 5, and i = 3 no competitors. Because theoretical results in the literature are ambiguous,
we don’t have any clear expectations regarding the e¤ect of the number of competitors. Another
indicator for competitive pressure is the degree of product substitutability (difi). Again, dummies are
categorical variables (i= 0; :::;3).
Regarding industry dummies, following OECD taxonomy for NACE Rev.1 codes, we include
dum-mies for 26 aggregated industry sectors.2 This allows to control for unobserved heterogeneity in
innovative performance across sectors. The industry e¤ects on …rms’R&D strategy choice might be
twofold. On the one hand, industry dummies might capture the technological complexity of knowledge
in the industry. The fact that the technology is more advanced in the industry can impede
introduc-tion of improved and new products. On the other hand, industry dummies might indicate the level
of spillovers from rivals’innovation in the industry. Thus, in industries with higher rate of innovation
…rms can be more disposed to conduct innovation resulting in the introduction of improved and new
products.
From the correlation analysis we …nd that there are no systematic correlations between explanatory
variables that could a¤ect the results of the estimation. However, the inclusion of the number of main
competitors as a measure of competitive pressure into the model where the dependent variable is
a …rm’s outcome of product innovation might cause an endogeneity problem. This is because the
number of competitors is reported according to the perceptions of …rms. Therefore, this regressor can
be correlated with unobserved …rm characteristics, which allow …rms to introduce improved and new
products to the market. As a consequence, the number of main competitors is potentially correlated
with the error term of the regression. To control for possible endogeneity the present study applies the
control function approach proposed by Petrin and Train (2010). The basic idea of the control function
approach is to derive an additional regressor that controls for the part of the endogenous regressor
that depends on the error term. If this is done, the remaining variation in the endogenous variable is
independent of the error, and the estimated model is consistent. The instruments for control function
are categorical variables indicating the importance of price and quality competition in the market
2The model was also estimated using industry classi…cation NACE Rev 1.1 (Eurocomission). Following it, industries
compri, comqpi. The estimated control functions for each category of the potentially endogenous
regressors com1-com3 are included into the main regression as cf_com1-cf_com3. Because control
functions turn to be signi…cant, this proves that, initially, the variables com1-com3 were endogenous
(see Table 4). Additionally, a robustness check is performed for variables that could be potentially
endogenous, concretely, IPR protection e¢ ciency indicators. The result that control functions are not
signi…cant suggests these variables to be rather exogenous.3
A detailed description of the variables and their expected signs are provided in Table 2. Table 3
presents the descriptive statistics. Over 24% of …rms introduced product innovations that were new
to their market by 2005, while 29% of …rms introduced products that were already known to their
market but new for the …rm. 47% of …rms abstained from innovation. The average …rm in the sample
has 244 employees, among which, on average 21% of employees have at least higher education. 35% of
…rms are group members, and 34% of the …rms are from Eastern Germany. The similar shares of …rms
have access markets of di¤erent geographical sizes: 26% to local or regional markets in Germany,
28% to German national market, 19% to European and 27% to the world market. 19% of …rms
reported that they have more than 15 competitors in their markets. A similar share of …rms reported
to have 6-15 competitors. More than half of the …rms in the sample (57%) have claimed to have 1-5
main competitors, while only 4% are monopolists in their markets. Only 9% of …rms produce unique
products that have no close substitutes, while the rest of …rms reported that the products in their
markets are substitutable to some extent. The average e¢ ciency of patent protection across industrial
sectors is higher than the e¢ ciency of protection by trademarks.
1.4
Empirical model
This section describes the empirical strategy. The statistical model that analyzes …rms’R&D strategy
choice as a function of …rm characteristics and external market parameters should take into account
that …rms’R&D strategy choices can be threefold: innovation, imitation and no innovation. Given a
set of regressorsxij, wherei= 1; :::; Iindexes …rms andj= 1; :::; J indexes regressors, the combination
of variables, PJj=0 xij j is used to distinguish between the K categories of the outcome variable.
Due to the nature of the dependent variable, a discrete choice model must be employed. The choice of
3
the model is determined by the relationship between the categories of the dependent variable. One of
potentially applicable models is a multinomial logit model. It relies on an assumption that the choices
between categories are independent. This assumption is known as IIA (Independence of Irrelevant
Alternatives) and it states that the relative probability of preferring one category to another does
not depend on the presence or absence of other "irrelevant" alternatives. For example, the relative
probability of engaging in imitation or innovation does not change in the absence of other "irrelevant"
alternatives. However, it is a very strong assumption for the dependent variable that indicates …rms’
R&D strategy choices. Actually, the choice of a …rm’s R&D strategy depends on the amount of
resources that it is willing to spend on R&D and on the expected pro…tability of each strategy. For
instance, the amount of resources that is needed to improve already existing products is smaller than
the amount of resources needed for the maintenance of an R&D laboratory and radical innovation.4
Therefore, the choice categories re‡ect the degree of …rms’involvement into innovation activity.
Following this approach, some studies suggest the existence of a natural ordering of categories
of the dependent variable according to the degree of …rms’ "innovativeness" (Link & Neufeld, 1986;
Vinding, 2006). Therefore, they propose to employ an ordered logit model. This model is based on
two important assumptions. First, it assumes that the same combination of independent variables can
be used to distinguish between all levels of the outcome variable. Second, the odds ratio for being in
category k or higher, relative to being in group k 1 or lower, is assumed to be the same for allk,
2 k K (the parallel regression assumption). In the context of our analysis this means that the
e¤ect of regressors on the decision to imitate instead of not to innovate is the same as on the decision
to innovate instead of to imitate. Since this assumption is not ful…lled, the ordered logit is not applied
for the present analysis5.
A compromise between the two former models is a stereotype logistic regression proposed by
Anderson (1984). This model imposes ordering constraints on a multinomial model. In the multinomial
logistic model K 1 parameters ek; k = 1; :::; K 1 are estimated. The stereotype logistic model
4Traditionally, application of the multinomial logit model is contrasted by Hausman and Small-Hsiao tests for the IIA
assumption. The results of the tests are often contradictory. Therefore, the general advice when using the multinomial logit model is to rely on underlying context of the dependent variable categories. Following this statement, although in the present econometric model tests show a weak evidence in favour if IIA, MNL is not applied in this study.
5The LR-test for the pallel regression assumption (Wolfe and Gould, 1998) and a Wald test are performed (Brant,
imposes restriction on the multinomial model by estimatingDparameter vectors, whereDis between
one andmin(K 1; j). The relationship between coe¢ cients of stereotype model d; d= 1; :::; Dand
the multinomial model’s coe¢ cients is ek=PDd=1 dk d. The parameters dk are estimated together
with parameters d. Denote k = k+ PdD=1 dkx d6, where x is a row vector of covariates and k
are unrestricted constant terms for each equation. The probability of observing outcome kis:
Pr(yi =k) =
8 > > < > > :
exp( k)
1+PKk=11exp( k)
k < K
1 1+PKk=11exp( k)
k=K
:
Using the data of German …rms from manufacturing and services sectors the one-dimensional
stereotype logistic model is speci…ed as:
k= k+ k
0 B
@ 1size02 + 2size02_2 + 3hc03 + 4capint+ 5expint+ 6group+
P3
i=0 7igeoi
+ 8ost+ 9pat+ 10tm+P3i=0( 11idifi+ 12icomi) +industry dummies
1 C A:
Due to the low number of categories of the dependent variable, the one-dimensional stereotype
logistic model and the two–dimensional stereotype logistic model (which is equivalent to the
repara-meterized multinomial logistic model) are appropriate choices (d= 1;2). The …rst category, a …rm’s
decision to abstain from innovation, is chosen as a reference category. When d = 1 the estimated
relationship between rescaling parameters k would indicate the appropriability of the categories
or-dering. If 1 2 ::: K holds, the nature of the dependent variable is indeed ordered. For model
identi…cation, we must impose the following restrictions on k and k: 0= 0 = 0 and 1 = 1.
For the ease of interpretation, regression coe¢ cients and their marginal e¤ects are reported. For
model evaluation a serie of tests is performed. First, because the model is estimated by
maximum-likelihood, likelihood ratio tests are performed. In addition, the -squared test is performed to compare
the model to the null model (intercept-only). This allows to test if an outcome is higher than what
would be expected by chance. Secondly, the validity of ordering in the dependent variable is tested via
the estimation of k. Third, the predictive ability of the model is compared to the full multinomial
model to see if the speci…cation of simplifying constraints of the stereotype model lead to a signi…cant
loss of predictive ability.
6
As mentioned above, the stereotype logistic model has a number of advantages. First, it relaxes
the proportional regression assumption of the ordered logistic model. Second, it does not impose an
ordering restriction on categories, but rather allows to test the appropriability of the ordering. Third,
it relies on maximum likelihood estimation of di¤erent coe¢ cients for each alternative (multinomial
logistic model) and, then, reparameterizes the coe¢ cients. Therefore, it highlights the ordering of
cat-egories and reduces the number of parameters for interpretation, without reducing the appropriability
of the …t.
1.5
Results
Table 4 provides the estimates (coe¢ cients and average marginal e¤ects) of the stereotype logistic
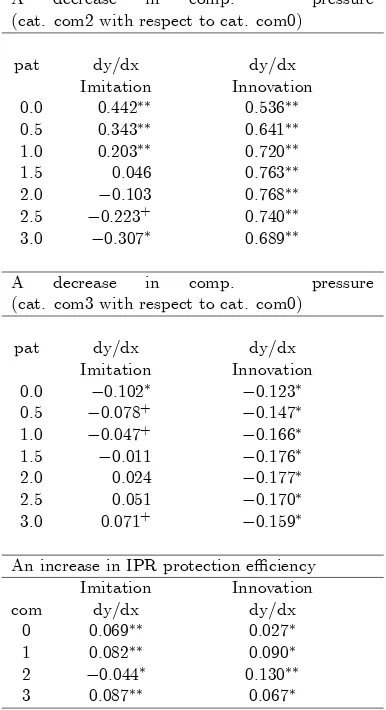
regression. Table 5 reports the marginal e¤ects at means of the number of competitors for a range of
patent protection e¢ ciency values and the marginal e¤ects at means of the patent protection e¢ ciency
for each category of the number of competitors.
Regarding internal …rms’ characteristics, the …rm size is found to have a positive but decreasing
e¤ect on the degree of …rms’ innovativeness. The quality of human capital, the intensity of capital
expenditures and the group membership also have a signi…cant positive impact. The geographical
market size has a strong positive e¤ect, which is increasing with market size available for the …rm.
The location of a …rm in former Eastern Germany is related to a lower propensity of the …rm to engage
in R&D, although, once controlling for other factors, the e¤ect turns to be insigni…cant.
Remarkably, the estimation results suggest crucial importance of external (market) factors for a
…rm’s R&D strategy choice. The success of legal IPR protection mechanisms, such as patents and
trademarks, a¤ects …rms’ choices to engage in imitative or innovative activity. This fact can have
several explanations. First, the reduction of uncertainty about R&D outcomes and future pro…ts due
to patent protection plays a very important role in the …rms’decision to engage in R&D. This result
provides support for the arguments of Arora and Gambardella (1994), Gans and Stern (2003), and
Gans et al. (2008). Second, better IPR protection might enhance open innovation. According to the
“open innovation paradigm”, …rms use patents as a channel of knowledge disclosure and dissemination.
This bene…ts other …rms in the industry and allows them to be more innovative (Chesbrough, 2003).
Competitive pressure is measured by the number of main competitors and the degree of product
substitutability. The results show that the oligopolistic market structure with 1-5 main competitors
is the one that favour most imitation and innovation. Having no competitors negatively a¤ects …rms’
innovativeness as compared to very competitive markets. The Wald test is applied for contrast of
pairwise equality of categories (com1, com2 and com3). The category with 1-5 main competitors is
signi…cantly di¤erent from the categories of having no competitors and having 6-15 competitors, while
the latter two categories are not signi…cantly di¤erent from each other.7 This suggests the evidence for
an "U-inverted" relationship between competitive pressure, as measured by the number of competitors,
and …rms’incentives to innovate and imitate. Another indicator of competitive pressure, the degree
of product substitutability, positively a¤ects …rms’innovation though it is not signi…cant.
The marginal e¤ects of the number of competitors are calculated for a range of values of patent
protection e¢ ciency. The results suggest that for low levels of patent protection e¢ ciency a small
number of competitors (from 1 to 5) positively a¤ects …rms’ incentives to imitate and to innovate.
However, for high levels of patent protection e¢ ciency a small number of competitors a¤ects positively
the incentives to innovate while negatively the incentives to imitate. This means that with a high
e¢ ciency of intellectual property protection (or high appropriability of knowledge) more …rms switch
from imitation to innovation. Put it di¤erently, when the number of competitors is small and
intel-lectual property is protected …rms are willing to create new products rather than to improve existing
ones. Finally, the absence of competitors negatively a¤ects the …rms’ incentives to innovate and to
imitate. However, when the level of patent protection is high, …rms are more propense to engage in
product improvement (imitation).
The appropriability of the econometric speci…cation is examined in the following ways. First,
the correlations in predicted probabilities using the multinomial and stereotype logit are calculated.
The probabilities are highly but not perfectly correlated across the two models, supporting that the
constraints imposed by stereotype logit hold. Second, the estimates of k, which indicate the distance
between categories of the dependent variable, are examined. We see that the parameters k are
monotonically increasing with respect toj, which means that the model is appropriate for the ordinal
7First, the comparison of com1 and com2 yields 2= 29:72andp value= 0:0000. Second, the comparison of com2
and com3 yields 2 = 19:84and p value= 0:0000. Finally, the comparison of com1 and com3 yields 2 = 0:16and
dependent variable and the categories of the dependent variable are ordered in accordance with the
impact of the independent variables on them. To see how the e¤ect of market characteristics on …rm’
R&D strategy choice varies among adjacent categories, we compare b3 b2 = 0:653
(innovation-imitation) and b2 b1= 1 (imitation-no innovation). This suggests that market characteristics have
a stronger impact on the odds of a …rm’s choice between imitation and no innovation than on the
odds of the choice between innovation and imitation. Furthermore, Wald and LR tests are performed
to check the distinguishability of dependent variable categories (the equality of k). Because the
hypothesis that all parameters k are equal can be rejected at 0.01 signi…cance level, we conclude
that the categories of the dependent variable are distinguishable. The overall predictive ability of the
model is similar to that of the full multinomial logit model and is over 57%.
1.6
Robustness check: an analysis of …rms’ R&D strategies at the
industry level
This section extends the analysis of …rms’R&D strategy choice at an industry level, investigating the
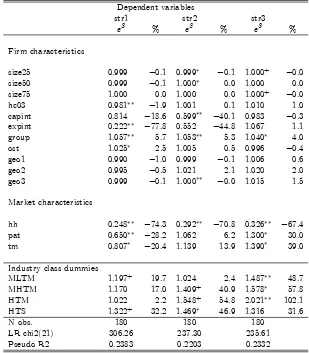
determinants of overall innovative performance of the industries. Dependent variables of the analysis
(str1, str2 and str3) represent the number of …rms in the industry that were, correspondingly,
no-innovators, imitators and innovators in 2005. Another interpretation of these variables is the degree
of "absence of innovation", "imitation" and "innovation" in the industry. Then, the count of …rms
in str1 refers to no-innovation, in str2 to imitation or incremental innovation (the improvement of
already existing products), and instr3to more radical innovation (introduction of products that did
not exist in the market before).
Similarly to the analysis at a …rm level, the two categories of independent variables are included
into our empirical model, the variables that measure internal …rm characteristics in the industry
and external market factors. Internal …rm characteristics are continuous and categorical variables
in the survey. Continuous variables are aggregated as median or mean values at the industry level.
Accordingly, continuous independent variables are the 25th, 50th and 75th percentiles of the …rm size
in the industry (size25,size50 andsize75), the mean values of human capital quality (hc03), capital
intensity (capint) and export intensity (expint). Categorical variables are aggregated at an industry
the German-wide (geo2), the European (geo3) and the world (geo4) market, and are located in the
territory of former Eastern Germany (ost).
The market characteristics employed are the average e¢ ciency of IPR protection by patents and
trademarks (patandtm) and the industry concentration measured by the Her…ndahl-Hirschman index
(hh). Following the …rm-level analysis, positive e¤ects of pat and tm are expected on the number of
…rms that engage in R&D (str3) and, accordingly, negative e¤ects are expected on the number of …rms
that abstain from innovation (str1). The concentration index hh is computed using total shares of
sales at the three-digit NACE level, although it is an imperfect measure of the degree of competition.
Regarding industry dummies, the model was estimated using industry classi…cation NACE Rev
1.1 (Eurocomission). Following it, industries are classi…ed into 5 industry classes (high-tech
manu-facturing, high-tech services, medium-high- and medium-low-tech manumanu-facturing, and low-tech
man-ufacturing and services) according to their R&D intensity in Europe. This allows to control for an
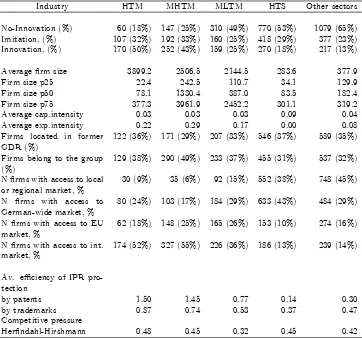
unobserved heterogeneity in the innovative performance across sectors. In Table 6 the summary of
…rm characteristics and market parameters in German manufacturing and services industries in the
year 2005 is displayed. Innovative performance of German industries is consistent with European
industry sectors classi…cation. Most innovative …rms belong to high-tech sectors while the number of
non-innovating …rms is the highest in low-tech sectors. By the number of employees …rms in high-tech
sectors are on average larger than in low-tech, and the smallest are …rms from high-tech services.
Higher shares of …rms from high-tech sectors are located in former Eastern Germany. High-tech
sec-tors are on average slightly more concentrated. Regarding the e¢ ciency of IPR protection, the …rms
from high- and medium-high-tech manufacturing attribute the highest e¢ ciency of IPR protection to
patents and trademarks, while the lowest scores come from high-tech services sectors.
Since the three dependent variables of the analysis are the counts of …rms that abstain from
innovation, imitate and innovate, in each industry the count data model is employed. Concretely,
for each of the dependent variables str1-str3 we estimate the negative binomial model.8 It assumes
that the observed count of observation i is drawn from a negative binomial distribution with mean
i =E(yi jxi) = exp (xi ). The negative binomial distribution of observations is assumed to be
Pr (yjx) = y+
1
y! ( 1)
1
1+
1
1+
y
;
where () is the gamma function and the parameter determines the degree of dispersion in the
predictions. The dispersion of observations is assumed to be NB2 (Cameron and Trivedi, 1986), which
is most often used in applied research:
V ar(yijx) = i+ 2i
The model is speci…ed as:
(strk) = exp
0 B
@ 1size25 + 2size50 + 3size75 + 4hc03 + 5capint+ 6expint+ 7group
+ 8ost+P3i=0 9igeoi+ 10hh+ 11pat+ 12tm+industry dummies
1 C A;
wherek= 1; :::;3.
However, in the set of equations with dependent variablesstr1-str3the error terms in the regression
equations are correlated. Therefore, the covariance matrix is estimated using the
Eicker-Huber-White-sandwich covariance estimator to a set of equations (Eicker 1963; Huber 1967; White 1980). This makes
standard errors valid in the presence of cross-equation correlations or heteroskedasticity.
For the ease of interpretation of regression coe¢ cients incidence-rate ratios are computed. If
E(yjx;xj) is de…ned as the expected count for a given x, where xj is explicitly observed, and
E(yjx;xj+ 1) as the expected count after increasingxj by 1, then
E(yjx;xj+ 1)
E(yjx;xj)
=e j
is an incidence-rate ratio. It can be interpreted as given the increase of xj by 1 the expected count
increases by a factor of e j, holding all other variables constant. In addition, the percentage changes
in the dependent variable given a unit change of the regressors are reported (Table 7).
The results show that the …rm distribution by size is not related to the …rms’R&D strategy choices.
Only the 25th percentile of …rm size in the industry is weakly negatively related to the number of
imitating and innovating …rms in the industry. The mean quality of human capital in the industry
positively a¤ects the number of innovators, while having a negative impact on the number of
innovation) in industries. Low export intensity leads to less innovation in industries. The number of
…rms located in former Eastern Germany is negatively related to the count of innovating and imitating
…rms.
The industry level analysis stresses a positive e¤ect of an IPR protection e¢ ciency (by means
of patents and trademarks) on the number of innovators and, correspondingly, a negative e¤ect on
the number of …rms that abstain from innovation. It supports the results of the …rm level analysis.
However, no signi…cant e¤ect on the number of imitators is found. The concentration index negatively
a¤ects the number of innovating, imitating and non-innovating …rms in industries. However, its e¤ect
is lower with respect to the number of innovative …rms, indicating that more concentration can lead
to more innovation.
Finally, regarding industry technological classes, …rms’innovative performance in German
manu-facturing industries is close to the European classi…cation. Noteworthy, the dummy for sectors that
belong to high-tech services is positive and signi…cant for non-innovating and imitating …rms. This
indicates that services …rms are oriented on rather incremental improvements in their products than
on radical change.
1.7
Discussion
The results of this paper extend previous …ndings on the …rms’ choice between innovation and
imi-tation. First, this study uses a larger sample of …rms from manufacturing and services sectors than
the predecessors (Link and Neufeld, 1986; Vinding, 2006). Second, the results of previous studies
are contradictory. Speci…cally, the former …nds that market power is crucial for …rms to engage into
innovation and imitation. Conversely, the latter …nds that an increase in competitive pressure
en-hances innovation. However, both studies use competition measures that can be endogenous to the
dependent variables. The present study controls for potential endogeneity when using the measures of
competitive pressure and suggests a non-monotonic e¤ect of competitive pressure on …rms’incentives
to imitate and innovate. A small number of competitors is found to be optimal for innovative
perfor-mance of an industry in terms of new product introduction. In addition, this e¤ect varies depending
on the IPR protection e¢ ciency.
who argue that IPR protection is a good mechanism for enhancing innovation. The present paper
goes further analyzing how this e¤ect depends on the level of competition a …rm faces. Opposite
to Vives (2008), empirical evidence on German …rms suggests that an increase in market size has a
non-ambiguous positive e¤ect on the introduction of new products. Finally, our results contradict
theoretical …ndings by Zhou (2009). Using a standard oligopoly framework he shows that intensi…ed
competition measured by an increase in the number of competitors always dampens innovation. Under
a moderate level of competition, weak IPR protection (or a high exogenously given level of spillovers)
increases …rms’incentives to innovate. This might result from the fact that in Zhou (2009) the model
does not account for possible changes in R&D strategies chosen by …rms (innovation and imitation)
when it becomes more pro…table to switch from the current strategy. When the level of spillovers
is high (or the level of IPR protection is weak), former innovators might …nd it more pro…table to
switch to imitation, increasing competition among imitators. Contrary to Zhou (2009), this paper
…nds that a small number of competitors can stimulate both product innovators and imitators. IPR
protection to a large extent a¤ects a …rms’ choice to innovate and, indirectly, has a small positive
e¤ect on product improvement by imitators through an increased activity of innovators. Therefore,
when looking at the e¤ect of competitive pressure and intellectual property protection, it is essential
to model a …rms’R&D strategy choice as endogenous.
1.8
Concluding remarks
This paper analyzes how …rms choose their R&D strategies as a function of external factors such
as spillovers and competitive pressure. To the best of my knowledge, despite a few empirical studies
focusing on the choice between innovation and imitation (Link and Neufeld, 1989; Vinding, 2006), until
now, external and internal parameters that are both important for such a …rm decision have not been
analyzed jointly. I explicitly consider that …rms may have di¤erent innovation strategies (innovate,
imitate or not innovate) and analyze how IPR protection, product di¤erentiation and competitive
pressure jointly a¤ect …rms’R&D strategy choice.
The results show that the patent protection e¢ ciency positively a¤ects the propensity of …rms to
imitate or to innovate. A decrease in competitive pressure from many to few competitors positively