Technology use by public service interpreters and translators: the link between frequency of use and forms of prior training
16
0
0
Texto completo
(2) formación que los traductores e intérpretes han recibido sobre el uso de herramientas tecnológicas, como traducción asistida por ordenador, traducción automática, mensajería instantánea, videoconferencia y programas de gestión terminológica. Palabras clave: Interpretación; TISP; Encuesta; Traducción; Tecnología.. 1. Introduction Migration increases linguistic and cultural diversity worldwide. This growing trend towards superdiverse societies is accompanied by many important challenges. One of these challenges is to continue to ensure a high-quality public service as service providers are increasingly confronted with situations in which they need to communicate with end-users having different linguistic and cultural backgrounds. In this context of increasing multilingual service needs, specific communication strategies, external services or tools can be used to help overcome language barriers (Rillof, Van Praet and De Wilde, 2015; Rillof and Buysse, 2015; Kerremans, De Ryck et al., 2018). Examples of specific communication strategies are different forms of language use, such as the use of simple language, a lingua franca or the language of the person in need of help. External services include the use of public service interpreters and translators (PSITs). Tools used in multilingual service provision can range from the use of simple pictograms to the use of all kinds of communication-supporting technologies such as a wide range of mobile apps or multilingual (digital) resources (e.g. multilingual websites, glossaries, pre-translated documents, etc.). The focus in this article will be on technological solutions that function as so-called 'bridging instruments' to facilitate communication in different settings of multilingual service provision (e.g. asylum, educational, health, legal or social settings). Today, in the middle of the technological era, an ever-increasing set of technological tools are available at workplaces, including public service provision settings (Cronin, 2013). However, based on findings from an earlier small-scale study into language and communication practices in the context of multilingual service provision in Brussels (Kerremans, De Ryck, et al. 2018) we hypothesise that the extent to which these tools are effectively used on a wider scale by public service providers and PSITs varies greatly and depends on each individual situation. Research is therefore needed to understand how technological tools can be effectively deployed in different (sometimes very particular) situations in support of multilingual service provision. This article is part of a research project in which a survey was conducted about technology use by public service providers and by PSITs worldwide. The focus in this study is on different types of technologies, such as computer-assisted translation (CAT) technology, Instant Messaging (IM) technology, machine translation (MT) systems, termbase management systems (TB) and video conferencing technology (VC). In this list, CAT technology is only developed for the specific target group of translators. CAT tools are systems that aid translators to edit and manage translations. These systems allow translated segments to be stored in a database – also known as a translation memory – so that these segments can be re-used whenever a translator needs to translate a similar segment or the same segment in a new text or in the same text. All other aforementioned technologies can be used for professional purposes by both translators and interpreters. Instant Messaging (IM) tools allow users to send real-time messages to one person or a group of persons. MT systems are systems that automatically translate written and/or spoken utterances from one language into the other. Termbase management systems (TB) are tools allowing users to create, update and store terminology in one or several languages, together with additional (optional) information, such as definitions, 108.
(3) grammatical information, example sentences, etc. Finally, video conferencing systems (VC) are systems allowing users to organise virtual meetings between persons in separate places. It should be noted that the category 'Computer Assisted Interpreting' (CAI) technology was not included in this survey. The term refers to the collection of tools that support interpreters, both in the preparatory phase and during interpretation (Fantinuoli 2017). These can be systems that support separate tasks in the interpreter’s workflow – such as systems for terminology management (Costa et al., 2014), for taking notes (Goldsmith, 2018) or for facilitating remote interpreting (Braun, 2015) – or integrated solutions (i.e. supporting different tasks). Some of these CAI tools – more specifically TB and VC – are covered in the survey. In addition to the tools already mentioned, respondents were also asked whether they were using any other tools for professional translation and/or interpreting purposes. Preliminary results collected from March until May 2018 were already reported in a first study by Kerremans, Cox et al. (2018). In the scope of this article we will base ourselves on data collected over a slightly longer period (i.e. from March to September 2018). For reasons of space, we will not be covering all the results of the study but limit ourselves to a discussion of results obtained from a group of 188 PSITs from different countries: Australia (102), Belgium (42), Canada (1), Denmark (1), France (2), Germany (1), Mexico (1), Myanmar (1), New Zealand (1), Paraguay (1), Spain (19), Sudan (2), Sweden (4), Thailand (1), The Netherlands (1), the UK (3) and finally the USA (5). Our focus will be on the relation between prior training of this group of respondents and the frequency of use of the aforementioned technologies (CAT, IM, MT, TB and VC) in their professional practice. The research is guided by the following research questions: . To what extent do PSITs make use of different technologies? How did they learn to use these technologies? Does the form of training have an impact on the frequency of use of the technologies? Does formal training in translation or interpreting lead to a higher frequency of use of the technologies? Does specific training in PSIT lead to a higher frequency of use of the technologies? Are there geographical variations in the extent to which the different technologies are used? This article will be structured as follows. In Section 2, we will present the research background in which this study is to be situated. In Section 3, we will summarise the methodology of the research. Results of the study are presented in Section 4 and are followed by a discussion in Section 5. Finally, a conclusion is formulated in Section 6 together with a reflection on possible new research pathways.. 2. Research background All kinds of digital innovations have brought about a major shift in the translation industry and technologies have become essential rather than optional in every step of a translator’s workflow (Biau Gil and Pym, 2006; Cronin, 2013; Bowker and Corpas, 2015). Technological developments in the interpreting industry are also becoming increasingly prominent. This can be inferred from a growing number of studies on computer-assisted, or technology-assisted interpreting in recent years (Costa, Corpas Pastor and Durán Muñoz, 2014; Fantinuoli, 2017; Fantinuoli, 2018). Research in this domain is concerned with topics such as Remote Interpreting Technologies (RITs) which enable professional interpreters to provide 109.
(4) their services 'from a distance' or remote site (Ziegler and Gigliobianco, 2018). Such technology is for instance used by service providers and interpreters in legal and healthcare settings (Chan et al., 2010; D’Hayer, 2012; Braun, 2015; Balogh and Salaets, 2018). Other examples of technology-based topics in the interpreting domain are the application of terminology management systems for interpreters (Fantinuoli, 2016; Costa, Pastor and DuránMuñoz, 2017), the deployment of corpus-based tools (Lázaro Gutiérrez and Sánchez Ramos, 2015), or the use of specific devices in the interpreting practice, such as tablets (Goldsmith, 2018). As technology plays an increasingly important role in translation and interpreting, it is crucial for translators and interpreters not only to keep up with technological developments and trends but also to acquire the skills to incorporate technology into their professional practice. It goes without saying that first and foremost higher education plays an important role in this. The ever-growing importance of technology in many professional translation and interpreting settings is reflected in translation and interpreting curricula at universities and colleges. In addition to the traditional focus on linguistic and intercultural skills, other key competences are also gaining ground in translator and interpreter training programmes, partly under the impetus of proposals for competency profiles developed in wider international networks by academic partners in cooperation with organisations in the language industry. For example, in the 'Wheel of Competence' introduced by the EMT Expert Group in 2009 and of which a new version was recently launched, 'technology' is considered one of the five main competence areas within the translator's competency profile (EMT Board, 2017). Another example is the public service interpreter’s competency profile proposed by the Accreditation Committee of the European Network for Public Service Interpreting and Translation (ENPSIT). In the ENPSIT competency profile, technological competencies pertain to having “very good working knowledge of interpreting equipment (such as microphone, audio and videoconferencing technology) that may be required for interpreting in a given setting” and also to having “excellent knowledge of the existence and availability of research and terminology management tools” (ENPSIT Training and Accreditation Committee s.d.: 2). In addition to the courses that translators and interpreters may have taken at universities or colleges, technological competencies can also be acquired in other ways (e.g. through selfstudy, attending professional workshops, informal training by a colleague, etc.). As was mentioned in the previous section, our aim in this article is now to gain a broader understanding of the relationship between the frequency of technology use by PSITs in their professional practice and their prior training. To this end, we draw our data from a broader study on technology use by both public service providers and PSITs that was distributed in several countries by partners in the European Network for Public Service Interpreting and Translation and of which preliminary results were presented in Kerremans et al. (2018). In the next section, we will elaborate in more detail on how this large-scale survey was set out.. 3. Research methodology In 2018 the worldwide distribution of an online survey amongst public service providers (PSP) and public service interpreters and translators (PSIT) started with the main aim of obtaining information about their use of technology as a possible bridging instrument for communication in public services. Since the data for the present study were drawn from parts of this survey, we will briefly describe how the survey was compiled and distributed. In the pre-pilot phase, the survey was designed in English to be later validated by a reduced and controlled group of eight experts chosen following convenience and proximity 110.
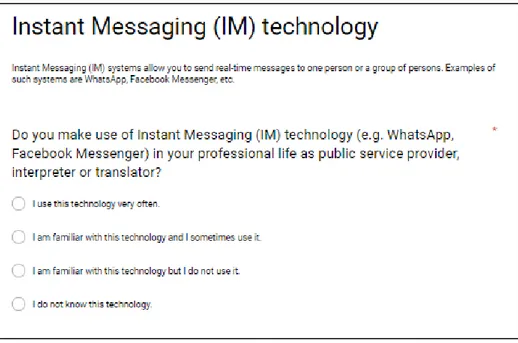
(5) criteria. In order to cater for the different profiles of target respondents (namely public service providers and public service interpreters and translators), four participants were recruited in Belgium and the remaining four in Spain. Two participants in each group belonged to the legal sector and two others were working in healthcare, the main domains within public service interpreting and translation. It was also determined that, within each of these two groups (legal and healthcare), it was necessary that one of the respondents was a PSP and the other one was a PSIT. The modifications suggested by the experts were applied to the English survey and it was later translated into Dutch, French and Spanish and implemented in Google Forms to allow for massive online distribution. The survey is divided into different sections. Some sections show questions that are asked to both PSITs and PSPs. Other sections are only intended for one of these two profiles and can therefore only be viewed by the participants after selecting the corresponding profile in an earlier step in the survey. Since this article looks at the answers of PSIT respondents to questions about technology use and technology training, we will only discuss the data obtained for this specific target group and leave out the questions that were asked to PSPs only. A first general profile of the PSIT respondents is drawn up based on questions referring to age, nationality (or nationalities) and obtained degrees. In addition, questions are asked concerning their interest in technology in general, how they use technology and perceive its functionality, both in their daily and professional lives. To obtain more information about the respondents’ professional situation, PSITs are asked on what basis they provide interpreting/translation services (e.g. freelance or voluntary), how often they do this for public organisations (expressed in number of hours per month) and in which domains (e.g. asylum/migration, legal settings, healthcare, etc.). Next, the survey further elaborates on the use of technological bridging instruments, starting with questions related to the tools mentioned earlier in this article (see Section 1): CAT, IM, MT, TB and VC. To ensure that respondents understand exactly what is meant by these technologies, a short description is added to each technology in the survey, along with a list of some examples. This is illustrated by means of Figure 1 showing a question in the online survey, which is related to the use of IM technology.. Figure 1. Question about IM technology in the online survey. 111.
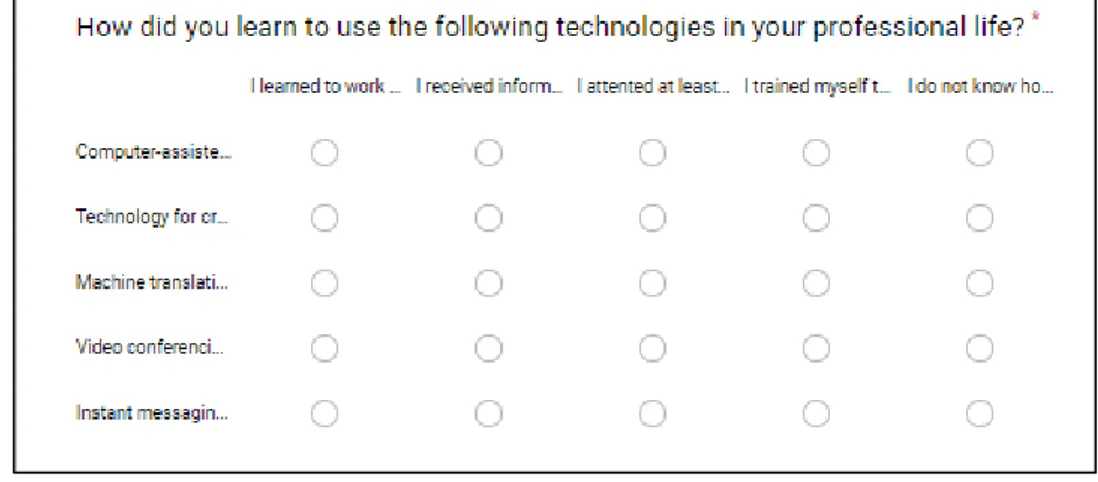
(6) If respondents choose any of the first two answers, they are directed to a further question formulated as: “Could you please explain what IM system(s) you use and how the technology supports you in your professional life?” In the case of IM, they are also asked whether they use text messages, voice messages (“How do you send your messages to other persons: by typing your messages (text messaging) or by uttering messages (voice messaging)”?). In case they choose the third answer, they are directed to a different open question, formulated as follows: “Could you please explain why you are not using IM technology in your professional life?”. As was mentioned earlier, the survey is not limited to the five aforementioned tools only (i.e. CAT, IM, MT, TB and VC), but also asks the respondents whether there are any additional technologies that they use as PSIT professionals. The last part of the survey presents the respondents with several statements to gauge whether they deem it relevant to receive training on how to deploy these technologies in professional contexts, or the need to share knowledge and best practices on the use of these technologies. The frequency of use of tools was compared with the kind of training the respondents had received, both about the tools and about translation and interpreting in general and public service interpreting and translation. Thus, the survey included a question about how respondents learnt to use the different technologies in their professional life (see Figure 2). For each of the technologies, participants had to mark whether they had learnt to work with those technologies during their studies, whether they had received informal training (for instance, training by a colleague), whether they had attended workshops, or trained themselves by means of tutorials or other kinds of internet materials.. Figure 2. Question about the use of different types of technologies. These data were correlated with questions about their training in translation and interpreting or in PSIT studies, which were formulated as follows: “Did you receive any formal training in translation and/or interpreting?”, and “Did you receive any formal training, specifically covering aspects of public service interpreting and/or translation (PSIT)?” Results are presented in the following section.. 4. Results In this section we present the results obtained from 188 PSITs. Most of the answers were obtained from respondents in Australia (54.26%), Belgium (22.34%) and Spain (10.10%). Table 1 provides an overview of the specific profile characteristics of the respondents. 112.
(7) Category (total number) Country in which PSIT activities are performed. Subcategory. Number. %. 102 42 1 1 1 1 1 1 1 4 2 1 19 2 5 1 3. 54.26 22.34. Employee Freelancer Trainee Volunteer. 48 130 5 5. 25.53 69.15. Formal interpreting/translation training in higher education received. Yes No. 159 29. 84.57 15.43. PSIT training received. Yes No. 119 69. 63.30 36.70. Time spent on PSIT. < 10% < 30% < 50% > 50% > 70% Full time. 27 33 25 16 49 38. 14.36 17.55 13.30 8.52 26.06 20.21. 18-25 26-35 36-45 46-55 56+. 10 34 37 48 59. 5.31 18.08 19.68 25.53 31.38. Australia Belgium Canada Netherlands Denmark Paraguay Myanmar New Zealand Mexico Sweden Sudan Germany Spain France US Thailand UK. 10.10. Type of employment. Age. Table 1. Overview of the respondents’ characteristics. Many respondents in this subgroup provide translation/interpreting services in the public sector on a freelance basis (69.15%). Most of the participants also received formal translator/interpreter training (84.57%). The proportion of respondents who have followed a specific PSIT training is slightly lower but still quite high compared to the group who did not follow such training (63.30%). The estimated time spent on providing translation/interpreting services in the public sector ranges from less than 10% of the time to a full-time occupation, with more than half of all respondents (54.79%) spending more than 50% of their working hours performing PSIT activities. The majority of respondents is older than 45 (56.91%). In the following subsections, we will present our results for the research questions that were addressed in the beginning of this article (see Section 1). 113.
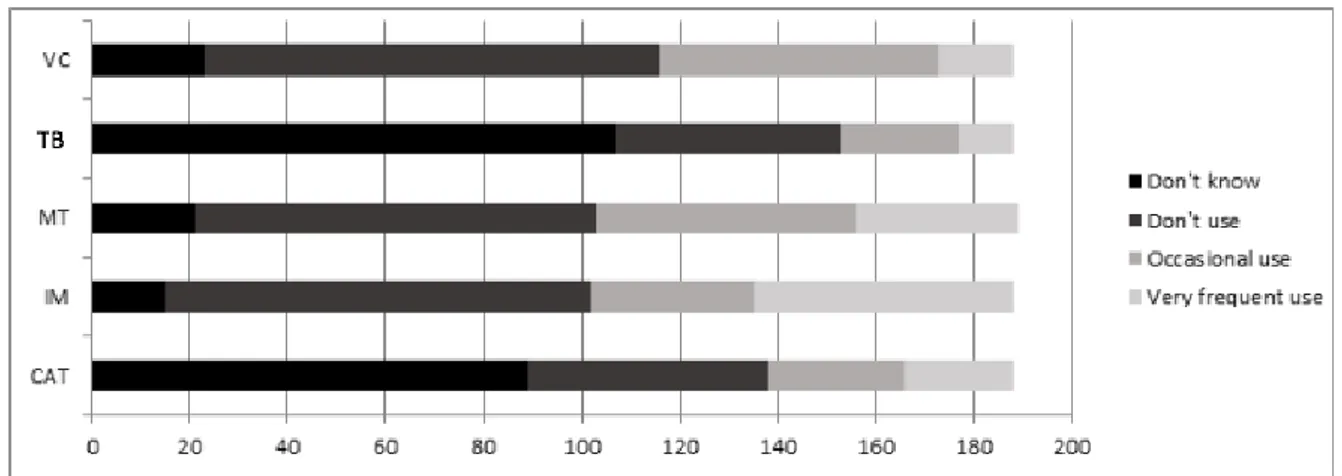
(8) 4.1 To what extent do PSITs make use of different technologies? For each technology, respondents were requested to indicate whether they (a) use it very often (very frequent use), (b) are familiar with the technology and sometimes use it (occasional use), (c) are familiar with the technology but do not use it or (d) do not know the technology at all. The respondents’ answers are summarised in Figure 3.. Figure 3. Respondents’ answers as to their use of the different technologies (N=188). A first glance on Chart 1 reveals that the degree to which the technologies are used varies widely. The vast majority of respondents are unfamiliar with Computer-Assisted Translation (CAT) and Termbase Management (TB) technology: 73.4% do not use CAT tools, 47.3% of which does not even know the technology; 81.4% do not use TB tools, 56.9% of which does not even know the technology. Instant Messaging (IM), Machine translation (MT) and Video Conferencing (VC) services are used more extensively by respondents in their professional contexts, although even in these cases fewer than half of the respondents make (occasional or very frequent) use of the tools. 54.3% does not use IM technology, although in this case only 8% does not know the technology. On the other hand, more than one quarter of the respondents indicated they use the technology on a very frequent basis (28.2%). An identical percentage of 54.3% of the respondents does not use MT technology, although only 10.6% is not familiar with the technology. Conversely, 17.6% of the respondents stated they use the technology “very often”. 61% does not use VC technology, while 12.2% does not even know the technology. Only 8% states using this technology “very often”. To be able to ascertain possible differences in terms of frequency of use across different groups of respondents, we first calculated the means of the frequency of use (FoU) scores given by all respondents. The FoU scores were attributed as follows: the answers to which respondents had answered “I do not know this technology” or “I am familiar with this technology but I do not use it” were coded as “1” (no use), the answers relating to an occasional use were coded as “2”, and finally the instances in which participants had indicated they “very often” use tools were changed into “3”. The means of the FoU scores are shown in Table 2.. N=188. CAT. IM. MT. TB. VC. 1.38 (0.69). 1.74 (0.87). 1.63 (0.77). 1.24 (0.55). 1.46 (0.64). Table 2. Means and standard deviations of all respondents’ FoU scores per technology. The highest means for the IM and MT technologies are in accordance with the results discussed above, as they are the technologies which respondents tend to use more. 114.
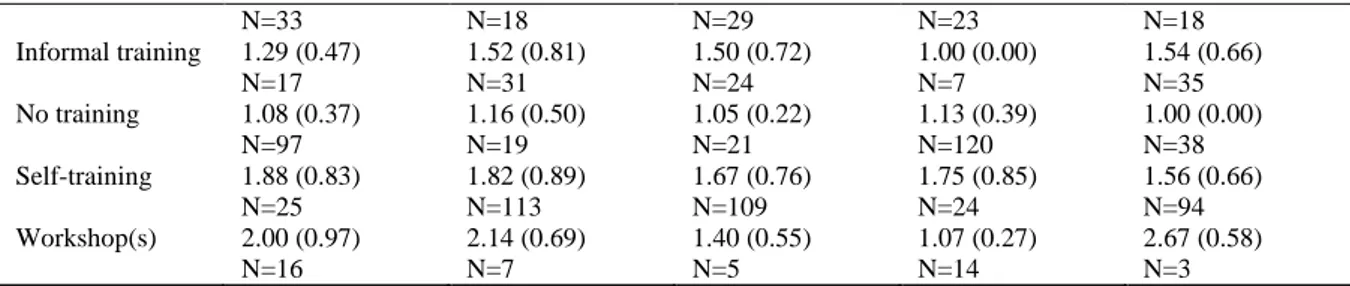
(9) Application of a Spearman correlation test between the respondents’ age range (see Table 1) and their FoU scores revealed no significant correlations, except for a weak negative correlation between age and frequency of use of MT (r= -.210, p=.002), suggesting that younger PSITs tend to use MT to a higher extent than their older colleagues. We also found weak positive correlations between the FoU scores of the different tools, suggesting that there is a (weak) relationship between the frequency of use of one tool and another: between the FoU scores of CAT tools and those of IM (r=.298, p=.000), MT (r=.136, p=.032), TB (r=.176, p=.008) and VC (r=.218, p=.002); between the FoU scores of TB and VC (r=.158, p=.015), TB and IM (r=.184, p=.006) and VC and IM (r=.319, p=.000). The FoU scores of MT show the lowest degree of correlation with the use of the other tools, as it only shows a weak positive correlation with the frequency of use of CAT. To find out whether respondents spending a higher number of working hours on PSIT activities perhaps make more use of the technologies than those dedicating a smaller proportion of their time to PSIT, we performed a Spearman correlation test between time spent on PSIT (according to the categories in Table 1) and the FoU scores of the different tools. This test yielded no significant correlations, except for a weak negative correlation between time spent on PSIT and use of CAT tools (r= -.159, p=.015). We also calculated the mean FoU scores for the PSIT>50% group (which was defined as a group comprising all PSIT>50% groups), and another group including all PSIT<50% groups. The mean scores per group are shown in Table 3.. PSIT >50% N=103 PSIT<50% N=85. CAT 1.28 (0.63). IM 1.72 (0.89). MT 1.66 (0.76). TB 1.16 (0.49). VC 1.43 (0.62). 1.56 (0.73). 1.75 (0.86). 1.60 (0.77). 1.34 (0.61). 1.50 (0.66). Table 3. Means and standard deviations of PSIT >50% and PSIT<50% respondents’ FoU scores per technology. This comparison reveals that the mean FoU scores are not higher in the PSIT>50% group. The mean FoU scores of this group are even slightly lower than those of the respondents spending less than 50% of their time on PSIT, except for MT FoU scores, which are virtually on a par. Moreover, the standard deviations show a similar tendency across the groups. In other words, respondents who spend most of their time engaging in PSIT activities do not seem to generally resort more to technology than respondents who spend less time on PSIT. A reason for this finding might lie in the possibility that respondents engaging in a lower percentage of PSIT activities may also be active as translators or interpreters in other fields than PSIT, fields in which they might also resort to technological tools. 4.2 How did they learn to use these technologies? In this section, we focus on the way the respondents learnt to use the different tools. In the survey, all participants were asked to choose between one of the following forms of training: formal training (i.e. translation and/or interpreting studies in higher education), informal training (e.g. via a colleague), self-training (through tutorials and other online information), workshop training or no training. Table 4 gives an overview of the distribution of the training methods across participants as well as the FoU scores associated with the different forms of training. N=188 Formal training. CAT 1.63 (0.74). IM 2.06 (0.94). MT 2.07 (0.84). TB 1.48 (0.73). VC 1.55 (0.62). 115.
(10) Informal training No training Self-training Workshop(s). N=33 1.29 (0.47) N=17 1.08 (0.37) N=97 1.88 (0.83) N=25 2.00 (0.97) N=16. N=18 1.52 (0.81) N=31 1.16 (0.50) N=19 1.82 (0.89) N=113 2.14 (0.69) N=7. N=29 1.50 (0.72) N=24 1.05 (0.22) N=21 1.67 (0.76) N=109 1.40 (0.55) N=5. N=23 1.00 (0.00) N=7 1.13 (0.39) N=120 1.75 (0.85) N=24 1.07 (0.27) N=14. N=18 1.54 (0.66) N=35 1.00 (0.00) N=38 1.56 (0.66) N=94 2.67 (0.58) N=3. Table 4. Means and standard deviations of FoU scores per form of training and technology. Table 4 reveals that most respondents indicated no training when it comes to CAT and TB, which is in line with the results presented in Section 4.1. Self-training is the most frequent form of training for IM, MT and VC, with percentages of 60.11%, 57.98%, and 50%, respectively. A limited proportion of 10% to 18% of the respondents has learnt to use one or more of the technologies during their formal training. Workshop training yields the highest FoU scores for CAT, IM and VC, although the reliability of the mean FoU scores is unreliable in the light of the low number of respondents. In the next section, we gauge the effect of the training method on the frequency of use per technology by performing Kruskal-Wallis tests and post-hoc pairwise comparisons. 4.3 Does the form of training have an impact on the frequency of use of the technologies? A first scrutiny of Table 4 reveals that respondents without any knowledge unsurprisingly tend to display the lowest frequency of use for all technologies, except for TB. In general, informal training also seems to be associated with slightly lower FoU scores. In the case of CAT, the highest mean FoU scores correspond to workshop(s), self-training and studies. Application of a Kruskal-Wallis test shows a significant difference between groups (p=.000). Pairwise comparisons indicate that the frequency of use associated with no training is significantly lower than the frequency of use associated with the other training methods (p=.000), except for informal training (p=1.000). We also find a significant difference between informal training and self-training (p=.048). In the case of IM, the highest mean FoU scores also correspond to workshop(s), studies and self-training. The Kruskal-Wallis test reveals a significant difference between groups (p=.002). According to the pairwise comparisons, the frequency of use associated with no training is significantly lower than the frequency of use associated with studies (p = .016) and self-training (p=.016). In the case of MT, it seems that respondents who have learnt to use the tool during their studies also tend to make a use of these tools more frequently. Performance of a Kruskal-Wallis Test reveals a significant difference between groups (p=.000). The pairwise comparisons show that the difference between the frequency of use associated with no training is significantly lower than the frequency of use associated with the self-training (p=.003) and studies (p=.000). The highest mean FoU scores for TB also correspond to self-training and studies. The Kruskal-Wallis test shows a significant difference between groups (p=.000). The pairwise comparisons show that the frequency of use associated with self-training is significantly higher than the frequency associated with no training (p=.000), informal training (p=.021) and workshop(s) (p=.006). With respect to VC, the highest mean FoU score also corresponds to workshop(s), although this means is not reliable as it was only indicated 3 times. The Kruskal-Wallis test shows a significant difference between groups (p=.000). According to the pairwise comparisons, the frequency of use associated to no training is significantly lower than the FoU 116.
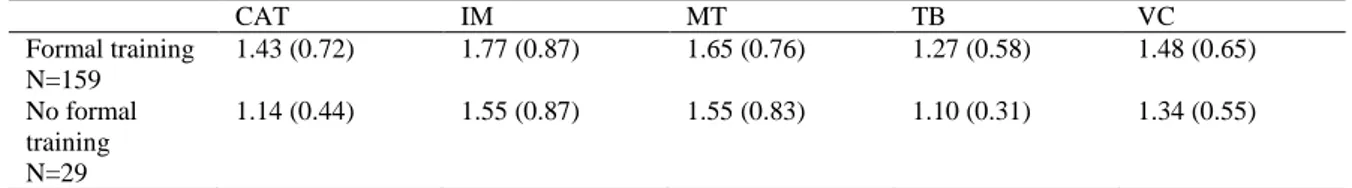
(11) scores associated with informal training (p=.001), self-training (p=.000), studies (p=.007) and workshop(s) (p=.001). 4.4 Does formal training in translation or interpreting lead to a higher frequency of use of the technologies? In this section, we compare the mean FoU scores of the respondents who had a formal interpreter or translator training with the scores of the respondents who were not formally trained.. Formal training N=159 No formal training N=29. CAT 1.43 (0.72). IM 1.77 (0.87). MT 1.65 (0.76). TB 1.27 (0.58). VC 1.48 (0.65). 1.14 (0.44). 1.55 (0.87). 1.55 (0.83). 1.10 (0.31). 1.34 (0.55). Table 5. Mean FoU scores of formal training and no formal training groups. Table 5 reveals slightly higher means for all tools in the formal training group. Application of a Mann-Whitney U test only shows a significant effect of formal training on the frequency of use of CAT tools (U=1854.50 and p=.031), suggesting that a formal training can lead to a higher frequency of use of CAT tools. 4.5 Does specific training in PSIT lead to a higher frequency of use of the technologies? In this section, we compare the mean FoU scores of the respondents who have had a specific PSIT training with the scores of the respondents who were not previously trained in PSIT. PSIT training N=119 No PSIT training N=69. CAT 1.41 (0.68). IM 1.78 (0.87). MT 1.72 (0.80). TB 1.29 (0.58). VC 1.50 (0.67). 1.33 (0.70). 1.67 (0.87). 1.48 (0.68). 1.17 (0.48). 1.39 (0.57). Table 6. Mean FoU scores of PSIT training and no PSIT training groups. Table 6 reveals slightly higher means for all tools in the PSIT training group. Application of a Mann-Whitney U test only shows a significant effect of PSIT training on the frequency of use of MT tools (U=3767.50 p=.045). This finding suggests that a specific PSIT training can lead to a higher use of MT technology. 4.6 Are there geographical variations in the extent to which the different technologies are used? To ascertain possible geographical variations as to the frequency of use of the different technologies, we compare the mean FoU scores of respondents’ two main origin groups, i.e. Australian (N=102) and European (N=73) PSITs. The mean Australian and European FoU scores per technology are shown in Table 7. Australian N=102 European N=73. CAT 1.28 (0.60). IM 1.72 (0.87). MT 1.68 (0.77). TB 1.15 (0.41). VC 1.43 (0.59). 1.53 (0.78). 1.70 (0.88). 1.60 (0.78). 1.36 (0.65). 1.41 (0.62). 117.
(12) Table 7. Means and standard deviations of Australian and European FoU scores per technology. Application of a Mann-Whitney U test shows a significant difference between the FoU scores for CAT (U=4.315, p=.021) and TB (U=4.244, p=.019), suggesting that European PSITs use these technologies more readily than their Australian peers. As we have seen in Section 4.1, CAT and TB technologies are not known or not used by a vast majority of the respondents. Whereas 79.4% of the Australian respondents do not know or use CAT tools, this is the case for 54.9% of their European peers. Similarly, 87.3% of the Australian respondents do not know or use TB tools, in comparison with 74% of the European respondents. Training in these technologies seems to be offered slightly more often during formal translator or interpreter training in Europe than in Australia, with percentages of 24.66% and 14.70% respectively.. 5. Discussion Our first research question probes into the extent to which PSITs make use of the different technologies. Our findings suggest that, in general, there is a low frequency of use of the different technologies. The frequency of use of the five different technologies does not seem to be related to age (apart from a weak relationship in the case of MT) or to work time spent on PSIT activities. Only around a quarter of respondents make (occasional or frequent) use of CAT or TB technology and approximately half of them do not even know these tools. The fact that, within the group of respondents who do not use CAT technology, almost half (47.3%) of the respondents state that they do not know this technology is somewhat striking, as it concerns technology that has become established in the translation industry and curricula, at least translation curricula in Europe. A possible reason could be the nature of the formal training that the respondents had followed prior to their career as PSIT and in which the technology was simply not offered. The fact that most of the respondents did follow a translation and/or interpreter-specific training suggests that in many cases no attention was paid to this technology during their training. In the survey, participants were invited to explain why they (do not) use each technology by means of an open question. From their answers, we know that many respondents only work as interpreters or only do sporadic translation work, which is why they do not need CAT technology. Some respondents stated that they did not need the technology because they did not work on long projects with repetition. Others do not use it because they have no experience or feel CAT technology unwieldy or uncomfortable to work with. Respondents who do work with the technology do this to save time and improve the quality of their work, or in case the use of a specific CAT tool is requested by a client or agency. As for TB tools, some respondents stated they had no need for such tools for their work, for example in the case of interpreters. Several respondents also preferred to manage their own glossaries using a spreadsheet program. Others indicated they or their service have no budget for such tools. Those who use a TB tool do so to save time and enhance consistency in their translations. Instant Messaging (IM), Machine Translation (MT) and Video Conferencing (VC) services seem to be used more extensively by respondents in professional contexts, although even in these cases little less than half of the respondents make (occasional or frequent) use of the tools. IM services are used by respondents in professional contexts, both in communication with colleagues and agencies, although in most cases IM is not used for the actual translation of interpreting assignments. Some respondents pointed out the advantages of 118.
(13) this medium for sending fast, short messages. Respondents use the tool to send written, voice or video messages. Reasons for not using IM services include confidentiality and security issues as well as the perception that the use of such tools with customers is unprofessional. MT systems tend to be used to get a general idea of the content of a text, for supporting and speeding up translation projects or sometimes even for checking possible equivalents for a given term in the source language. Reasons for not using the technology are reliability issues, poor quality for certain language combinations or the difficulty to use it in situations of oral communication. The reason for limited use of VC might lie in the fact that some respondents are only performing translation work or only doing on-site or face-to-face interpretation. Some respondents indicated that they do not know how to work with the technology and therefore do not use it. Some respondents embrace the idea of using this technology but point to practical problems which make it difficult to use in their professional contexts (e.g. customers do not have the technology or the organisation does not have the technical facilities). Others believe that this type of technology does not add anything in comparison to phone interpreting and are concerned that the use of this technology will give end-users a false sense of security and make them more inclined to choose distance interpreting over onsite interpreting all the time, causing quality to plummet with a corresponding decrease in pay and status for interpreters. Some respondents also believe that onsite interpreting is still the only way to ensure high-quality interpreting services as they believe that VC technology makes interpreting too impersonal and hinders the interpretation of messages or the awareness of nuances in meaning transfer. Our second research question addresses the way respondents learnt to use the different technologies. Only 10% to 18% of the respondents has learnt to use one or more of the technologies during their studies. Self-training seems to be a very common training, except for CAT and TB tools. It needs to be acknowledged, as a limitation to our study, that participants could only indicate one form of training. It is conceivable, however, that some respondents learnt to work with the technologies through more than one form of training. The third research question investigates the relationship between the form of training and the frequency of use of the tools. Our findings suggest that formal studies do not seem to lead to clearly higher use of specific tools such as CAT and TB. We found no significant difference in the extent to which the form of training is associated with a higher frequency of use, except for CAT and TB tools. In the case of CAT tools, self-training seems to lead to a significantly higher frequency of use than informal training. In the case of TB, self-training seems to be associated with a significantly higher frequency of use than informal training and workshops. Research question number four aimed to assess whether formal training in translation or interpreting is associated with a higher frequency of use of the technologies. Although it should be kept in mind that formal translator and interpreting training is likely to be considerably different across countries, our results suggest that formal training positively influences the frequency of use of CAT tools. However, in general the use of this technology remains very low. Our next research question explores the influence of specific training in PSIT on the frequency of use of the different technologies. With respect to MT, we already observed a slight correlation between age and the use of this technology, suggesting younger people tend to make more use of MT (but certainly not all of them). The frequency of use of MT also seems slightly positively associated with PSIT training. Age and former PSIT training could therefore be two factors affecting the use of MT, but further research should corroborate this claim. In this case as well, it should be acknowledged that we do not know the exact nature of respondents’ PSIT training, as the way specific PSIT training is organised across countries is possibly very different. 119.
(14) Our last research question focused on possible geographical variations in the technologies’ frequency of use. Our results suggest that European PSITs use CAT and TB tools more extensively than their Australian peers. This may be explained on the premise that translation and interpretation programmes in Europe tend to integrate training in these tools more than in Australia but this obviously requires further evidence-based research.. 6. Conclusion In this article we have looked more deeply at the question whether prior forms of technology training of public service interpreters and translators relate to how often they use technologies in the context of PSIT. In the discussion of results, we have limited ourselves to CAT, IM, MT, TB and VC technology. From our data we derive that respondents use the aforementioned technologies with different frequencies and that the effect of the nature of the training method may be a possible determining factor in this respect (in some cases). The quantitative survey method that we have used in this study obviously has several limitations, some of which we would like to mention here. First, it is important to point out that the survey as research instrument only shows us possible indications of technology use, as in reality we only measure subjective claims of respondents on this issue. Furthermore, the survey also has the limitation that respondents sometimes interpret certain questions differently than they were initially intended. This was evident, for example, in the question about TB tools, where some respondents consider the search for terms via various internet sources as part of TB technology, while we focused on the use of terminology list creation and management tools. Such misconceptions became apparent in the answers to our open questions in the survey and could thus be filtered out of the data. Another limitation is that a lot of information is lost or more difficult to retrieve, simply because of the way the survey was set up. This explains why in this survey we asked open questions to the respondents to find out more about why PSITs do vs. don't or often vs. do not often use the tools mentioned above. Furthermore, some results regarding the frequency of technology use give a somewhat distorted view because in this survey we did not further divide the group of PSITs into two subgroups: namely public service interpreters and public service translators. Since the data in this article were taken from a survey that was drawn up with a different aim in mind – namely to compare technology use between public service providers and PSITs – it was initially decided not to subdivide PSITs further as this would make the structure of the survey more complicated. Furthermore, it appears in practice that PSITs often perform both translation and interpreting assignments, which was also confirmed by answers of the PSIT respondents. Therefore, it is difficult to separate out translation vs. interpreting. Future research could look more into the professional contexts of each individual respondent. This can be done by contacting the participants who have given their email addresses. As mentioned above, this article only deals with some of the aspects covered by the questionnaire. Further research could include, amongst others, the exploration of the relation between frequency of use and specific professional settings, the attitudes of respondents towards technology, the relation between the use of certain tools according to countries or age groups of the respondents, the influence of the work regime (employee vs. freelancer) on the use of technology, as well as the exploration of other issues related to language combinations, particularly focusing on languages of lesser diffusion, for which fewer tools might be available.. 120.
(15) References Balogh, K. and Salaets, H. 2018. “Videoconferencing in Legal Context: A Comparative Study of Simulated and Real-Life Settings”. Napier, J.; Skinner, R. and Braun, S. (eds.) Here or There. Research on Interpreting via Video Link. Washington: Gallaudet University Press: 264-298. Biau Gil, R. J. and Pym, A. 2006. “Technology and Translation (A Pedagogical Overview)”. Pym, A., Perekrestenko, A. and Stranik, B. (eds.) Translation Technology and Its Teaching. Tarragona: Servei de Publicacions: 5-19. Bowker, L. and Corpas, G. 2015. “Translation Technology”. Mitkov, R. (ed.) Handbook of Computational Linguistics, 2nd edition. Oxford: Oxford University Press: page range online [Available at: http://www.oxfordhandbooks.com/view/10.1093/oxfordhb/9780199573691.001.0001/ oxfordhb-9780199573691-e-007]. Braun, S. 2015. “Remote Interpreting”. Mikkelson, H. and Jourdenais, R. (eds.) The Routledge Handbook of Interpreting. London/New York: Routledge Taylor and Francis Group: 352-367. Chan, Y.-F.; Alagappan, K.; Rella, J.; Bentley, S.; Soto-Greene, M. and Martin, M. 2010. “Interpreter Services in Emergency Medicine”. The Journal of Emergency Medicine, 38 (2): 133-139. Costa, H., Corpas Pastor, G. and Durán Muñoz, I. 2014. “A Comparative User Evaluation of Terminology Management Tools for Interpreters”. Proceedings of the 4th International Workshop on Computational Terminology. Dublin: 68-76. Costa, H.; Corpas Pastor, G. and Durán-Muñoz, I. 2017. “Assessing Terminology Management Systems for Interpreters”. Corpas Pastor, G. and Durán-Muñoz, I. (eds.) Trends in ETools and Resources for Translators and Interpreters. Leiden/Boston: Brill Rodopi: 57-84. Cronin, M. 2013. Translation in the Digital Age. London/New York: Routledge. D’Hayer, D. 2012. “Public Service Interpreting and Translation: Moving Towards a (Virtual) Community of Practice”. Meta: Journal Des Traducteurs, 57 (1): 235-247. EMT Board. 2017. “European Master’s in Translation Competence Framework”. ENPSIT Training and Accreditation Committee. s.d. “Public Service Interpreting: Minimally required competence in terms of knowledge, skills and attitudes”. [Available at: http://www.enpsit.org/uploads/1/1/3/8/113822115/t_a-document_1competences_skills.pdf]. Fantinuoli, C. 2016. “InterpretBank: Redefining Computer-Assisted Interpreting Tools”. Proceedings of the 38th Conference Translating and the Computer. London: 42-52. Fantinuoli, C. 2017. “Computer-Assisted Interpreting: Challenges and Future Perspectives”. Corpas Pastor, G. and Durán Muñoz, I. (eds.) Trends in E-Tools and Resources for Translators and Interpreters. Leiden/Boston: Brill Rodopi: 153-174. Fantinuoli, C. 2018. “Interpreting and Technology: The Upcoming Technological Turn”. Fantinuoli, C. (ed.) Interpreting and Technology. Berlin: Language Science Press: 112. Goldsmith, J. 2018. “Tablet Interpreting”. Translation and Interpreting Studies. The Journal of the American Translation and Interpreting Studies Association, 13 (3): 342-365. Kerremans, K.; Cox, A.; Lázaro Gutiérrez, R.; Rillof, P. and Stengers, H. 2018. “On the Use of Technologies in Public Service Interpreting and Translation Settings”. Read, T.; Montaner, S. and Sedano, B. (eds.) Technological Innovation for Specialized Linguistic 121.
(16) Domains. Languages for Digital Lives and Cultures Proceedings of TISLID’18. Latvia/Mauritius: Editions Universitaires Européennes: 57-68. Kerremans, K.; De Ryck, L.-P.; De Tobel, V.; Janssens, R.; Rillof, P. and Scheppers, M. 2018. “Bridging the Communication Gap in Multilingual Service Encounters: A Brussels Case Study”. The European Legacy: 1-16. Lázaro Gutiérrez, R. and del Sánchez Ramos, M. 2015. “Corpus-Based Interpreting Studies and Public Service Interpreting and Translation Training Programs: The Case of Interpreters Working in Gender Violence Contexts”. Romero Trillo, J. (ed.) Yearbook of Corpus Linguistics and Pragmatics 2015: Current Approaches to Discourse and Translation Studies. Heidelberg/New York/Dordrecht/London: Springer International Publishing: 275-292. Rillof, P. and Buysse, L. 2015. “Getting Organized to Beat Babel in Multilingual Service Encounters: The European Network for Public Service Interpreting and Translation (ENPSIT)”. Translation & Interpreting, 7 (3): 186-197. Rillof, P.; Van Praet, E. and De Wilde, J. 2015. Eindrapport - Communicatiematrix Kind en Gezin. Brussel: Agentschap voor Integratie en Inburgering. Ziegler, K. and Gigliobianco, S. 2018. “Present? Remote? Remotely Present! New Technological Approaches to Remote Simultaneous Conference Interpreting”. Fantinuoli, C. (ed.) Interpreting and Technology. Berlin: Language Science Press: 119139.. 122.
(17)
Figure
+2
Documento similar
In the previous sections we have shown how astronomical alignments and solar hierophanies – with a common interest in the solstices − were substantiated in the
Our quantitative analysis, then, could be summarised by saying that the differences observed in the frequency of use of connectives between translations and
Díaz Soto has raised the point about banning religious garb in the ―public space.‖ He states, ―for example, in most Spanish public Universities, there is a Catholic chapel
teriza por dos factores, que vienen a determinar la especial responsabilidad que incumbe al Tribunal de Justicia en esta materia: de un lado, la inexistencia, en el
It is generally believed the recitation of the seven or the ten reciters of the first, second and third century of Islam are valid and the Muslims are allowed to adopt either of
ABSTRACT Transformation of the Specialized Knowledge of Future Primary Teachers on Fraction Division
From the phenomenology associated with contexts (C.1), for the statement of task T 1.1 , the future teachers use their knowledge of situations of the personal
In the preparation of this report, the Venice Commission has relied on the comments of its rapporteurs; its recently adopted Report on Respect for Democracy, Human Rights and the Rule
The draft amendments do not operate any more a distinction between different states of emergency; they repeal articles 120, 121and 122 and make it possible for the President to
