Quantization of Moisture Content in Yerba Mate
Leaves through Image Processing
Lucas Leiva1, Nelson Acosta
INCA/INTIA, Fac. Cs. Exactas, UNICEN 7000 Tandil, Argentina
{lleiva, nacosta}@exa.unicen.edu.ar
Abstract. The Yerba Mate quality is defined by estimating the product moisture content. This value allows adjusting the production system, by controlling the stake of the dryer to ensure the product quality. Currently this process is done manually. However, this paper presents a first approach method to estimate the moisture contents of Yerba Mate leaves through image processing techniques. The output of the proposed system is established by a neural network MLPBP, which quantifies the level of moisture for a given sample. Also present the results of applying the proposed method to a set of 55 samples collected in a Yerba Mate production establishment.
Keywords: Yerba Mate moisture quantization, image processing, artificial neural networks.
1 Introduction
The production process of Yerba Mate (Ilex paraguariensis Saint Hilaire) includes two main stages: the harvest and processing. The processing consists transferring the raw material, pre-drying, drying, “canchado”, grinding and packaging [1].
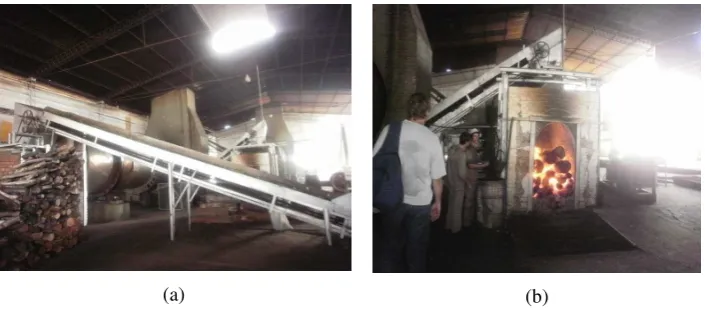
The pre-drying, also known as “sapeco”, is intended to remove moisture content as much as possible to the raw material for a short time. During this stage, the material is subjected to wood combustion gases reaching temperatures of 400-550° C. This process is made using a rotary cylinder (Fig. 1 a). The pre-drying time varies from 2 to 4 minutes and the gases temperature can reach 250° C.
The fire control (Fig. 1 b) is permanent and must be performed by trained personnel to ensure a continuous and uniform flame. This procedure defines the evolution of the product. The goal is to generate an enzyme inactivation, loss of moisture of approximately 40 to 60%, and rupture of vesicles, by achieving high temperatures in a very short time.
1 PhD scholarship of CONICET
(a) (b)
Fig. 1. a) Lateral view of pre-dryer, b) pre-dryer stake.
Currently, the moisture content analysis at the pre-dryer output is performed manually. An expert determines the correct temperature level based on their experience.
Since the last decades a large number of industries are incorporating vision systems that allow them to solve particular problems in their production lines and increase product quality. These systems can automate complex processes and avoids need for workers in hazardous environments. Vision systems used in the industry are called Machine Vision.
Machine Vision systems are used in several application areas and the literature of implementations of these systems is extensive. These systems can be found in: the semiconductor industry (LED wafer inspection [2], surface inspection of copper strips [3], BGA weld inspection [4]), industrial production lines (inspection of sheets Wood veneer [5]), food production lines (inspection and counting in baking lines [6], fault detection in recycled bottles [7], classification and quality assessment sheet snuff [8] classification of olives [9]) and automotive (parts inspection compression [10]), among others.
In Yerba Mate industry, the quality of production is affected by the availability of the expert. The expert is also working in a hazard environment (exposed to elevated temperatures). Both problems may be soluble implementing an automatic inspection system to quantify the moisture level of raw material at the pre-dryer output.
Several studies determine the level of chlorophyll in wheat [11] and barley leaves [12] from optical analysis using conventional cameras. Based on the conditions of the problem and the feasibility of a solution with this background, this work present a method for automatic quantification of moisture in the leaves of Yerba Mate at pre-dryer output using digital images. The moisture level estimating is performed through a neural network multilayer perceptron with backpropagation (MLPBP). This work tries to simplify costs from a previous hydric stress detection system [13] based on an NDVI sensor.
2 Proposed Method
The proposed method was implemented taking samples of Yerba Mate leaves at pre-dryer output. Some samples were taken from the pre-dryer input too, for increasing the knowledge base.
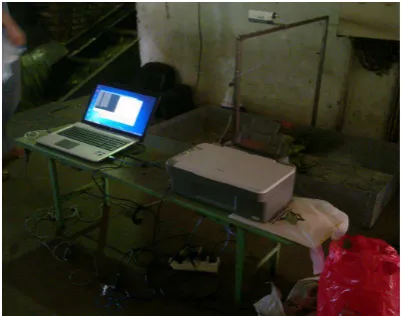
[image:3.595.197.398.272.430.2]The digitization of the samples was performed using a scanner (Fig. 2). This device provides a controlled environment in terms of lighting conditions, and is a standardized method for image capturing. Additionally, the scanner can be applied to the type of product to be analyzed.
Fig. 2. Digital image acquisition of Yerba Mate leaves using a scanner.
The samples, after being digitized, were placed in hermetically sealed vacuum bags for laboratory analysis. The laboratory analysis involved the use of an oven at 103 º C ± 2 ° C for 6 hours. The method performed allows obtaining the precise value of moisture content for each sample.
The data collection process was repeated 55 times in 5 days in two Yerba Mate productions establishments: "Playadito" in Colonia Liebig, province of Corrientes, and COOYAL, Apóstoles, Misiones.
(a) (b) (c)
[image:4.595.181.415.162.378.2](d) (e) (f)
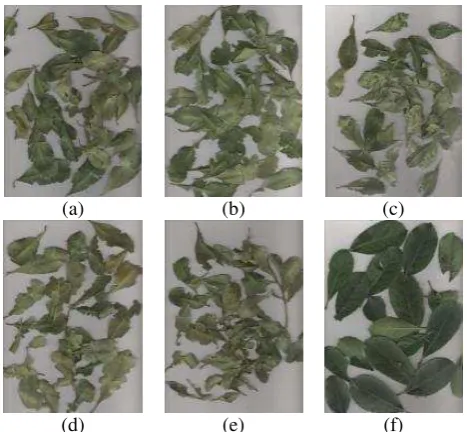
Fig. 3. Captured images with moisture contents in leaves of: a) 22,21%, b) 23,65%, c) 24,57%, d) 27,77%, e) 30,95%, y f) 61,7%.
The information obtained (digital images and real values of moisture contents), are input to the moisture estimation system. The system performs a segmentation of digital images, extracts the features which describe each of the samples and performs the moisture value estimation. The estimation takes into account the value determined in laboratory analysis for a particular sample. These steps are exploded in greater detail in the following sections. Figure 4 shows a block diagram of the system.
[image:4.595.194.399.500.661.2]2.1 Image Segmentation
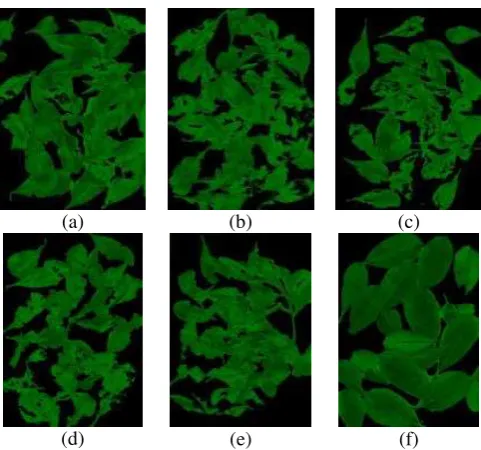
The image segmentation stage porpoise is to extract objects for analysis. In this case the objects to be analyzed are the Yerba Mate leaves. The images were decomposed into its three color components (RGB), taking in account only the green information. Previous analyzes performed showed that both blue and red components presents lack of information. Furthermore, this action allows an information volume reduction, eliminating irrelevant information, and consequently decreases the system response time.
Each of the scanned images was processed using a simple threshold, described in equation (1).
t
y
x
g
t
y
x
g
si
si
y
x
g
y
x
g
≤
>
=
)
,
(
)
,
(
)
,
(
0
)
,
(
( 1)Where g(x, y) is the green component value at point (x, y) of the image, and t a threshold valued empirically established at 0.5. The Figure 5 shows the results of the segmentation process for the set of images presented above.
(a) (b) (c)
[image:5.595.177.418.359.584.2](d) (e) (f)
2.2 Feature Extraction
The 8 bit depth images generated by the segmentation stage are used to generate a histogram of intensity values grouped by 4. Histograms of 32 components values are obtained associated with each of the images. The histograms were normalized for generating a feature vector according to equation (2).
32 8 / ) ( ) 8
( − = ∀i ≤i<
M i h i
fv (2)
Where h(i) is the histogram value at i-th position, M the number of pixels with significant information and fv(j) the value of the feature vector at j-th position. Values between 1 and 8 were discarded from the feature vector due to lack of information in all cases.
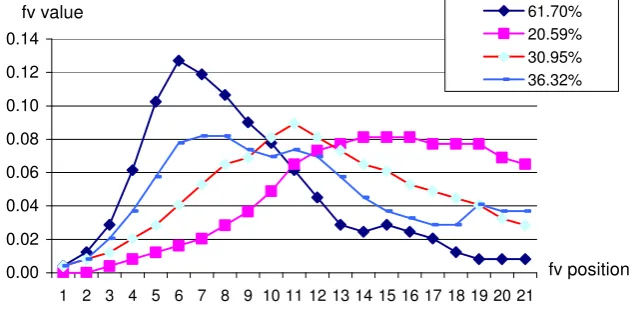
A preliminary analysis showed that this indicator can be used for classification of samples. The following figure shows the results obtained in the comparison of four samples, wherein it is noted that the curves of the samples with higher moisture levels are skewed to the left.
0.00 0.02 0.04 0.06 0.08 0.10 0.12 0.14
1 2 3 4 5 6 7 8 9 10 11 12 13 14 15 16 17 18 19 20 21 61.70% 20.59% 30.95% 36.32%
[image:6.595.150.466.349.505.2]fv position fv value
Fig. 6. Feature vector comparison for samples with several levels of moisture contents.
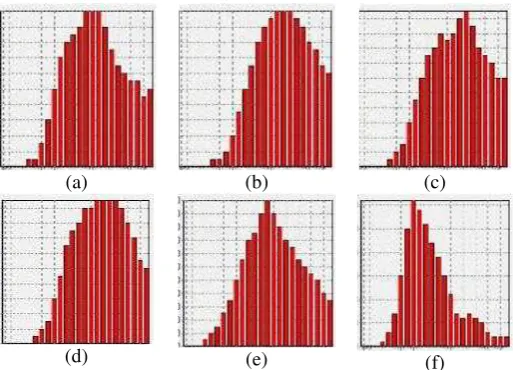
(a) (b) (c)
[image:7.595.170.427.146.331.2](d) (e) (f)
Fig. 7. Feature vector graphical representations for samples with moisture level of: a) 22,21%, b) 23,65%, c) 24,57%, d) 27,77%, e) 30,95%, y f) 61,7%.
2.3 Moisture Estimation
In literature, many works can predict the level of chlorophyll content in leaves [14] or the level of hydrogen [15][16]. These works use artificial neural networks multilayer perceptron with backpropagation training (MLPBP). MLPBP networks can be applied to nonlinear models with an acceptable error rate and avoid the need to model the problem adjusting to the solution through a training process.
The backpropagation training is performed by comparing the estimated output with the laboratory-measured value. The difference between the two values is the error, and is used to adjust the weights of each of the neurons that contained in the network. The weights adjust are based on mathematical optimization techniques. This process runs in iterative mode over the entire training set to achieve a minimum overall error defined.
Based on the background in using this technique to related problems, the output stage is implemented with an artificial neural network MLPBP, with Gaussian estimation function. The number of input neurons was 24 (one per component of the feature vector), 10 hidden neurons (determined empirically) and 1 output neuron. The output layer is the quantization moisture value estimated for a sample. The initial weights of the interconnections (or synapses) were established randomly.
3 Experimental Results
was set. The training required a total of 394 iterations to reach the minimum error constraint imposed.
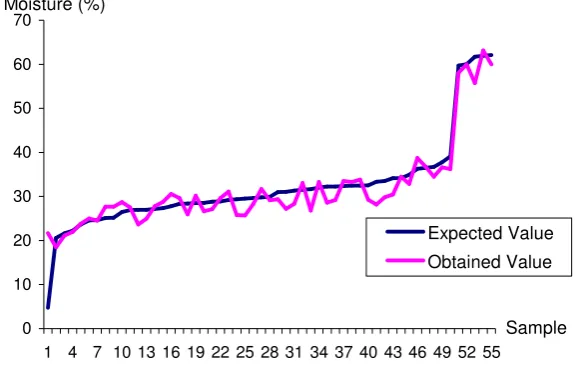
After the training process, the entire set of exemplars was evaluated. Figure 8 shows the comparison between the obtained and expected results (measured in the laboratory) for each one of the samples. The samples in the representation are ordered according to the value of moisture expected to facilitate understanding of the results obtained.
0 10 20 30 40 50 60 70
1 4 7 10 13 16 19 22 25 28 31 34 37 40 43 46 49 52 55
Expected Value
Obtained Value
[image:8.595.156.445.236.420.2]Sample Moisture (%)
Fig. 8. Expected and obtained values comparison applying the artificial neural network
Analyzing the results, we observed that the correlation coefficient between the expected and obtained is 0.95, and the covariance has a value of 94.56. The neural network showed an average error of 0.54 for the sample set. This value is considered in the acceptable range of error output. However a high maximum error value (16.95%) was obtained.
4 Conclusions y Further Works
This paper presents a first approach method to estimate moisture contents of Yerba Mate leaves applying image processing techniques. Images were captured from a conventional device (scanner) and the results were satisfactory.
Moreover, there are fluctuations of the expected output with respect to the obtained values (± 5%). If the moisture quantification requires greater precision, others descriptors must be analyzed, for example those used by Pagola [12] or Kawashima [17].
Finally, the results obtained show that an optical solution is feasible for the problem presented. For accuracy increasing, an optimization of the techniques used can be performed, considering a more intense sampling and a parameters adjustment of the neural network (number of hidden neurons, learning factor, initial weights). Furthermore, the processing time for the whole system is reduced. The computation effort for image segmentation, feature extraction and estimation are simplex. This feature allows implementing a real-time quantization system, which can be the input for a future automatic control system for pre-dryer temperature.
5 Funding
The research reported in this article have been funded by the PRASY (Regional Program of Assistance to the Yerba industry Sector) of INYM (National Institute of Yerba Mate), and developed by the National University of the Province of Buenos Aires and the National University of Misiones. The project was named “Feasibility Analysis for Development of a Prototype to Compute Real-Time Moisture of Yerba Mate at the pre-dryer output”, participants: Dr. Ing. H. Nelson Acosta (UNCPBA), Mg. Marcelo Marinelli (UNAM), Mg. Lucas Leiva (UNCPBA), Ing. Mario Valey (UNAM), Mg. Horacio Kuna (UNAM), Ing. Juan Toloza (UNCPBA), Carlos Kornuta (UNaM), Santiago Holowaty (UNAM) y Mauricio Poncio (UNCPBA).
References
1. Secretaría de Agricultura, Ganadería Pesca y Alimentos, 2007. Protocolo de calidad para yerba mate. Protocolos de calidad. Código SAA009, versión 08.
2. Chuan-Yu Chang, Chun-Hsi Li, Si-Yan Lin, MuDer Jeng, “Application of Two Hopfield Neural Networks for Automatic Four-Element LED Inspection”, IEEE Transactions on Systems, Man, and Cybernetics, Part C: Applications and Reviews, Volume 39, Issue 3, pp. 352-265, May 2009.
3. R. Liang, Y. Ding, X. Zhang, J. Chen, “Copper Strip Surface Defects Inspection”, Fourth International Conference on Natural Computation, vol. 2, 2008, pp. 41–45. 4. Ji-Quan Ma, Man-Hui Kong, Pei-Jun Ma; Xiao-Hong Su, “Detection of defects at
BGA solder joints by using X-ray imaging”, Proceedings of 2005 International Conference on Machine Learning and Cybernetics, vol. 8, 2005, pp: 5139–5143. 5. Meng-Xin Li, Cheng-Dong Wu, “A Vision Based Inspection Method for Wood
Veneer Classification”, IEEE Conference on Robotics, Automation and Mechatronics, 2008, pp. 494–498
7. Feng Duan, Yao-Nan Wang, Huan-Jun Liu, Yang-Guo Li, “A machine vision inspector for beer bottle”, Engineering Applications of Artificial Intelligence, vol. 20, Issue 7, pp. 1013-1021, October 2007.
8. Xinhong Zhang, Fan Zhang, “Images Features Extraction of Tobacco Leaves”, Congress on Image and Signal Processing, vol. 2, 2008, pp: 773 – 776.
9. R. Diaz, G. Faus, M. Blasco, J. Blasco, E. Molto, “The Application of a Fast Algorithm for the Classification of Olives by Machine Vision”, Food Research International, vol. 33, no. 3, pp. 305 – 309, April 2000.
10. Kang D.K., Chung Y.K., Doh W.R., Jung W., Park S.B, “Applying Object Modelling Technique to Automated Visual Inspection of Automotive Compressor Parts Omission”, Journal of Machine Tools and Manufacture, vol. 39, no. 11, pp: 1779 - 1792, November 1999.
11. Liangliang J, Chen X, Zhang F, Buerkert A, Romheld V , 2004. Use of digital camera to assess nitrogen status on winter wheat in the northern china plain. Journal of Plant Nutrition 27: 441-450.
12. Pagola M, Ruben O, Ignacio I, Humberto B, Edurne B, Pedro AT, Carmen L, Berta L, 2009. New method to assess barley nitrogen nutrition status based on image color analysis comparison with SPAD-502. Computers and Electronics in Agriculture 65:213- 218.
13. J. Toloza, L. Leiva, A. Riba, F. Carmona, N. Acosta. Desarrollo de un prototipo de sistema portátil para la detección en tiempo-real de la necesidad de riego en cultivos de producción intensiva, CACIC 2010: XVI Congreso Argentino de Ciencias de la Computación, Buenos Aires, Argentina, 2010.
14. Chen CT, Chen S, Hsieh KW, Yang HC, Hsiao S, Yang C, 2007. Estimation of leaf nitrogen content using artificial neural network with cross-learning scheme and significant wavelengths, Transactions of the ASAE 50: 295-301.
15. Noh H, Zhang Q, Shin B, Han S, Feng L, 2006. A neural network model of maize crop nitrogen stress assessment for a multispectral imaging sensor. Biosystems Engineering 94: 477-485.
16. Gautam RK, Panigrahi S, 2007. Leaf nitrogen determination of corn plant using aerial images and artificial neural networks. Canadian Biosystems Engineering 49: 7.1-7.9. 17. Kawashima S, Nakatani M, 1998. An algorithm for estimating chlorophyll content in