Analysis of bovine whey proteins in soybean dairy like products by capillary electrophoresis
10
0
0
Texto completo
(2) 78. ´ et al. / J. Chromatogr. A 859 (1999) 77 – 86 C. Garcıa-Ruiz. to control the quality of many products commercialized as 100% vegetable. Different techniques such as high-performance liquid chromatography (HPLC) [3–11] or capillary electrophoresis (CE) [12,13] have been used to analyze soybean or bovine whey proteins. However, the simultaneous separation of soybean and animal whey proteins has only been recently achieved by reversed-phase (RP) HPLC [14,15]. Thus, a RPHPLC method has been developed to separate soybean and bovine whey proteins simultaneously in approximately 20 min and to quantify these proteins from the resulting whey upon acid precipitation of a dairy-like soybean product [14]. An ultrarapid detection of bovine whey proteins in a powdered soybean milk was also achieved by perfusion RPHPLC in a very short analysis time (about 5 min) [15]. In spite of the interesting possibilities that CE techniques offer concerning protein separation [16,17], as far as we know, there is no reference in the literature to the application of this technique for the simultaneous separation of soybean and bovine whey proteins. This is why in this work CE has been directed toward attaining two objectives: (i) to separate simultaneously soybean proteins (globulins) from bovine whey proteins [a-LA and b-LG (A1B)] and (ii) to quantify bovine whey proteins in commercial powdered soybean milks in which these proteins were included in their formulation.. 2. Experimental. 2.1. Chemicals and samples All reagents were of analytical grade. Boric acid and disodium phosphate anhydrous were obtained from Scharlau (Barcelona, Spain); 2-(N-cyclohexylamino)ethanesulfonic acid (CHES) was purchased from Sigma (St. Louis, MO, USA); sodium hydroxide, sodium sulfate anhydrous and urea were supplied from Panreac (Barcelona, Spain); methylhydroxyethylcellulose (MHEC) was purchased from Aldrich (Milwaukee, WI, USA). All solutions were prepared with HPLC-grade water (Milli-Q system; Millipore, Bedford, MA, USA). Standards of a-LA and b-LG (A1B) were from. Sigma. The soybean protein isolate (SPI), taken as standard of soybean proteins, was from ICN (Aurora, OH, USA). The powdered soybean milk was a commercial product for human consumption purchased from a local market in Alcala´ de Henares (Madrid, Spain). Its composition according to the label of the product was the following: soybean protein isolate, bovine whey, calcium phosphate, lecithin, vitamins A, C, D, B 12 , thiamine, riboflavin, niacin, pantotenic acid, folic acid and minerals.. 2.2. Apparatus The capillary electrophoresis instrument was a Model 279A-HT from Applied Biosystems (Norwalk, CT, USA), equipped with an UV detector, a temperature-controlled capillary compartment and an autosampler. Data treatment was performed with a Turbochrom acquisition system (Perkin-Elmer, Norwalk, CT, USA). Spectra and derivatives for peaks of standards and sample were obtained in a HP 3D CE system (Hewlett-Packard, Waldbronn, Germany) equipped with an on-column diode array detection (DAD) system and a HP 3D CE Chemstation software. The fused-silica column employed [60 cm (40 cm to the detector)350 mm I.D.3360 mm O.D.] was obtained from Polymicro Technologies (Phoenix, AZ, USA). Temperature was kept constant and equal to 308C. Injection was performed by vacuum (67.73 kPa during 1 s). Electrolytic solutions were degassed in a Penta ultrasonic system (Martorell, Spain). A Model 93 pH meter (Radiometer Copenhagen, Bagsvaerd, Denmark) was employed to adjust the pH of the buffers. Centrifugation was performed at 2000g for 20 min in a Sorvall RD-5B refrigerated superspeed centrifuge (DuPont, Newtown, CT, USA).. 2.3. Procedure Buffers were prepared as follows: (i) the acids or salts (CHES, boric acid and disodium phosphate) and additives (sodium sulfate, MHEC and urea) were weighed and dissolved in HPLC-grade water; (ii) solutions were sonicated during 5 min; (iii) pH of solutions was adjusted at a value close to 8 with a concentrated solution of sodium hydroxide (borate and CHES buffers) or with the phosphoric acid in the.
(3) ´ et al. / J. Chromatogr. A 859 (1999) 77 – 86 C. Garcıa-Ruiz. case of phosphate buffer; (iv) once prepared, these separation media were sonicated during 5 min and filtered [through 0.22-mm disposable sterile polysulfone filters (Alltech, Deerfield, IL, USA)] before injection. Sample solutions were easily prepared weighing and dissolving an appropriate amount of the powdered soybean milk in each separation medium, sonicating and filtering before injection. When the whey protein b-LG (A1B) could not be detected by direct injection of the sample solution in the CE system, a preconcentration step was applied in order to concentrate this protein. This preconcentration was made following the method described by the International Dairy Federation (15 October 1993) [18] and consisted of an acid precipitation (2 M HCl, pH 4.6) of a freshly prepared solution corresponding to a glass of milk (about 12 g of powdered soybean milk in 250 ml of Milli-Q water) and subsequent centrifugation (2000 g during 20 min) to precipitate the major fraction of soybean proteins and, simultaneously, to concentrate the bovine whey proteins in the supernatant. At the beginning of the day, the column was rinsed with HPLC-grade water (5 min), followed by 0.1 M sodium hydroxide (5 min), and finally HPLCgrade water (5 min). Typically, analyses were performed automatically by the equipment described before using a run sequence that included the following steps: (i) 2-min rinse with HPLC-grade water; (ii) 2-min rinse with 0.1 M sodium hydroxide; (iii) 2-min rinse with HPLC-grade water; (iv) 4-min rinse with the separation medium (buffer and additives); (v) hydrodynamic sample injection from the sample vial; and (vi) sample separation run for 15 min with the separation medium in inlet and outlet vials. All analyses were performed in triplicate.. 2.4. Quantitative analysis and method validation Quantitative analysis was performed using the calibration method of the external standard (four points were used to obtain each calibration plot, each point corresponding to the analysis by triplicate of each standard solution). Thus, solutions containing known concentrations of a-LA and b-LG (A1B) standards were prepared individually in the electrolytic solution to built the calibration lines. Integra-. 79. tion of peaks was made by setting the baseline from valley to valley. As b-LG (A1B) protein showed two peaks in the electropherogram of the standard and the sample, the calibration in this case was made considering the addition of both peak areas. The CE method developed was validated by evaluating the precision (repeatability and reproducibility) and the accuracy. Detection limits were individually calculated from the calibration curve as the concentration of bovine whey proteins giving a signal equal to the intercept plus three times the standard error of the straight line [19].. 3. Results and discussion. 3.1. Simultaneous separation of soybean and bovine whey proteins by CE In order to select the most suitable experimental conditions for the simultaneous separation of soybean and bovine whey proteins, some preliminary experiments were performed. Mixtures of standards of these proteins were injected in different experimental conditions in which the nature of the separation buffer, additives, detection wavelength and the applied voltage were modified. Two buffers of inorganic nature (borate and phosphate) and another of organic nature (CHES) were used with and without some additives as sodium sulfate, MHEC and urea. Sodium sulfate was used as modifier of the electroosmotic flow (EOF) because the increase of ionic strength of the buffer decreases the EOF and improves resolution [20]. MHEC was employed to prevent adsorption of proteins to the inner wall of the capillary [12,20]. Urea, a denaturing agent for proteins, was used at low concentration (1 M) to increase protein solubilization [20,21]. Basic pH values (near 8) were employed. This pH value was considered appropriate to analyze both bovine whey and soybean proteins because at this pH they are negatively charged and the adsorption to the negatively charged inner wall of the capillary is minimum. When CHES buffer modified with 1 M urea was used at basic pH values, poor efficiency and resolution were obtained in the separation of the.
(4) ´ et al. / J. Chromatogr. A 859 (1999) 77 – 86 C. Garcıa-Ruiz. 80. sponding to b-LG (A1B). Identification of all these peaks was done by injecting individually into the CE system each bovine whey protein standard and SPI. On the other hand, when 0.100 M borate buffer with 0.030 M Na 2 SO 4 and 0.2 mg / ml of MHEC (pH 8) was employed to analyze a standard mixture of bovine whey proteins and SPI, the electropherogram obtained was very similar to that corresponding to phosphate buffer showing two peaks at migration times of about 5 and 7 min for soybean proteins, one peak of about 6 min due to a-LA, and two partially resolved peaks at about 9 min corresponding to b-LG (A1B). Despite the good resolution obtained for the standard proteins with both phosphate and borate buffers, a minor matrix effect was observed with phosphate buffer when injecting real samples into the CE system. Several detection wavelengths were also investigated as shown in Table 1. In fact, wavelengths from 214 nm (corresponding to peptide bonds) to 280 nm (corresponding to the maximum absorption of aro-. proteins as indicated in Table 1. In contrast, when phosphate and borate buffers were used at pH close to 8 with the additives indicated in Table 1, five peaks (or six peaks when additives such as Na 2 SO 4 or MHEC were added to the buffers, making peak 1 partially resolved into two peaks) were separated when mixtures of standards of bovine whey proteins and SPI were injected. As an example, Fig. 1 shows the effect of some additives on the separation of the mixture of proteins (bovine whey proteins and SPI) with phosphate buffer. It can be observed that efficiency and resolution [especially for the two peaks corresponding to b-LG (A1B)] improved when additives (1 M urea and 1.2 mg / ml MHEC) were added to a 0.05 M phosphate buffer (pH 8). Under these conditions, the electropherogram obtained showed two peaks at migration times about 6 and 10 min for soybean proteins (peaks 1 and 3 in Fig. 1), one peak about 9 min corresponding to a-LA (peak 2 in Fig. 1), and two partially resolved peaks at about 11 min (peaks 4 and 5 in Fig. 1) corre-. Table 1 Results obtained in some preliminary experiments performed to simultaneously separate soybean and bovine whey proteins a,b Buffer. Additives. pH. l (nm). V (kV). 0.050 M CHES. 1 M Urea. 8.9 7.9. 230 254. 20 20. 4 2. 7 7. 0.050 M Phosphate. None 0.030 M Na 2 SO 4 1 M Urea. 8.0 8.0 8.0 8.0 8.0 8.0 8.0 8.0 8.0 8.0 8.0 8.0 8.0 8.0. 280 280 225 235 245 254 265 280 245 245 245 245 245 280. 15 15 20 20 20 20 20 20 20 30 20 15 15 15. 52 92 85 85 85 85 85 85 85 .100 75 52 52 52. 13 13 9 9 9 9 9 9 14 6 9 14 12 12. 8.0 8.0 8.2. 214 254 254. 20 20 20. 66 66 78. 10 10 10. 1 M Urea, 0.2 mg / ml MHEC 1 M Urea, 0.6 mg / ml MHEC. 1 M Urea, 1.2 mg / ml MHEC. 0.100 M Borate. 0.030 M Na 2 SO 4 0.2 mg / ml MHEC, 0.030 M Na 2 SO 4. a. I (mA). Analysis time (min). Observations. Poor efficiency and resolution of standard proteins Good resolution of standard proteins Good resolution of standard proteins Maximum signal-to-noise ratio was obtained for bovine whey proteins at 280 nm. Very good resolution of standard proteins employing 1.2 mg / ml of MHEC and an applied voltage of 15 kV. Poor resolution of standard proteins Good resolution of standard proteins. A mixture of SPI, a-LA, and b-LG (A1B) standards was used. Concentrations (mg / g sol., as is basis) ranged from 2 to 13 for SPI, from 0.3 to 1.2 for b-LG (A1B) and from 0.1 to 0.9 for a-LA. b Injection by vacuum, 67.73 kPa during 1 s..
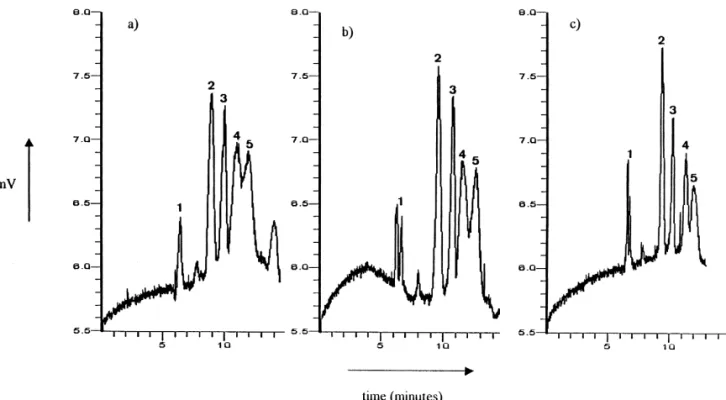
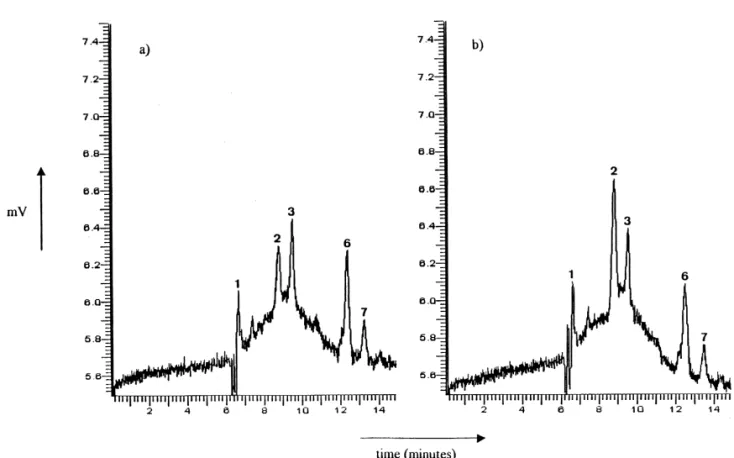
(5) ´ et al. / J. Chromatogr. A 859 (1999) 77 – 86 C. Garcıa-Ruiz. 81. Fig. 1. Electropherograms corresponding to the injection of a mixture of SPI, a-LA and b-LG (A1B) standards employing different additives in the separation media. Conditions: detection wavelength, 280 nm; applied voltage, 15 kV; injection by vacuum, 67.73 kPa during 1 s.; temperature, 308C; concentration as is basis: SPI, 13.04 mg / g sol.; a-LA, 0.39 mg / g sol.; and b-LG (A1B), 1.18 mg / g sol.; capillary [60 cm (40 cm to the detector)350 mm I.D.3360 mm O.D.]. Separation media: (a) 0.050 M phosphate buffer (pH 8); (b) 0.050 M phosphate buffer, 0.030 M sodium sulfate (pH 8); (c) 0.050 M phosphate buffer, 1 M urea, 1.2 mg / ml MHEC (pH 8). Peaks: 1,35soybean proteins; 25a-LA; 4 and 55b-LG (A1B).. matic amino acids such as tyrosine and tryptophan) were investigated. At first, 245 and 254 nm were chosen as better wavelengths to detect proteins in standards mixtures. However, when a commercial powdered soybean milk was injected it was observed that the most suitable wavelength to detect bovine whey proteins corresponded to 280 nm, for which matrix signals did not appear. In these conditions, the detection of a-LA was possible by direct injection of the sample dissolved in the separation buffer. Finally, although different values of applied voltages ranging from 15 to 30 kV were tested (see Table 1), a value of 15 kV was chosen as a compromise between current intensity and analysis time.. 3.2. Quantitative analysis of bovine whey proteins in a commercial soybean dairy-like product In order to show the potential of the CE method developed concerning the quality control of soybean dairy-like products as regards to the detection of the. presence of bovine whey proteins in these products, quantitation of these proteins in a commercial powdered soybean milk containing bovine whey proteins was achieved. The experimental conditions used for these analyses were those previously chosen: 0.05 M phosphate buffer (pH 8) with 1 M urea and 1.2 mg / ml MHEC, detection wavelength, 280 nm, and applied voltage, 15 kV. Fig. 2a shows the electropherogram obtained when the powdered soybean milk, dissolved in the separation media, was directly injected into the CE system. In this figure, peaks corresponding to soybean proteins (1 and 3) and to a-LA contained in the powdered soybean milk (peak 2) can be observed. Fig. 2b shows the electropherogram corresponding to the same sample spiked with the standard of a-LA. The increase observed in the area of peak 2 when spiking the real sample with a-LA standard enabled to identify the peak 2 as the peak corresponding to a-LA protein. This fact was also corroborated by comparing the spectra and derivatives of peak 2.
(6) 82. ´ et al. / J. Chromatogr. A 859 (1999) 77 – 86 C. Garcıa-Ruiz. Fig. 2. Electropherograms corresponding to the injection of a commercial powdered soybean milk in which bovine whey proteins were included in its formulation. Conditions: 0.050 M phosphate buffer, 1 M urea, 1.2 mg / ml MHEC (pH 8); other experimental conditions as in Fig. 1. Concentration as is basis: (a) powdered soybean milk, 29.39 mg / g sol.; (b) powdered soybean milk, 29.66 mg / g sol. spiked with 0.16 mg / g sol. a-LA. Peaks as in Fig. 1: 6 and 75unknown peaks.. obtained in the sample with that of the a-LA standard. Fig. 2a and b show that peaks corresponding to soybean proteins (1 and 3) and a-LA (peak 2) can be observed by direct injection of a solution of the sample; however, peaks corresponding to b-LG (A1 B) were not observed. In fact, peaks 6 and 7 were unknown peaks which did not appear when a SPI or a-LA or b-LG (A1B) standards were injected into the CE system. A study of all peaks obtained using diode-array detection indicated that these peaks did not correspond to protein material. To detect the b-LG (A1B) present in the powdered soybean milk analyzed, a previous step, preconcentration by the protocol described in the Experimental section, was necessary. Fig. 3a shows the electropherogram obtained by direct injection of the supernatant (whey) obtained upon acid precipitation of a solution of the powdered soybean milk, and Fig. 3b shows the electropherogram corresponding to the. supernatant supplemented with b-LG (A1B) standard. The increase observed in the areas of the two peaks corresponding to b-LG (A1B) when spiking the sample with b-LG (A1B) standard showed that peaks 4 and 5 corresponded to this bovine protein. This point was also corroborated comparing the spectra and derivatives for peaks in the sample an in the standard, when DAD was used. For quantitative analysis of bovine whey proteins in the powdered soybean milk, the external standard method was used for calibration and individually performed for each bovine whey protein. Linear relationships were obtained for the variation of the peak area as a function of the concentration of a-LA (working concentration range from 0.036 to 0.356 mg / g sol. as is basis) and b-LG (A1B) (working concentration range from 0.122 to 0.927 mg / g sol. as is basis) standards. Good linear correlations were found in both cases (r.0.999) (four points considered for the calibration). The characteristics of these.
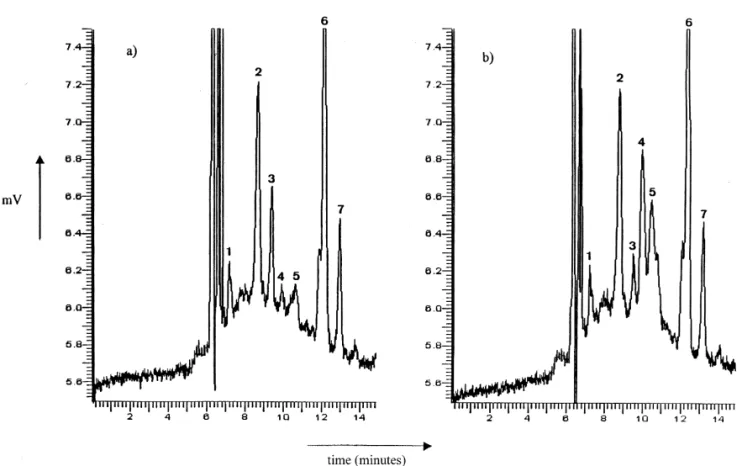
(7) ´ et al. / J. Chromatogr. A 859 (1999) 77 – 86 C. Garcıa-Ruiz. 83. Fig. 3. Electropherograms corresponding to the whey obtained by acidic precipitation of a solution (43.93 mg / g sol. as is basis) of a commercial powdered soybean milk. Experimental conditions as in Fig. 2. (a) Direct injection of the whey; (b) direct injection of the whey spiked with b-LG (A1B) (0.61 mg / g sol.). Peaks as in Fig. 1: 6 and 75unknown peaks.. calibration plots enabled the evaluation of the CE method sensitivity as slopes of the straight lines obtained [2.74?10 24 g sol. / mg protein for a-LA and 1.34?10 24 g sol. / mg protein for b-LG (A1B)] and determining detection limits for both proteins from the intercept values [290 for a-LA and 545 for b-LG (A1B)], not being significantly different from zero, t-test, P,0.05 [19]. Detection limits obtained were 14 mg / g sol. for a-LA and 52 mg / g sol. for b-LG (A1B) [about 60 mg / 100 g sample for a-LA and 100 mg / 100 g sample for b-LG (A1B)]. To evaluate the precision of the optimized CE method, repeatability and reproducibility were also studied. The repeatability in migration time and peak area was determined (as relative standard deviation, RSD) for six consecutive injections of solutions of a-LA or b-LG (A1B) standards. The RSDs were about 2.4% for migration time and 3.4% for peak area in the case of a-LA (0.130 mg / g sol. as is basis) and even minor for b-LG (A1B) (0.730 mg / g sol. as is basis) for which the RSD was about 0.6%. in migration time and 1.9% in peak area. On the other hand, reproducibility for a-LA content in the commercial soybean product analyzed was measured as the RSD obtained for the six values of concentration determined by the CE method when six individual analyses were performed. Results obtained are shown in Table 2. It can be observed that the RSD obtained was equal to 3%. Likewise, reproducibility of the b-LG (A1B) content in the whey obtained after acid precipitation of the same product was evaluated as the RSD obtained for the five values of concentration determined by the CE method in five individual analyses of the whey. In this case, the RSD obtained was less than 3% (Table 2). Accuracy of the method was evaluated by calculating the recovery (%) of each bovine whey protein when a known quantity of a standard of the corresponding protein was added to three solutions prepared with the powdered soybean milk analyzed (in the case of the a-LA) or to three whey solutions obtained after acid precipitation of the analyzed.
(8) ´ et al. / J. Chromatogr. A 859 (1999) 77 – 86 C. Garcıa-Ruiz. 84. Table 2 Reproducibility in the a-LA (six individual determinations) and b-LG (A1B) (five individual determinations) contents in a commercial powdered soybean milk elaborated with bovine whey proteins (calibration by the external standard method)a a-LA Cs. b-LG (A1B). b. n. 27.511 27.485 26.148 28.753 24.778 26.586. 3 3 3 3 3 3. Mean value (RSD, %). c. Concentration of a-LA determined (mg / 100 g sample). Cs b. nc. Concentration of b-LG (A1B) determined (mg / 100 g sample). 0.502 0.495 0.462 0.495 0.479 0.486. 43.486 55.096 55.713 58.844 56.603. 4 2 3 3 3. 0.567 0.554 0.539 0.536 0.529. 0.486 (2.97). 0.545 (2.81). a. Experimental conditions as in Fig. 2. b Concentration of the sample solution as is basis (mg / g sol.) c Number of replicates for each sample.. commercial product [in the case of the b-LG (A1 B)]. Table 3 groups all data from which recovery (%) for these proteins could be obtained. The powdered soybean milk employed contained 0.486 mg / 100 g sample of a-LA and 0.545 mg / 100 g sample of b-LG (A1B) (content determined by the CE method, see Table 2). Solutions were prepared by weighing and dissolving an adequate quantity of the powdered soybean milk (three solutions to study the accuracy of each protein) and the corresponding. concentration of each bovine protein in each solution was calculated (mg / g sol.). After adding different concentrations of a-LA to the solutions of the sample and different concentrations of b-LG (A1B) to the whey obtained after acid precipitation of each solution of the sample, the total expected (theoretical) content of each protein in each sample solution or whey can be obtained. The comparison between this theoretical content and that determined by the CE method enabled to obtain the recovery for each. Table 3 Accuracy estimated as recovery (%) of the a-LA and b-LG (A1B) proteins added to a commercial powdered soybean milk elaborated with bovine whey proteins a Protein. Sample. Cs b. Cp c. Cx d. Ct (Cp 1Cx )e. Ct,. f. a-LA. Powdered soybean milk containing 0.486 mg a-LA / 100 g sample (determined by the CE method). 27.818 27.716 27.701. 0.136 0.136 0.136. 0.046 0.106 0.168. 0.182 0.242 0.304. 0.188 0.251 0.318. exp. Mean value (RSD, %) b-LG (A1B). 103 104 105 104 (0.54). Powdered soybean milk containing 0.545 mg b-LG (A1B) / 100 g sample (determined by the CE method). 43.481 43.477 43.473. 0.235 0.235 0.235. 0.103 0.197 0.283. 0.338 0.432 0.518. Mean value (RSD, %) a. Recovery (%). Experimental conditions as in Fig. 2. b Concentration of the sample solution as is basis (mg / g sol.). c Concentration of protein in the sample solution (mg / g sol.). d Concentration of protein standard added to the solution of the sample (mg / g sol.). e Total concentration of protein in the sample solution (mg / g sol.) calculated as the addition of Cp and Cx . f Total concentration of protein in the sample solution (mg / g sol.) determined by the CE method.. 0.344 0.436 0.551. 102 101 106 103 (2.92).
(9) ´ et al. / J. Chromatogr. A 859 (1999) 77 – 86 C. Garcıa-Ruiz. bovine protein. Table 3 shows that mean recoveries of 104% for a-LA and close to 103% for b-LG (A1B) were obtained. The concentration of a-LA found in the powdered soybean milk by direct injection of a solution of the powdered soybean milk was 0.48660.014 (mg / 100 g sample). The concentration determined for b-LG (A1B) in this soybean milk was 0.54560.015 (mg / 100 g sample) and was obtained by direct injection of the whey obtained after acid precipitation of a solution of the powdered soybean milk. The injection of the whey also enabled determination of a-LA concentration in the commercial sample analyzed by measuring the area of the peak obtained in the injection of the whey and by interpolating this value of area in the corresponding calibration plot. The result obtained in this case for the content of a-LA in the powdered soybean milk studied was 0.50460.019 mg / 100 g sample. There were no significant differences, in statistical terms, between this result and that obtained by direct injection of a solution of the powdered soybean milk (t-test, P, 0.05) showing that the CE method optimized enables to determine simultaneously the bovine whey proteins present in a soybean dairy-like product by injecting directly the whey obtained after acid precipitation of a solution of this product. The application of statistical tests (t-test, P,0.05) [19] indicated that b-LG (A1B) content in the soybean milk obtained by the CE method was statistically similar to those obtained by other HPLC methods such as conventional RP-HPLC [14] (0.2860.30) (mg / 100 g sample) and perfusion RPHPLC [15] (0.45360.114) (mg / 100 g sample) when the same milk was analyzed. Nevertheless, in determining the a-LA content, differences statistically significant were found (t-test, P,0.05) between the results obtained by CE and by HPLC, although the result by the CE method was close to those determined by conventional RP-HPLC (0.3860.02) (mg / 100 g sample) or perfusion RP-HPLC (0.35560.015) (mg / 100 g sample).. 4. Conclusions CE has proved to be useful in detecting bovine whey proteins in soybean dairy-like products. Since. 85. these products are used to substitute dairy products in case of allergies to animal whey proteins, the possibility of detecting bovine whey proteins in soybean dairy-like products has a great interest from the quality control perspective. Quantitation of bovine whey proteins in a powdered soybean milk elaborated with bovine whey in its formulation can be performed using the calibration method of the external standard. Direct injection of a sample solution enabled determination of a-LA while the quantitation of b-LG (A1B) required acid precipitation of the solution of the powdered soybean milk to concentrate this protein. From the injection of the whey obtained after acid precipitation of the sample solution not only b-LG (A1B) was determined but also a-LA can be quantitated in the whey. Therefore, the CE method developed enables the simultaneous quantitation of two bovine whey proteins in the whey obtained upon acid precipitation of the powdered soybean milk solutions (analysis time close to 12 min). Detection limits obtained were 14 mg / g sol. for a-LA and 52 mg / g sol. for b-LG (A1B) which represent protein concentrations about 60 mg / 100 g sample for a-LA and 100 mg / 100 g sample for b-LG (A1B).. Acknowledgements The authors thank the University of Alcala´ de Henares (project E002 / 98) and the Comunidad ´ Autonoma de Madrid (projects COR 0035 / 94 and 06G / 047 / 96) for financial support. They also thank C. Marina for linguistic assistance.. References [1] Soy Protein Products – Characteristics, Nutritional Aspects and Utilization, Soy Protein Council, Washington, DC, 1987. ´ M. Torre, M.L. Marina, F. Laborda, CRC Crit. [2] M.C. Garcıa, Rev. Food Sci. Nutr. 37 (1997) 361. ´ M. Torre, F. Laborda, M.L. Marina, J. Chroma[3] M.C. Garcıa, togr. A 758 (1997) 75. ´ M. Torre, M.L. Marina, J. Chromatogr. Sci. 36 [4] M.C. Garcıa, (1998) 527. [5] B.D. Oomah, H. Voldeng, J.A. Fregeau-Reid, Plant Foods Hum. Nutr. 45 (1994) 251. [6] R.E. Peterson, W.J. Wolf, Cereal Chem. 69 (1992) 101..
(10) 86. ´ et al. / J. Chromatogr. A 859 (1999) 77 – 86 C. Garcıa-Ruiz. [7] R.E. Buehler, T.T. VanToai, M.B. McDonald Jr., Seed Sci. Technol. 17 (1989) 193. [8] R.J. Pearce, Aust. J. Dairy Technol. 38 (1983) 114. [9] P. Resmini, L. Pellegrino, R. Andreini, F. Prati, Sci. Tec. Latt.-Cas. 40 (1989) 7. [10] M. de Frutos, A. Cifuentes, L. Amigo, M. Ramos, J.C. Diez-Masa, Z. Lebensm. Unters. Forsch. 195 (1992) 326. ´ [11] M. Torre, M.E. Cohen, N. Corzo, M.A. Rodrıguez, J.C. Diez-Masa, J. Chromatogr. A 729 (1996) 99. [12] M. Kanning, M. Casella, C. Olieman, LC?GC Int. 6 (1993) 701. ´ ´ M. Torre, M.L. Marina, [13] C. Garcıa-Ruiz, M.C. Garcıa, Electrophoresis 20 (1999) 2003. ´ M.L. Marina, M. Torre, Anal. Chem. 69 (1997) [14] M.C. Garcıa, 2217.. ´ M.L. Marina, M. Torre, J. Chromatogr. A 822 [15] M.C. Garcıa, (1998) 225. [16] Introduction to Capillary Electrophoresis of Proteins and Peptides, Beckman Instruments, Fullerton, CA, 1991. [17] E. Szoko, Electrophoresis 18 (1997) 74. [18] International Dairy Federation, Questionnaire 3293 / E, October 1993. ´ ´ ´ [19] J.C. Miller, J.N. Miller, in: Estadıstica para Quımica Analıtica, 2nd ed., Addison-Wesley, 1993, pp. 40–63. [20] R.P. Oda, J.P. Landers, in: J.P. Landers (Ed.), Handbook of Capillary Electrophoresis, CRC Press, Boca Raton, FL, 1993, p. 10. [21] H. Nishi, M. Matsuo, J. Liq. Chromatogr. 14 (1991) 973..
(11)
Figure
Documento similar
