WestminsterResearch
http://www.wmin.ac.uk/westminsterresearch
Evaluating business models for e-books through usage data
analysis: a case study from the University of Westminster
Anna Grigson
Information Systems and Library Services
This is an electronic author-formatted version of an article to be published in The Journal of Electronic Resources Librarianship, 21(1), 2009.
The Journal of Electronic Resources Librarianship is available online at:
http://www.informaworld.com/smpp/title~content=t792303957~db=jour
The WestminsterResearch online digital archive at the University of Westminster aims to make the research output of the University available to a wider audience. Copyright and Moral Rights remain with the authors and/or copyright owners.
Users are permitted to download and/or print one copy for non-commercial private study or research. Further distribution and any use of material from within this archive for profit-making enterprises or for commercial gain is strictly forbidden.
Whilst further distribution of specific materials from within this archive is forbidden, you may freely distribute the URL of WestminsterResearch.
(http://www.wmin.ac.uk/westminsterresearch).
Evaluating business models for e-books through usage data analysis:
a case study from the University of Westminster
by Anna Grigson
This is the author’s final version of an article to be published in The Journal of Electronic Resources Librarianship, 21(1), 2009
© Taylor & Francis www.informaworld.com
Abstract
As part of a review of e-book suppliers, usage data were analysed to determine which of the business models on offer gave best value for money. Two analyses were carried out. The first compared a range of subscription options from a single supplier, and the second compared business models from two different suppliers.
Keywords
E-books, business models, usage data Author details
Anna Grigson BA MA MCLIP
Assistant Digital Resources Librarian, University of Westminster
Cavendish Campus Library, 115 New Cavendish Street, London W1W 6UW [email protected]
Introduction
The University of Westminster began building e-book collections in 2004. As our collections have grown we have collected and analysed vendors’ usage reports, using the results both to monitor the level of use of the collections and to calculate basic cost-per-use metrics which have informed decisions on whether to renew or cancel particular resources.
In summer 2008 we sought to extend the application of usage data by using it to compare the value for money offered by different e-book business models. This article reports on two of these analyses: the first comparing a range of options from a single supplier, and the second comparing business models from two different suppliers. Although both analyses focussed on e-books, each required a different approach to reflect the differences in business models. E-book business models
There is a wide range of e-book business models, each consisting of different combinations of elements. Some of these elements are similar to well-established business models for
unlimited simultaneous users, e-book business models often limit access, some by placing a limit on the number of simultaneous users and others by limiting the annual usage of a title. Most of the elements have a direct relationship to cost. For example increasing the number of simultaneous users generally increases costs, and purchasing a title is usually more expensive than taking an annual subscription. But determining the relationship of cost to value is not always so straightforward. Increasing the number of simultaneous users may represent better value if more users can access the books at times of peak demand, and purchasing a title may provide better value if the title will be used for many years.
Given the potential number of variables between different e-book business models it is rarely possible to make like-for-like comparisons between models, therefore value cannot be
assessed solely by comparing costs. Determining the best value business model must
therefore consider both costs and the extent to which the different elements of each business model will fit with the pattern of use of e-book collections.
In undertaking the review of our e-book acquisitions we already knew the costs associated with each business model. Our task was to analyse the usage statistics for our existing collections to see if they provided evidence of patterns of use which could help us decide which business model would offer us best value.
Previous research
In recent years there have been a number of studies analysing usage statistics for e-book collections, and although few have looked specifically at analysis relating to business models, some have looked at patterns of use which could inform the choice between different models. A number of studies have investigated the spread of usage across titles in e-book collections (Christianson & Aucoin 2005a, Christianson 2005b, Dillon 2001, Nicholas 2007). In all cases the results showed a similar pattern, with most usage concentrated in a few high-use titles and the majority of titles having low or zero use. Christianson (2005b) noted that whilst at first sight this would appear to represent poor value for money, a pattern of low use is not necessarily negative as it shows the value of providing a wide range of titles as well as providing in-demand titles that achieve high usage.
However a high percentage of low-use titles is not only a feature of packages provided by vendors. Saffley (2006) found that the same pattern was observed in both collections selected by suppliers, and those selected by librarians. Comparing the use of a librarian-selected
collection (NetLibrary) with a vendor-selected collection (ebrary), she found that there was no significant difference in the percentage of titles used in each collection, concluding that "the importance of librarian selection ... is questionable" (p453).
Some studies have also looked at patterns of usage over time. Christianson and Aucoin (2005a), Cox (2004), and Nicholas (2007) observed that e-books showed a similar pattern to print, with usage concentrated into term time and producing a pattern of peaks and troughs over the academic year. For business models with a simultaneous user limit, such peaks in usage can result in demand exceeding the level of permitted access. Dillon (2001) noted that although turnaways reports could help to establish the level of unsatisfied demand at a particular point in time, they could not necessarily show whether this demand was short-term or ongoing.
Identifying patterns of use can help establish expectations and benchmarks for evaluating collections (Christianson & Aucoin, 2005a), and it can also guide future acquisitions choices. Ongoing usage of older titles may favour a lifetime purchase over an annual subscription, whereas a pattern of peaks and troughs of usage may mean that a model with an annual usage limit may be more suitable than one with a simultaneous user limit. And as Christianson suggested (2005b), if analysis revealed a large number of low-use titles, one possible response would be to move to a demand-driven business model where a title would be purchased only if a user expressed an interest.
However as most studies noted, any collection management decisions taken on the basis of usage analysis alone must take account of the various limitations of the available data. Firstly, it is often difficult to compare data provided by different suppliers. Different measures are used by different vendors, and although the development of a COUNTER code for e-books (Project COUNTER 2006, Walker 2007) has helped to standardise measures, not all e-book vendors are yet COUNTER-compliant. As Cox (2008) notes, these differences are often related to the different business model used by the supplier, making it especially difficult to compare usage between vendors using different models.
Secondly, the conclusions that can be drawn from analysis of vendors’ usage data are limited. Christianson & Aucoin (2005a), Dillon (2001) and Saffley (2006) all note that although vendors’ usage data can show which books are being accessed, they cannot shed light on who is accessing the books, whether they are read, and whether they are useful to their readers. Furthermore, as Blecic noted (2007), the rapid changes in e-resource technology are making interpretation of even basic usage metrics more complex. For example, including an e-book collection in a federated search engine can lead to a significant increase in the number of searches reported, but this may not represent increased use of the resource by library users. A better understanding of the patterns of e-book usage therefore requires a richer set of quantitative data than is available from current vendor reports. The SuperBook project
(Nicholas 2007) and the ongoing JISC National E-book Observatory project (JISC 2008) have used techniques of ‘deep-log analysis’ to gather a greater range of usage data, giving
quantitative information not just on usage but also on users and their information-seeking behaviour. Set alongside quantitative and qualitative information gathered from several major surveys of e-books users (Jamali 2009, Nicholas 2008b, ebrary 2007), the results of these studies will potentially enhance our understanding of patterns of e-book usage, and help to inform decisions on choice of business models.
Reviewing e-book acquisitions at the University of Westminster
The University of Westminster has over 22,000 students (75% undergraduates), 800 full-time teaching staff and over 800 part-time visiting lecturers. Teaching and research covers a wide range of subjects with a particular focus on business, media, health and computing. The University has four campuses across London with a library at each campus. Print holdings include around half a million print books and 1,200 print journal subscriptions. Online resources include over 13,000 e-journal subscriptions, numerous databases and multimedia resources, and a steadily-growing collection of over 10,000 e-books from a number of suppliers.
We have acquired books under two different types of business models. The majority of e-book titles were acquired through subscriptions to packages, including e-e-book only
However in reviewing our e-book suppliers we were not seeking to compare the relative value of subscriptions versus purchases, or collections versus individual titles. We were satisfied with our choice of different models for different types of content, using subscription-based models for reference and computing books with a short lifespan, and purchase-based models for reading list items with ongoing value.
Instead, we sought to compare the value for money offered by different examples of the same general type of business model, first comparing a range of subscription options with each other, and then comparing two different purchase-based models. But with only limited time and resources available we needed a quick, basic analysis which did not require specialist statistical knowledge or software. The source of usage data was limited to usage reports provided by the vendors, since these reports were both readily available and relatively straightforward to analyse.
Evaluating renewal options for an e-book subscription
Our first analysis compared a range of renewal options from the supplier of one of our e-book packages. Supplier A provided us with a vendor-selected package of reference e-books, paid for by annual subscription. The collection changed slightly each month, with new editions replacing older ones and new titles being added, and our collection had grown from an initial 160 titles in October 2005 to 279 titles by March 2008.
We faced a choice of three renewal options – we could continue our subscription to the full collection, or we could reduce the cost of our subscription by switching to a smaller collection of either 100 or 150 titles of our choosing.
By analysing the usage data for our existing collection we hoped to find out how many titles in the collection were being used, and whether we could reduce the number of titles in the collection without adversely affecting access to useful content. Having identified the number of titles required, we could then ask library staff to select the required number of titles from our existing collection. But selection by library staff would be time-consuming, and could offset any saving on subscription costs with an increase in administration costs. Furthermore, as Saffley observed (2006), selection by library staff was not necessarily a reliable guide to which titles would prove most valuable. Therefore we wanted to test whether usage analysis could offer a more evidence-based approach to selection, by finding out whether analysis of usage data could identify not only how many titles we needed but also which titles we should retain.
The vendor’s usage statistics provided us with monthly COUNTER-compliant reports covering the lifetime of our subscription. Reports of the number of sessions and searches (COUNTER Book Report 6) gave an indication of the level of use of the collection as a whole, and reports of the number of full text accesses per section (COUNTER Book Report 2) gave more detail of the level of use of individual titles. Unusually, the business model offered unlimited usage, so there were no turnaway statistics.
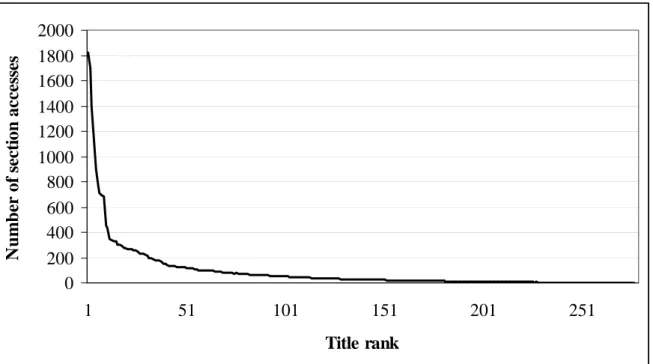
To determine the number of titles we needed to retain, we started with an analysis of the total usage over the lifetime of the collection, ranking all the titles in the collection by the number of full text accesses per title.
0 200 400 600 800 1000 1200 1400 1600 1800 2000
1 51 101 151 201 251
Title rank
N
u
m
b
er
of
s
ec
ti
o
n acc
es
se
s
Figure 1 : Lifetime usage per title, 2005-2008
This result gave us little scope for reducing the size of the collection by simply deselecting zero use titles. If we wished to reduce the size of the collection we would therefore need to cut some titles with usage.
To gauge the impact of a potential cut, our second analysis looked at the proportion of usage that would be covered if we limited our subscription to the top 100 or 150 titles used titles. Again we ranked all titles by decreasing usage, but to avoid penalising titles which had low use because they had only recently been added to the collection we ranked them by average monthly use rather than by total lifetime use. We then added the total number of accesses generated by the 100 and 150 top-ranked titles, and compared this to the total usage of all titles. Again in line with previous studies, we found that most of the usage was covered by the top 100 to 150 titles – the top 20 titles covered 80% of total use, the top 100 titles covered 95% of use, and the top 150 titles covered 98% of use.
This analysis gave a clear indication that the majority of demand could be met by a reduced collection, but it did not necessarily identify which titles we should keep. The lists of the top 100 or 150 titles differed according to whether we ranked titles by lifetime usage or by average monthly usage. And although both lists identified a list of the top 20-30 titles which had significantly higher usage than other titles, neither list had clear cut off-point near the 100 or 150 title mark. If we selected titles based solely on their position in the ranked lists there would have been only a marginal difference in usage between those that made the cut and those that did not.
Therefore as well as looking at the level of use of each title, we sought an alternative metric which could offer a way to distinguish between a large number of low-use titles. As this was a collection of general reference e-books intended to be of ongoing value to a wide range of users, titles with regular repeat usage could be viewed as more valuable to the collection than titles used on just a few occasions. Therefore we decided to investigate the distribution and frequency of use of individual titles by analysing the number of separate occasions on which each title had been accessed.
However, determining frequency of use based solely on vendor statistics was not
not show who had used it, so a report of five accesses could represent five accesses by one user, or five users each accessing the title once. Because COUNTER Book Report 2 reports access per section rather than per title this effect is exaggerated – a report of five uses could represent a single reader accessing five sections in a single session, whereas a book used less extensively by several readers on different occasions may report a lower number of accesses. With this limitation, it was not possible to tell whether usage reported within a single monthly report represented one-off or repeat usage of a title. However where usage occurred in more than one monthly report we could be sure that a title had been used on different occasions, although we still had no information on the number of different users. Therefore the best measure of frequency of use which we could obtain was to count the number of months in which a title had showed usage and then divide this figure by the number of months it had been part of the collection, giving a simple ratio of how frequently a title had been used. Unlike the analysis of usage, this metric showed a more even distribution with 152 titles (54%) showing usage for fewer than half their months in the collection, and 127 titles (46%) showing usage in half or more.
On its own frequency of use was not an adequate measure of value, since it did not distinguish between high and low use titles. But we were keen to find out whether a combination of the usage and frequency analysis could provide us with a meaningful metric, by distinguishing between those titles which had low use occurring on a limited number of occasions, and those which had low but regular use.
Therefore for our final analysis we combined the usage and frequency metrics to generate a list of titles with both low usage and a low frequency of use. We ran the same analysis several times, setting different thresholds for average monthly use and for frequency of use, and reviewing the number of titles in the resulting list. We found that an average monthly usage of less than two and a frequency of use ratio of less than half resulted in a list of 114 titles, close to the number of titles we would need to cut if we wished to reduce our collection to 150 titles. However, the difference in usage between titles that would be selected or deselected on the basis of this report remained marginal. There was still no clear distinction between the range of low usage titles, and we did not feel that the report was sufficiently reliable to use as the sole basis of a decision on title selection.
Our analysis of usage data for Supplier A succeeded in its principal aim, and clearly indicated that we could reduce the number of titles in our collection and still cover the majority of usage. But with so many titles falling within a narrow band of low usage, analysis of vendor data alone could not identify a clear pattern of use which would show which titles we should retain and which we should cut. So while the usage data could undoubtedly inform selection decisions by library staff, usage analysis alone could not provide sufficient evidence for title selection.
Evaluating two models for the purchase of individual e-books
Our second analysis compared two business models for the purchase of individual e-books. Our existing collection of 720 titles had been purchased from an aggregator (Supplier B) and we wanted to compare this with a different business model offered by an alternative
aggregator (Supplier C) to see which offered better value.
of 400 per year. If the limit was reached the book would become unavailable and all users would be turned away for the remainder of the year.
Under both models, we could monitor which e-books reached their user or usage limit and increase access by purchasing additional copies of popular titles. For Supplier B, turnaway reports enabled us to see which titles had exceeded the simultaneous user limit and respond by ordering additional copies where necessary, although there was always a chance that the demand for a title would have dropped by the time an additional copy was made available. For Supplier C, usage reports showed which titles were approaching their annual usage limit, giving us the opportunity to decide whether or not to purchase additional copies before any loss of access occurred. However if we decided not to purchase an additional copy we could lose access for long periods of time and would therefore need to consider temporarily
removing the catalogue record for the item, or indicating that it was unavailable until a certain date.
The two different business models therefore favoured different patterns of usage. Supplier B’s model offered year-round access regardless of the total level of use, but could result in
turnaways at times of peak usage. It therefore favoured titles where usage was evenly spread throughout the year, without large peaks in usage. By contrast, Supplier C’s model offered a solution which could provide access even at times of peak demand, but did not guarantee year-round access.
So to assess which model offered better value, we needed to evaluate the pattern of use of our existing collection of e-books from Supplier B, and compare how this would have fitted Supplier C’s business model. To achieve this we needed to analyse:
• The level of use of individual titles, to determine whether any titles showed demand for more than 400 uses per year which would generate turnaways under Supplier C’s model.
• The distribution of use over the academic year, to determine whether any titles had exceeded the simultaneous user limit of Supplier B’s model.
For Supplier B’s collection we had monthly reports of accesses per title, and turnaways per title. The data was not COUNTER-compliant so we could not be sure that the measurement of ‘access per title’ would match that used by Supplier C, but for purposes of our analysis it was considered a sufficient equivalent.
However as Cox (2008) notes, access statistics can only measure the access permitted by a particular business model. In this case access figures would not count any potential usage which had been denied by the limit on simultaneous users, meaning the reported accesses could be lower than real demand. To account for this we added the turnaway and access figures to give a "total access requests" figure for each title. However this assumed that one turnaway was equivalent to one successful access, although in practice this is not likely to be the case since one user may generate multiple turnaways if they make repeated attempts to access a title until they finally succeed. The total access requests figure was therefore likely to be an overestimate of actual demand but on balance we preferred to overestimate rather than underestimate demand.
Number of titles with / without turnaways
2004-2005 2005-2006 2006-2007 2007-2008
Number of access
requests per year With turnaw
ays
No turnaways With turnaw
ays
No turnaways With turnaw
ays
No turnaways With turnaw
ays
No turnaways
0 67 128 66 50
1-9 3 78 10 154 8 247 1 375
10-49 18 52 16 52 30 183 19 235
50-99 6 0 2 1 7 13 13 17
100-199 1 0 3 0 4 1 3 1
200-299 1 0 0 0 0 0 2 0
300-399 0 0 0 0 0 0 2 0
400+ 0 0 0 0 1 0 2 0
29 197 31 335 50 510 42 678
Number of titles with / without turnaways
13% 87% 9% 91% 9% 81% 6% 94%
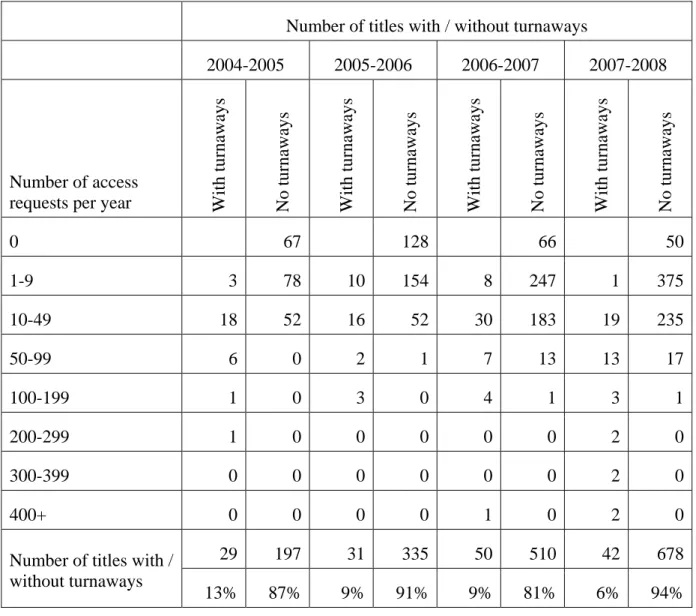
Table 1 : Number of titles showing turnaways per year
The results showed that the majority of our titles had less than 400 access requests per year and showed no turnaways. These titles had usage which was low enough and sufficiently well distributed over the course of the year that they reached neither Supplier C’s annual usage limit nor Supplier B’s simultaneous user limit. A single copy of each book was sufficient to meet demand under either business model, and either model offered equal value for money (provided the cost of the book was the same from each supplier).
At the other end of the usage scale there were only three occasions where a title exceeded Supplier C’s annual usage limit of 400 hits, and in all three cases the titles also showed turnaways. For these few high usage titles either business model would require purchase of additional copies to meet demand.
In between these two ends of the scale, there were between 30 - 50 titles each year which had less than 400 access requests per year but still showed turnaways. In most cases, the number of access requests was well below 400, and in some cases even titles with fewer than 10 requests per year generated turnaways.
Few titles showed a more even distribution of high use. Indeed in four years, there were only two occasions where a title recorded more than 100 annual access requests without also showing turnaways, and that was a title for which we had purchased two additional copies in response to previous turnaway reports. In total we needed to purchase an additional copy of 11 popular titles from Supplier B in order to meet peak demands for access, and in three cases we needed a third copy. Under Supplier C’s business model we would have required just two additional copies.
Given this pattern of usage, Supplier C’s annual usage model offered better value, since it could accommodate the pattern of peaks and troughs in usage without limiting access. For this analysis we simply counted the number of titles with turnaways, and did not count the number of turnaways per title, so it is possible that for some titles the number of turnaways was very low and therefore did not represent a significant barrier to access. Nevertheless, even low turnaways could discourage use and therefore a business model which would avoid virtually all turnaways remained the best value option.
Conclusions and discussion
As a study to evaluate business models these two analyses met our primary objectives, and in both cases the results identified a pattern of use which determined the best value business model from the options on offer. The comparison of Suppliers B and C demonstrated that a business based on an annual usage limit rather than a simultaneous user limit would offer better value given the current patterns of usage of our collection. The analysis of Supplier A’s data showed that we could reduce the size of the collection without having a significant effect on access to content, although it was less successful in identifying which titles we should drop from the collection.
These were small-scale, local studies designed to answer specific questions about particular collections, and as such the level of detail was limited to that necessary to answer the questions in hand. There is scope for further analysis of the data which could give a more detailed picture of the patterns of use of our collections. For example, the comparison of Supplier B and C analysed access only at annual level, and further analysis of the number of access requests per title at monthly level would reveal more detail of the peaks and troughs in usage over the course of the academic year. More detailed information on the level of year-round demand for popular titles would enable us to assess the impact of potential prolonged loss of access under an annual usage model, and to judge whether purchasing additional copies to guarantee year-round access represented value-for-money.
However, care needs to be taken when using historic usage data as the basis for decision-making, since we cannot assume that current patterns of use will continue. For example, the analysis of Supplier B’s collection revealed that the average use per title had increased over four years. With increasing usage we might expect to see more turnaways, but it was notable that although the number of titles showing turnaways increased, it did not increase in
proportion to the growth in the number of titles in the collection. This may relate to changes in the nature of our collections, which now include more general background reading alongside in-demand reading list titles. The proportion of low use titles in the collection is therefore growing, and as e-books continue to become a more mainstream part of our collections, we may see this trend continue.
As Nicholas (2007) notes, the current situation is volatile and it may take time for patterns of use to settle. Both the nature of e-books and the information-seeking behaviour of users are changing (Soules 2009, Nicholas 2008a), and it is likely that new business models will emerge as a result. Continuing analysis of usage data at both local and national level will be needed if we are to understand how our e-book collections are being used, and ensure both that we are acquiring the e-books our users need, and that our choice of business model represents the best possible value for money.
References
Blecic, D.D., Fiscella, J.B., and Wiberley Jr., S.E. (2007). Measurement of Use of Electronic Resources : Advances in Use Statistics and Innovations in Resource Functionality. College & Research Libraries, 68(1), pp.26-44
Christianson, M. and Aucoin, M. (2005a). Electronic or print books: Which are used? Library Collections, Acquisitions, & Technical Services 29(1), pp.71-81.
Christianson, M. (2005b). Patterns of use of electronic books. Library Collections, Acquisitions, & Technical Services 29(4), pp.351-363.
Cox, J. (2004). E-books: Challenges and Opportunities. D-Lib 10:10, www.dlib.org/dlib/october04/cox/10cox.html -- Retrieved 27 January 2009.
Cox, J. (2009). Making Sense of E-book Usage Data. The Acquisitions Librarian, 19:3-4, pp.193-212
Dillon, D. (2001). E-books: the University of Texas experience, part 1. Library Hi Tech 19(2), pp.113-124.
ebrary (2007). Global Faculty E-book Survey Sponsored by ebrary –
www.ebrary.com/corp/collateral/en/Survey/ebrary_faculty_survey_2007.pdf. Retrieved 27 January 2008
Jamali, H.R., Nicholas, D., and Rowlands, I. (2009). Scholarly e-books: the views of 16,000 academics: Results from the JISC National E-Book Observatory. Aslib Proceedings: New Information Perspectives 61:1, pp. 33-47
JISC National E-books Observatory project (2008). www.jiscebooksproject.org/ – Retrieved 27 January 2009.
Nicholas, D., Huntingdon, P., and Rowlands, I. (2007). E-books: how are users responding?
CILIP Update 6:11, pp.29-31.
Nicholas, D. (2008a). The information-seeking behaviour of the virtual scholar: from use to users. Serials 21:2, pp.89-92.
Nicholas, D., Rowlands, I., Clark, D., Huntington, P., Jamali, H.R., and Ollé, C. (2008b). UK scholarly e-book usage: a landmark survey. Aslib Proceedings: New Information Perspectives
60:4, pp.311-334
Project COUNTER (2006). COUNTER Code of Practice for Books and Reference Works
www.projectcounter.org/ – Retrieved 27 January 2009.
Saffley, E. (2006). Demand for E-books in an Academic Library. Journal of Library Administration 45(3/4), pp.445-457.