Annals of Hepatology 7(4) 2008: 350-357
350
www.medigraphic.com
Annals of Hepatology 2008; 7(4): October-December: 350-357
Annals of Hepatology
Original Article
AST to platelet ratio index (APRI)
for the noninvasive evaluation of liver fibrosis
Aurora Loaeza-del-Castillo;1 Francisco Paz-Pineda;1 Edgar Oviedo-Cárdenas;2 Francisco Sánchez-Ávila;1 Florencia Vargas-Vorácková1
1Departments of Gastroenterology. 2Department of Pathology.
Instituto Nacional de Ciencias Médicas y Nutrición Salvador Zubirán, Mexico City, Mexico.
Abbreviations:
APRI, aspartate aminotransferase to platelet ratio index CHC, chronic hepatitis C
NAFLD, nonalcoholic fatty liver disease AIH, autoimmune hepatitis
ROC, receiver operating characteristic AUC, area under de curve
PLR, positive likelihood ratio
Address for correspondence: Florencia Vargas-Vorácková Department of Gastroenterology
Instituto Nacional de Ciencias Médicas y Nutrición Salvador Zubirán, Vasco de Quiroga 15, Colonia Sección XVI, Delegación Tlalpan, Mexico City
14000, Mexico
Telephone +52-55-5573-3418 Fax +52-55-5655-0942 E-mail: [email protected]
Manuscript received and accepted: 13 May and 20 August 2008 Abstract
Liver biopsy is the recognized gold standard for liver fibrosis staging. The aspartate aminotransferase to platelet ratio index (APRI) has been proposed as a noninvasive and readily available tool for the assess-ment of liver fibrosis in chronic hepatitis C (CHC). This study aimed to validate, in a Mexican tertiary health care setting, the diagnostic usefulness of APRI in CHC, nonalcoholic fatty liver disease (NAFLD) and autoimmune hepatitis (AIH). In an observational, cross-sectional, comparative and retrolective fashion, consecutive patients with CHC, NAFLD or AIH were evaluated. Fibrosis was staged using the METAVIR scale. Receiver operating characteristic ROC curves were constructed for significant fibrosis, advanced fi-brosis and cirrhosis. One-hundred-sixty-four CHC, 30 NAFLD and 42 AIH patients were evaluated. For the diagnosis of significant fibrosis, APRI values delimit-ed an area under de ROC curve (AUC) of 0.776 in
CHC, 0.564 in NAFLD, and 0.602 in AIH patients. For advanced fibrosis, the AUCs were 0.803, 0.568 and 0.532 in CHC, NAFLD and AIH patients, respectively. For cirrhosis, AUCs were 0.830 and 0.599 in CHC and AIH patients. In conclusion, APRI can be a useful noninvasive alternative for the diagnosis of signifi-cant fibrosis and cirrhosis in our CHC patients. APRI values of ≤≤≤≤≤ 0.3 and ≤≤≤≤≤ 0.5 rule out significant fibrosis and cirrhosis, and a value of ≥≥≥≥≥ 1.5 rules in significant fibrosis. In patients with NAFLD, APRI values tend to increase with the degree of fibrosis, suggesting that it could be useful in this disease. APRI appears to be of no value in patients with AIH.
Key words: Fibrosis staging, chronic hepatitis C, non-alcoholic fatty liver disease, autoimmune hepatitis.
Introduction
Liver fibrosis is the result of a chronic injury induced by a variety of causes. Bridging fibrosis and regeneration nodes are the clearest manifestation of this injury, being cirrhosis the end stage of this process. In cirrhosis, the molecular composition of fibrotic tissue is unique, irre-spective of the etiology.1,2
Liver function decreases as extracellular matrix de-posits in the subendothelial space. Despite the presence of cirrhosis, up to 40% of patients remain asymptomatic for years. In these cases, liver biopsy is the most reliable means for diagnosis.3
Evaluation of liver fibrosis in chronic liver disease has a dual purpose, treatment and prognosis. At the bedside, it allows assessment of therapeutic interventions and fol-low-up of fibrosis progression. In chronic hepatitis C (CHC) patients, the stage of liver fibrosis is a predictor of response to interferon-based treatments. It is known that the presence of advanced fibrosis is a predictor of non-re-sponse.1 Hepatitis C virus (HCV) infection evolves to
chronicity in 50-85% of cases, with the development of liver fibrosis, cirrhosis and its complications.
To date, a variety of means are available for the stag-ing of liver fibrosis. This stagstag-ing is cross-sectional, and does not reflect the dynamics of the liver fibrosis pro-cess. Among these means, liver biopsy is the gold
stan-Artemisa
A Loaeza-del-Castillo et al. AST to platelet ratio index (APRI) for the noninvasive evaluation of liver fibrosis
www.medigraphic.com
dard. This procedure is invasive, and has known adverse events and limitations. In most cases, it is performed blindly by means of a percutaneous puncture, resulting in a small tissue sample that hardly represents the liver (approximately 1/50,000th). This frequently leads to
mis-classification of liver fibrosis which involves, at least, one stage.4 Intra- and inter-observer variability
contrib-utes to this misclassification with a 10 to 20%, depend-ing on the scordepend-ing system used.5 The most frequent
com-plications of percutaneous liver biopsy are pain and bleeding, death occurs in 1/10,000 to 1/12,000 proce-dures.6,7
For noninvasive, but indirect evaluation of liver fi-brosis, positron emission tomography, ultrasound and magnetic resonance imaging have shown to be promis-ing.8 A novel method, the elastography (FibroScan), has
shown to be useful for the evaluation of liver fibrosis in CHC patients.9,10 However, high costs have limited a
broad use of this technology.
Other noninvasive methods, such as serum markers have been proposed. Among them are enzymes that regu-late extracellular matrix synthesis or degradation, and ex-tracellular matrix degradation products. None of these markers has shown to be liver specific, sensible enough to diagnose different fibrosis stages, or easy to perform to justify routine clinical use.
Combination of serum markers lead to the develop-ment of indexes such as the Fibrotest, which includes α2
-macroglobulin, α2-globulin (haptoglobin), γ
-glutamil-transpeptidase, γ-globulin, total bilirubin and apolipo-protein A1.4,11 This index, controlled for age and sex, has
shown good correlation with the stage of liver fibrosis in CHC patients. However, the complex and costly analysis of most of its components limits its use in our country and, probably, in other developing environments.
Recently, an index comprising routinely available laboratory tests was developed for the assessment of liver fibrosis in CHC patients, namely the aspartate ami-notransferase to platelet ratio index (APRI).12 For
bridg-ing fibrosis and cirrhosis, the proposed APRI cutoff val-ues are > 1.5 and > 2, respectively, with areas under the receiver operating curve (ROC) of 0.80 and 0.89.
A noninvasive diagnostic test for liver fibrosis should be simple, available, inexpensive and accurate. All these characteristics are fulfilled by the APRI. Therefore, we aimed to validate the APRI usefulness for the diagnosis of different stages of liver fibrosis in CHC in our own set-ting. Given that fibrosis and cirrhosis are not exclusive to CHC, our validation was extended to nonalcoholic fat-ty liver disease (NAFLD), as well as to autoimmune hepa-titis (AIH).
Material and methods
Observational, cross-sectional, comparative and ret-rolective study. Charts of patients aged ≥ 18 years, with
documented liver disease were reviewed. Presence of liv-er disease was sustained with abnormal sliv-erum transami-nases, GGT, ultrasonography and/or liver biopsy.
Diagnosis of CHC was defined as positive RNA-HCV (quantitative PCR) and/or positive serum anti-HCV. Diagnosis of NAFLD was defined as the presence of at least one feature of the metabolic syndrome, echogenic appearance on ultrasound consistent with steatosis, and a daily consumption of < 50 g of ethanol in males or < 30 g in females. Metabolic syndrome was defined according to the Adult Treatment Panel III (ATP III) criteria, i.e. i) triglycerides ≥ 150 mg/dL or taking medication for hypertriglyceridemia, ii) fasting plasma glucose ≥ 110 mg/dL or taking medication for diabetes,
iii) blood pressure ≥ 140/≥ 90 mmHg or taking medica-tion for hypertension, iv) HDL cholesterol < 35 mg/dL in men or < 39 mg/dL in women, and v) abdominal obe-sity (waist circumference > 102 cm in men or > 88 cm in women).13 AIH was defined as positive anti-nuclear and
anti-smooth muscle antibodies or positive anti-LKM1 antibodies. Clinical diagnosis was sustained in all cases by compatible histological findings in liver biopsies. In our setting, a diagnostically useful liver biopsy requires at least one cm of tissue length, and the presence of at least five portal triads.
All patients had a liver biopsy and a platelet count performed the same day as the biopsy. They also had an AST determination within a month before/after the biop-sy. Patients were excluded if liver biopsy was not useful for fibrosis staging, or if liver injury was due to hepatitis B virus, HIV, cholestasis or other cause of chronic liver inflammation. Patients were also excluded if having my-opathy or thrombocytopenia not related to portal hyper-tension.
All liver biopsies were reviewed by a single patholo-gist (EOC). Fibrosis was staged according to the METAVIR scale, where F0 stands for no fibrosis, F1 for portal fibrosis without septa, F2 for portal fibrosis with rare septa, F3 for numerous septa without cirrhosis, and F4 for cirrhosis.14
The APRI was calculated according to the formula:12
100 (10 / L) Platelet counts
* ULN
level AST
APRI= 9 x
*ULN, AST upper level of normal (or 56 IU/L)
Results are expressed as absolute frequencies (%), means ± standard deviations, and medians (minimum – maximum). A Wilcoxon-type test for trend was used to test the trend of APRI values across fibrosis stages.15
www.medigraphic.com
Receiver operating characteristic (ROC) curves were estimated for CHC, NAFLD and AIH, considering i) sig-nificant fibrosis (METAVIR ≥ 2), ii) advanced fibrosis (METAVIR ≥ 3) and iii) cirrhosis (METAVIR 4). Areas under the ROC curves (AUC) were determined, as well as their 95% confidence intervals (95%CI). The APRI val-ues with both best sensitivity and specificity were con-sidered as the optimal diagnostic threshold or cutoff point. At this thresholds, sensitivity, specificity, predic-tive values, accuracy and posipredic-tive likelihood ratio (PLR), with their respective 95%CI, were determined. PLRs weigh the relationship between two proportions, namely the proportion of a positive test in disease (true positives) and the proportion of a positive test in non-disease (false positives). The higher this ratio, the better the diagnostic performance of the APRI score. A PLR of three is consid-ered clinically significant, and is interpreted as «the probability of a positive test (≥ APRI cutoff value) among the diseased (more fibrosis) is three times the probability of a positive test among the non-diseased (less fibrosis)». Finally, and according to published evi-dence,16 a logistic regression was carried out to explore
sex and age effect on the performance of the APRI score in the diagnosis of cirrhosis in CHC patients.
A P value of < 0.05 was considered as statistically sig-nificant. Stata v7.0 and SPSS v12.0 statistical packages were used.
Results
Two-hundred-thirty-six patients fulfilled de selection criteria, 164 had CHC, 30 NAFLD and 42 AIH.
Demo-graphic and laboratory characteristics of these patients are summarized in Table I.
Significant fibrosis (METAVIR ≥ 2) was observed in 83 (51%) patients with CHC, in 15 (50%) patients with NAFLD, and in 29 (69%) patients with AIH. Advanced
fi-brosis (METAVIR ≥ 3) was observed in 67 (41%)
pa-tients with CHC, in 3 (10%) papa-tients with NAFLD, and in 20 (47%) patients with AIH. Cirrhosis (METAVIR 4) was observed in 47 (29%) CHC and in nine (21.5%) AIH pa-tients. No patient with NAFLD had cirrhosis (Table I).
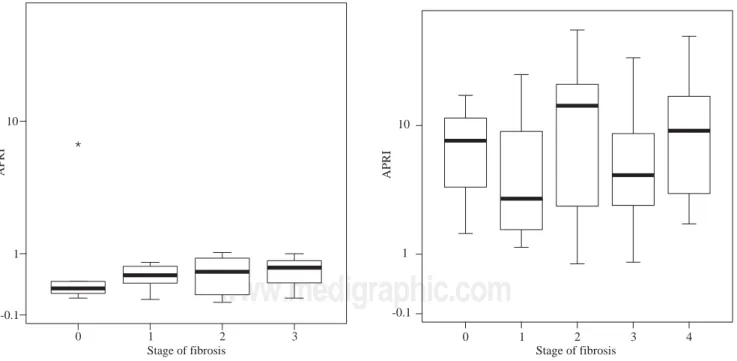
Median APRI values in CHC patients increased ac-cording to fibrosis stage, namely 0.39 for F0, 0.505 for F1, 0.545 for F2, 0.745 for F3, and 1.64 for F4 (P < 0.001,
Figure 1) For the same stages of fibrosis, median APRI values in NAFLD patients increased gradually from 0.28 to 0.515, 0.585 and 0.67.(P < 0.44, Figure 2). In AIH pa-tients median APRI values were 8, 3.175, 13.3, 4.7 and 9.26 for F0, F1, F2, F3 and F4, respectively(P < 0.40, Fig-ure 3). Correlations among APRI values and fibrosis stag-es were 0.564 (P < 0.001) in CHC, 0.140 (P < 0.46) in NAFLD, and 0.134 (P < 0.40) in AIH.
For the diagnosis of significant fibrosis (METAVIR ≥
2) in CHC patients, APRI values delimited an AUC of 0.776 (95%CI 0.704-0.847; P < 0.001), with a threshold of 0.6433. At this threshold, sensitivity was 74.7% (95%CI 64-83.6%), specificity 67.9% (56.6-77.8%), posi-tive predicposi-tive value 70.5% (59.8-79.7%), negaposi-tive pre-dictive value 72.4% (60.9-82%), accuracy 71.3% (63.8-78.1%), and PLR 2.33 (1.66-3.27)(Figure 4). For NAFLD and AIH patients, the AUC was 0.564 (95%CI 0.347-0.782; P < 0.548) and 0.602 (0.418-0.787; P < 0.295), re-spectively.
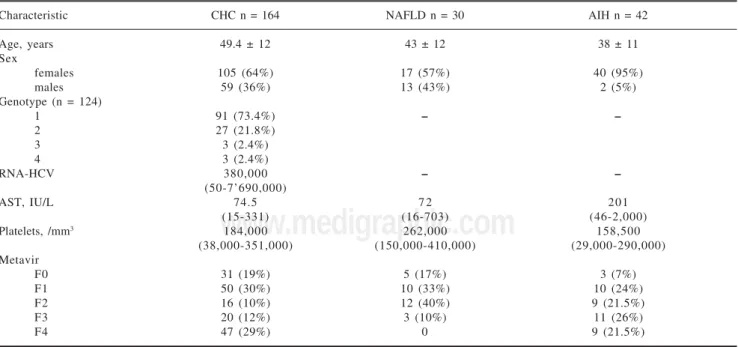
Table I. Distribution of demographic characteristics and laboratory results by diagnosis.
Characteristic CHC n = 164 NAFLD n = 30 AIH n = 42
Age, years 49.4 ± 12 43 ± 12 38 ± 11
Sex
females 105 (64%) 17 (57%) 40 (95%)
males 59 (36%) 13 (43%) 2 (5%)
Genotype (n = 124)
1 91 (73.4%) – –
2 27 (21.8%)
3 3 (2.4%)
4 3 (2.4%)
RNA-HCV 380,000 – –
(50-7’690,000)
AST, IU/L 74.5 7 2 201
(15-331) (16-703) (46-2,000)
Platelets, /mm3 184,000 262,000 158,500
(38,000-351,000) (150,000-410,000) (29,000-290,000)
Metavir
F0 31 (19%) 5 (17%) 3 (7%)
F1 50 (30%) 10 (33%) 10 (24%)
F2 16 (10%) 12 (40%) 9 (21.5%)
F3 20 (12%) 3 (10%) 11 (26%)
F4 47 (29%) 0 9 (21.5%)
CHC, chronic hepatitis C; NAFLD, nonalcoholic fatty liver disease; AIH, autoimmune hepatitis.
A Loaeza-del-Castillo et al. AST to platelet ratio index (APRI) for the noninvasive evaluation of liver fibrosis
www.medigraphic.com
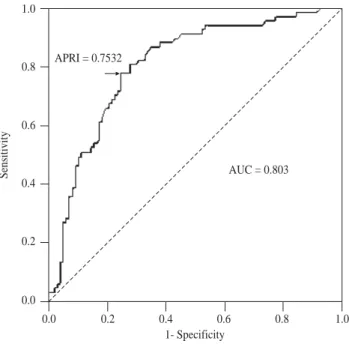
For the diagnosis of advanced fibrosis (METAVIR ≥
3) in CHC patients, APRI values delimited an AUC of 0.803 (95%CI 0.735-0.872; P < 0.001), with a threshold
of 0.7532. At this threshold, sensitivity was 77.6% (95%CI 65.8-86.9%), specificity 75.3% (65.5-83.5%), positive predictive value 68.4% (56.7-78.6%), negative predictive value 83% (73.4-90.1%), accuracy 76.2% (69-82.5%), and PLR 3.14 (2.17-4.54)(Figure 5). For NAFLD and AIH patients, the AUC was 0.568 (95%CI 0.186-0.95; P < 0.704) and 0.532 (0.353-0.711; P < 0.724), re-spectively.
For the diagnosis of cirrhosis (METAVIR 4) in CHC patients, APRI values determined an AUC of 0.830 (95%CI 0.765-0.895; P < 0.001), with a threshold of 0.7532. At this threshold, the sensitivity was 89.4% (95%CI 76.9-96.5%), specificity 70.9% (61.8-79%), pos-itive predictive value 55.3% (43.4-66.7%), negative pre-dictive value 94.3% (87.2-98.1%), accuracy 76.2% (69-82.5%), and PLR 3.08 (2.28-4.15)(Figure 6). For AIH, this area was 0.599 (95%CI 0.398-0.800; P < 0.366).
Discussion
Prognosis and treatment of chronic liver diseases is re-lated to the degree of fibrosis. To evaluate fibrosis, liver biopsy has been the gold standard for many years. How-ever, invasiveness, complications, inter- and intra-ob-server variations, and patient acceptability have limited its use, leading to search for new and noninvasive meth-ods to diagnose liver fibrosis and cirrhosis.
The APRI score correlates significantly to fibrosis stage in patients with CHC.17 It is based on two routine
laboratory tests and is, therefore, a promising tool with
Figure 1. Distribution of APRI values according to fibrosis stage in patients with CHC. Boxplots depict the median (heavy horizon-tal line), the quartiles (lower and upper edges of the box), and the minimum and maximum values (vertical whiskers). Outliers are depicted as «o» and extreme values as «*».
0 1 2 3 4
Stage of fibrosis -0.1
1 10
APRI
Figure 2. Distribution of APRI values according to fibrosis stage in patients with NAFLD. Boxplots depict the median (heavy hori-zontal line), the quartiles (lower and upper edges of the box), and the minimum and maximum values (vertical whiskers). Outliers are depicted as «o» and extreme values as «*».
0 1 2 3
Stage of fibrosis -0.1
1 10
APRI
Figure 3. Distribution of APRI values according to fibrosis stage in patients with AIH. Boxplots depict the median (heavy horizon-tal line), the quartiles (lower and upper edges of the box), and the minimum and maximum values (vertical whiskers). Outliers are depicted as «o» and extreme values as «*».
0 1 2 3 4
Stage of fibrosis -0.1
1 10
www.medigraphic.com
limited expense and widespread availability.16 It is
known that platelet counts decrease and AST levels in-crease with the progression of liver fibrosis. Platelet gen-eration diminishes secondary to a decreased production of thrombopoietin by hepatocytes.18,19 Also, platelets are
sequestered and destructed in the spleen as liver fibrosis advances and portal hypertension develops.20 As to AST,
ongoing liver injury increases its release from mitochon-dria,21 and fibrosis decreases its clearance.22
We here-in evaluated the performance of the APRI score in the diagnosis of fibrosis and cirrhosis in CHC, NAFLD and AIH patients. Its diagnostic usefulness was confirmed in our patients with CHC. In patients with NAFLD, a tendency towards increasing APRI scores across fibrosis stages was observed. APRI scores, howev-er, did not show a pattern in our patients with AIH.
For the diagnosis of significant fibrosis in CHC pa-tients, we obtained an AUC of 0.776. This AUC was very close to the pooled AUC of 0.76 (95%CI 0.74-0.79), re-ported in a recent meta-analysis. In this same meta-analy-sis, sensitivities of 81% (95%CI 76-86%) and 35% (30-41%), and specificities of 50% (47-52%) and 91% (89-92%), were observed at APRI thresholds of 0.5 and 1.5, respectively.16 Our sensitivities (86 and 41%) and
speci-ficities (53 and 90%) at the same thresholds were within the reported 95%CIs and/or similar. The cutoff point showing the best sensitivity (74.7%) and specificity (67.9%) was, in our series, an APRI score of 0.6433, which is close to the 0.5 value recommended by other au-thors.12,16 In terms of PLR, a proxi of the diagnostic odds
ratio (DOR), the APRI score had, for the diagnosis of sig-nificant fibrosis in our CHC patients, a discrimination
power of 2.33, which contrasts with the 5.7 published in the above referred meta-analysis. This notorious differ-ence, can be explained with the somewhat lower sensitiv-ity and higher specificsensitiv-ity of the APRI score in our study, as well as an inherent overstatement of the diagnostic performance of the test by the DOR estimates obtained
by Shaheen et al.16,23 Assuming the 0.5 recommended
threshold, the use of the APRI score in our setting renders
Figure 4. Receiver operating characteristic curve of APRI values for the diagnosis of significant fibrosis (METAVIR ≥ F2) in pa-tients with CHC. AUC, area under the ROC curve.
1.0
0.8
0.6
0.4
0.2
0.0
Sensitivity
APRI = 0.6433
AUC = 0.776
0.0 0.2 0.4 0.6 0.8 1.0 1- Specificity
Figure 5. Receiver operating characteristic curve of APRI values for the diagnosis of advanced fibrosis (METAVIR ≥ F3) in pa-tients with CHC. AUC, area under the ROC curve.
1.0
0.8
0.6
0.4
0.2
0.0
Sensitivity
APRI = 0.7532
AUC = 0.803
0.0 0.2 0.4 0.6 0.8 1.0 1- Specificity
Figure 6. APRI receiver operating characteristic curve of APRI values for the diagnosis of cirrhosis in patients with CHC. AUC, area under the ROC curve.
1.0
0.8
0.6
0.4
0.2
0.0
Sensitivity
APRI = 0.7532
AUC = 0.830
A Loaeza-del-Castillo et al. AST to platelet ratio index (APRI) for the noninvasive evaluation of liver fibrosis
www.medigraphic.com
ESTE DOCUMENTO ES ELABORADO POR MEDI-GRAPHIC
a limited 14% gain for the diagnosis of significant fibro-sis (51% pre- to 65% post-test probability). To exclude significant fibrosis, however, the gain is twice as much, or 29% (49% pre- to 78% post-test probability). There-fore, when < 0.5, the APRI score might be useful to ex-clude significant fibrosis, as proposed previously.
For the diagnosis of cirrhosis in CHC patients, we ob-tained an AUC of 0.830. This AUC was also very close to the pooled AUC of 0.82 (95%CI 0.79-0.86) reported in Shaheen’s meta-analysis. At thresholds of 1.0 and 2.0, es-timated sensitivities were 76% (95%CI 68-82%) and 49% (43-55%), and specificities 71% (69-73%) and 91% (90-93%), respectively.16 Our sensitivities at the same
thresholds were 77 and 38%, and specificities 77 and 92%. The 95%CIs of all these parameters overlapped those estimated in the meta-analysis. In our series, the cutoff point showing the best sensitivity (89.4%) and specificity (70.9%) was an APRI value of 0.7532, which is close to the 1.0 threshold of the meta-analysis, and al-most identical to the one originally found by Wai.12 Our
PLR of 3.08 was, again, notably lower than the pooled one, i.e. 11.3. With this regard, and considering that a PLR above 10 (or less than 0.10) gives convincing diag-nostic evidence, whereas one above 5 (or less than 0.20) gives strong diagnostic evidence,24 the APRI score in our
environment apparently provides a less than strong diag-nostic evidence at the recommended threshold values. This might be due to the sex and age composition of our CHC sample, which had a substantial proportion of fe-males (64%) and a mean age of 49.4 years. Adjusting for sex, the APRI delimited area under the ROC curve did not show clinical difference but, statistically, tended to be higher in males than in females (0.825 vs 0.822, P < 0.065). Age also tended to affect the diagnostic accuracy of the APRI score (P < 0.060) but, again, had no clinical-ly significant effect. These findings are consistent with those obtained in a published meta-regression analysis, where the accuracy of the APRI score for the detection of cirrhosis was greater in studies with a higher proportion of males (63%), younger age (45.5 years) and, particular-ly, in patients with coexisting HIV infection.16
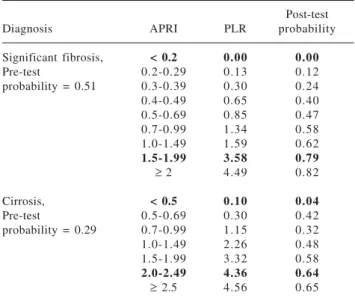
Given that, in terms of areas under the ROC curves, the accuracy of the APRI score in our CHC patients was similar to the published ones, and in order to analyze its clinical impact in our setting, we estimated PLRs for the diagnosis of significant fibrosis and cirrhosis at gradually increasing thresholds (Table II). Here, the diagnostic per-formance of the APRI score was adjusted to the pre-test probability (prevalence) of significant fibrosis and cir-rhosis found in our study, namely 0.51 and 0.29. In other settings, different pre-test probabilities are expected to derive in different post-test probabilities (positive pre-dictive values) (Appendix 1). This analysis disclosed that, in theory,24 an APRI score of < 0.2 is convincingly
exclusive of significant fibrosis in our setting, and a score of < 0.5 is convincingly exclusive of cirrhosis.
Fi-brosis and cirrhosis could be strongly included with APRI scores ≥ 2. Clinically, an APRI value of ≤ 0.3 re-duces the pre-test probability of significant fibrosis from 0.51 to ≤ 0.20, which is sufficiently low to exclude sig-nificant fibrosis without resorting to a liver biopsy, thus avoiding 15% of these procedures. An APRI value of > 1.5, in turn, increases the pre-test probability of signifi-cant fibrosis from 0.51 to ≥ 0.80, which is sufficiently high to include significant fibrosis, avoiding 26% liver biopsies. Together, APRI values of ≤ 0.3 and > 1.5 could avoid 41% biopsies in our patients with suspected sig-nificant fibrosis. As to cirrhosis, an APRI value of ≤ 0.5 reduces the pre-test probability of this advanced stage of fibrosis from 0.29 to ≤ 0.04, which is sufficiently low to exclude cirrhosis without resorting to a liver biopsy, avoiding 35% of these procedures. APRI values > 2, de-spite of providing a 35% diagnostic gain [(0.64-0.29) x 100], derive in post-test probabilities around 0.65, indi-cating that other diagnostic resources are needed to rule in this diagnosis. These findings are in agreement with those obtained recently by Carvalho et al, in Brasil,25 and
suggest that APRI thresholds are to be adjusted
accord-Table II. Positive likelihood ratios for the diagnosis of significant fibrosis and cirrhosis in patients with chronic hepatitis C at different APRI thresholds.
Post-test
Diagnosis APRI PLR probability
Significant fibrosis, < 0.2 0.00 0.00
Pre-test 0.2-0.29 0.13 0.12
probability = 0.51 0.3-0.39 0.30 0.24
0.4-0.49 0.65 0.40
0.5-0.69 0.85 0.47
0.7-0.99 1.34 0.58
1.0-1.49 1.59 0.62
1.5-1.99 3.58 0.79
≥ 2 4.49 0.82
Cirrosis, < 0.5 0.10 0.04
Pre-test 0.5-0.69 0.30 0.42
probability = 0.29 0.7-0.99 1.15 0.32
1.0-1.49 2.26 0.48
1.5-1.99 3.32 0.58
2.0-2.49 4.36 0.64
≥ 2.5 4.56 0.65
Pre-test probability ≈ Prevalence, Post-test probability ≈ Positive predictive value. PLR, positive likelihood ratio. Values in bold depict either rule-out or rule-in values.
1. Pre - test odds =
1 - (Pre -test probability) Pre - test probability
2. Post - test odds = (Pre - test odds x Positive likelihood ratio) ( )
3. Post - test probability = Post - test odds 1 + (Post - test odds)
www.medigraphic.com
ing to the site of use or, as discussed above, stratified ac-cording to the local CHC patient demographic and clini-cal profile.
Another option to improve the non-invasive diagnosis of liver fibrosis or cirrhosis is the combined use of tests. Here, besides de APRI score, the options are the Fi-broTest and the FibroScan. In a recent evaluation of these tests in a sample of 183 CHC patients, the area un-der the ROC curve for the diagnosis of significant fibrosis was 0.78, 0.85 and 0.83, respectively. For the diagnosis of advanced fibrosis these areas were 0.84, 0.9 and 0.9. Finally, the areas for the diagnosis of cirrhosis were 0.83, 0.87 and 0.95. The highest diagnostic yield was ob-tained by the combined use of FibroTest and FibroScan. Here, the areas under the ROC curve were 0.88, 0.95 and 0.95 for the diagnosis of significant fibrosis, advanced fi-brosis and cirrhosis, respectively.26 The combined use of
these two non-invasive tests in our setting is, however, almost impossible due to their limited availability and high cost.
In patients with NAFLD, the APRI score seldomly reached the value of 1, but a tendency towards higher values in patients with advanced stages of fibrosis was observed. This could be explained by gradual increases of AST in the presence of normal platelet counts. Pa-tients with NAFLD characteristically present mild to moderate increases in transaminase levels.27 Platelet
counts, on the contrary, are usually normal, at least in the early stages of fibrosis. We should acknowledge that our ability to show a relationship among APRI values and stage of fibrosis in this group was limited by the inclu-sion of subjects with a somewhat high cut-off value of alcohol consumption (50 g/d for men and 30 g/d for women), the absence of cirrhosis, and a small sample size. Alcohol consumption might have confounded our association between APRI and stage of fibrosis given that, itself, affects both AST and platelet count. Accord-ing to current recommendations, restriction of the sample to subjects with lower cut-off values of alcohol con-sumption, such as 30 g/d for men and 20 g/d for women would, probably, control for this confounder. Last, but not least, METAVIR might not have been the most ap-propriate staging score of fibrosis in this group, potential-ly leading to misclassification. The use of METAVIR in all our study groups was a methodologically based deci-sion, given that homogeneous criteria would allow more valid comparisons among groups. Results are, however, encouraging enough to warrant further validation of the APRI score in NAFLD, where all the above sources of bias are overcome.
As to AIH, there was a lack of association among APRI scores and degree of fibrosis. In this disease, portal, periportal and lobular inflammation is notorious in all stages of fibrosis.28 This, as observed in our study, can
derive in non-differentially high AST levels and, in turn, high APRI values irrespective of fibrosis stage. Besides,
the clinical course of this disease is characterized by con-tinuous exacerbations and remissions. When active, it presents with significant increases of both AST and ALT, which might further affect the accuracy of the APRI score. The use of immunosuppressive treatments is anoth-er potential confoundanoth-er of the accuracy. Unfortunately, both activity and treatment were not controlled in this study, due to the small sample size. Our findings, howev-er, are not encouraging enough to further evaluate the APRI score in AIH. An unsatisfactory performance of the APRI score has also been observed in patients with alco-holic fibrosis or cirrhosis. Here, heavy alcohol intake in-terferes affecting both AST and platelet count prior and independently to the development of fibrosis.29 This
sug-gests that the diagnostic usefulness of the APRI score might not be generalizable to chronic liver diseases of all etiologies justifying, in addition to a site-specific valida-tion, an etiology-specific one.
In summary, in our CHC patients, the APRI score can be a useful non-invasive alternative for the exclusion and inclusion of significant liver fibrosis, as well as for the exclusion of cirrhosis. At a threshold value of ≤ 0.3 it rules out significant fibrosis, at a value of ≤ 0.5 it rules out cirrhosis, and at a threshold of ≥ 1.5 it rules in signif-icant fibrosis. The consistency of these findings needs to be proven in other settings showing a similar CHC pa-tient demographic and clinical profile. The need of sex and age specific APRI thresholds warrants further evalu-ation. In patients with NAFLD, the APRI score appears to increase with a higher METAVIR score, suggesting that it might also be useful to diagnose fibrosis in this dis-ease. Probably due to the involvement of different mech-anisms of liver injury, the APRI score does not seem to have diagnostic value in patients with AIH.
References
1. Friedman SL. Liver fibrosis - From bench to bedside. J Hepatol
2003; 38: S38-S53.
2. Schuppan D, Ruehl M, Somasundaram R, Hahn EG. Matrix as a modulator of hepatic fibrogenesis. Semin Liver Dis 2001; 21: 351-72.
3. Fattovich G, Giustina G, Degos F, Tremolada F, Diodati G, Almasio P, Nevens F, et al. Morbidity and mortality in compensated cir-rhosis type C: a retrospective follow-up study of 384 patients.
Gastroenterology 1997; 112: 463-72.
4. Manning DS, Afdhal NH. Diagnosis and quantitation of fibrosis.
Gastroenterology 2008; 134: 1670-81.
5. Regev A, Berho M, Jeffers LJ, Milikowski C, Molina EG, Pyrsopoulos NT, Feng ZZ, et al. Sampling error and intraobserver variation in liver biopsy in patients with chronic HCV infection.
Am J Gastroenterol 2002; 97: 2614-8.
6. Castera L, Negre I, Samii K, Buffet C. Pain experienced during percutaneous liver biopsy. Hepatology 1999; 30: 1529-30. 7. Lichtenstein DR, Kim D, Chopra S. Delayed massive hemobilia
following percutaneous liver biopsy: treatment by embolotherapy. Am J Gastroenterol 1992; 87: 1833-8. 8. Colli A, Fraquelli M, Andreoletti M, Marino B, Zuccoli E, Conte
A Loaeza-del-Castillo et al. AST to platelet ratio index (APRI) for the noninvasive evaluation of liver fibrosis
www.medigraphic.com
9. Sandrin L, Fourquet B, Hasquenoph JM, Yon S, Fournier C, Mal F, Christidis C, et al. staging Transient elastography: a new noninvasive method for assessment of hepatic fibrosis. Ultra-sound Med Biol 2003; 29: 1705-13.
10. Saito H, Tada S, Nakamoto N, Kitamura K, Horikawa H, Hurita S, Saito Y, et al. Efficacy of non-invasive elastometry on of hepatic fibrosis. Hepatol Res 2004; 29: 97-103.
11. Imbert-Bismut F, Ratziu V, Pieroni L, Charlotte F, Benhamou Y, Poynard T, MULTIVIRC Group. Biochemical markers of liver fibrosis in patients with hepatitis C virus infection: a prospective study. Lancet 2001; 357: 1069-75.
12. Wai CT, Greenson JL, Fontana RJ, Kalbfleisch JD, Marrero JA, Conjeevaram HS, Lok AS. A simple noninvasive index can pre-dict both significant fibrosis and cirrhosis in patients with chronic hepatitis C. Hepatology 2003; 38: 518-26.
13. Expert Panel on Detection, Evaluation, and Treatment of High Blood Cholesterol in Adults (Adult Treatment Panel III). Execu-tive summary of the third report of the national cholesterol edu-cation program (NCEP). J Am Med Assoc 2001; 285: 2486-97. 14. Bedossa P, Poynard T. An algorithm for the grading of activity in chronic hepatitis C. The METAVIR Cooperative Study Group.
Hepatology 1996; 24: 289-93.
15. Cuzick J. A Wilcoxon-type test for trend. Stat Med 1985; 4: 87-90. 16. Shaheen AA, Myers RP. Diagnostic accuracy of the aspartate aminotransferase-to-platelet ratio index for the prediction of hepa-titis C-related fibrosis: a systematic review. Hepatology 2007; 46: 912-21.
17. Kim BK, Kim SA, Park YN, Cheong JY, Kim HS, Park JY, Cho SW, et al. Noninvasive models to predict liver cirrhosis in pa-tients with chronic hepatitis B. Liver Int 2007; 27: 969-76. 18. Kawasaki T, Takeshita A, Souda K, Kobayashi Y, Kikuyama M,
Suzuki F, Kageyama F, et al. Serum thrombopoietin levels in patients with chronic hepatitis and liver cirrhosis. Am J Gastroenterol 1999; 94: 1918-22.
19. Adinolfi LE, Giordano MG, Andreana A, Tripodi MF, Utili R, Cesaro G, Ragone E, et al. Hepatic fibrosis plays a central role in
the pathogenesis of thrombocytopenia in patients with chronic viral hepatitis. Br J Haematol 2001; 113: 590-5.
20. Aster R. Pooling of platelets in the spleen: role in the pathogenesis of hypersplenic thrombocytopenia. J Clin Invest 1996; 45: 645-57. 21. Nalpas B, Vassault A, Le Guillou A, Lesgourgues B, Ferry N,
Lacour B, Berthelot P. Serum activity of mitochondrial aspartate aminotransferase: a sensitive marker of alcoholism with or with-out alcoholic hepatitis. Hepatology 1984; 4: 893-6.
22. Kamimoto Y, Horiuchi S, Tanase S, Morino Y. Plasma clearance of intravenously injected aspartate aminotransferase isozymes: evidence for preferential uptake by sinusoidal liver cells.
Hepatology 1985; 5: 367-75.
23. Davies HT, Crombie IK, Tavakoli M. When can odds ratios mis-lead? Br Med J 1998; 316: 989-91.
24. Deeks JJ. Systematic reviews in health care systematic reviews of evaluations of diagnostic and screening tests. Br Med J 2001; 323: 157-62.
25. Carvalho-Filho RJ, Schiavon LL, Narciso-Schiavon JL, et al. Optimized cutoffs improve performance of the aspartate ami-notransferase to platelet ratio index for predicting significant liver fibrosis in human immunodeficiency virus/hepatitis C virus co-infection. Liver Int 2008; 28: 486-93.
26. Castera L, Vergniol J, Foucher J, Le Bail B, Chanteloup E, Haaser M, Darriet M, et al. Prospective comparison of transient elastography, Fibrotest, APRI, and liver biopsy for the assess-ment of fibrosis in chronic hepatitis C. Gastroenterology 2005; 128: 343-50.
27. Angulo P, Keach JC, Batts KP, Lindor KD. Independent predic-tors of liver fibrosis in patients with nonalcoholic steatohepatitis.
Hepatology 1999; 30: 1356-62.
28. Nakaji M, Hayashi Y, Ninomiya T, et al. Histological grading and staging in chronic hepatitis: its practical correlation. Pathol Int 2002; 52: 683-90.