APPLICATION OF THE ENERGY MOBILITY TO FLUID-STRUCTURE
COUPLING PREDICTION
PACS references 43.40.R , ss-sta
ref. provisional number : 659
Myong-Sok RYU; Christian CACCIOLATI; Jean Louis GUYADER Laboratoire Vibrations Acoustique
INSA, Bat. St Exupéry, 25 bis Av Jean Capelle 69621 Villeurbanne CEDEX
France
Tel : (33) 04 72 43 80 80 Fax: (33) 04 72 43 8712
E-mail: [email protected] ; [email protected] ; [email protected]
ABSTRACT The Energy Mobility method was recently developed (1997/99), to predict the vibration behaviour in the medium frequency range, of point coupled structures. In this paper the method is extended to the case of vibroacoustic coupling. Quadratic velocity of the structure and radiated power in the fluid medium are obtained. The method use quantities easily obtained on uncoupled substructures. The example of a plate / cavity system is presented.
1. INTRODUCTION.
coupled structures.
In this paper, the energy mobility method is extended to incorporate the case of vibroacoustic coupling through a surface between a structure and a fluid medium. The method is numerically tested using a simply supported rectangular plate located on the open face of a rectangular cavity with five rigid walls. The kinetic energy on the plate, the radiated power into the cavity and the radiation efficiency are investigated.
2. THEORETICAL MODEL.
Classic mobility Yij is defined as the ratio of the velocity Vi at a point of reception i to the force Fj
at a point of excitation j on the linear and elastic structure in the frequency domain (f). This is
used as a predictive method to compute the vibrations behavior of coupled sub structures.
Energy Mobility Hij is based on the average of the classic mobility in a frequency domain
(
∆
f) [3,4]. It is defined as:
{ }
jj ff ij
ij Y Y
H =〈 2〉 〈Re 〉 (1)
Where 〈 〉f designates the frequency average over
∆
f. Using the time-frequency average of thequadratic velocity |Vi|
2
and of the active injected power Πj, we can write
∑
〈Π 〉 = 〉 〈 j f j ij f i H V 2 (2)The method may be used on a single structure, and a multi-points connected system. The
studied points i, j and k must be sufficiently spaced to have:
{ }
YijYik 〉f <<〈Yij 〉f〈Re * 2 (3)
Now one considers a vibro-acoustic problem, the structures are coupled through their surface to the fluid. The existing Energy Mobility method cannot be directly used because the coupling points are continuously spaced, and relation (3) is not satisfied for closed points. Moreover, the acoustic input mobility is singular and its calculation is only possible as a mean value over a surface (see [1]). To apply the Energy Mobility method to vibro-acoustic it is necessary to mesh the coupling surface using patches. By integrating the classic mobility over the areas of patches
i and j, one define the equivalent classic mobility Yij-eq between patches:
j i j i eq
ij Y s s
Y − =〈〈 〉 〉 ∆ ∆ (4)
Where < > /∆Sj is the mean value over the surface of patch j. This is resulting from the
assumption of constant pressure and velocity at each patch. Accordingly, the equivalent energy
mobility Hij-eq between the patches is defined by using equation (1),
{
j j}
f i i f2 j i eq
ij
Y
Re
Y
Äs
Äs
H
−=
〈
〈〈
〉
〉
〉
〈
〈〈
〉
〉
〉
(5)The frequency average of the quadratic velocity is then obtained with equation (2),
∑ 〈Π 〉 − + − = 〉 〈
c ic eq c f H eq ij V f i
V 2 ~ ~ C (6)
Where the symbol ~ signifies "before coupling". Using the connectivity conditions:
f a eq c f s eq c V
V'− 2 = '− 2 and
f a s eq c f a s eq
c←− =−Π →−
Π . (7)
The frequency average of the exchanged power on the patches <Πc
C>
f are obtained by
{
}
(
[
] [
]
)
− + = Π ← − − − − − − f s éq c f a éq c a éq c c s éq c c f a s éqc H H V V
The powers exchanged are then used in equation (6) to have the quadratic velocity over patches. Note that, using input forces in place of the uncoupled quadratic velocities to introduce
the sources, the transfer mobility in relation (2) must include the connection factor α. This
connection factor is presented in [2][3].
3. NUMERICAL STUDY.
The assumption given in relation (3) is verified when the distance between the two considered points is large compared to the wavelength, or in other words, when the real and the imaginary parts of the classical mobilities vary around zero in the frequency band. This is generally the case for thin plate mobility, but the patch acoustic input mobility doesn't satisfy this assumption at low frequency. The validity of the calculation is tested through numerical simulations. A simply supported rectangular plate is located on the open face of a rectangular cavity with five rigid walls. A point force is located at (0.25m, 0.1m) on the plate, the kinetic energy of the plate, the radiated power inside the cavity and the radiation efficiency inside the cavity are studied. The analysis is done using a constant bandwidth of 400Hz. The results given by the Energy Mobility method are compared to those given by the modal approach. The plate is steel made
(0.5m x 0.6m), thickness h=0.005m, loss factor
η
s. The critical frequency is approximately2400Hz. The cavity (0.5m x 0.6m x 0.7m) contains air, with a loss factor
η
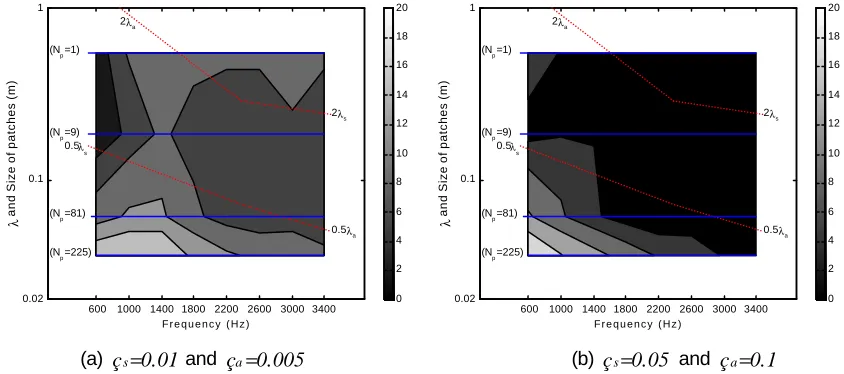
a. The discrepancybetween the radiation efficiencies obtained using the two calculations indicates the quality of the vibroacoustic prediction (see figure 1).
0 2 4 6 8 10 12 14 16 18 20
600 1000 1400 1800 2200 2600 3000 3400 0.02
0.1 1
F r e q u e n c y ( H z )
λ
and Size of patches (m)
(N p=1)
(N p=9)
(N p=81)
(N p=225)
2λa
2λs
0.5λs
0.5λa
0 2 4 6 8 10 12 14 16 18 20
600 1000 1400 1800 2200 2600 3000 3400 0.02
0.1 1
F r e q u e n c y ( H z )
λ
and Size of patches (m)
(N p=1)
(N p=9)
(N p=81)
(N p=225)
2λa
2λs
0.5λs
0.5λa
[image:3.596.84.506.424.611.2](a) çs=0.01 and ça=0.005 (b) çs=0.05 and ça=0.1
Figure 1: Error in dB on the radiation efficiency of the plate into the cavity, constant frequency
bandwidth 400Hz, for several patches size ∆s, and two different values of damping.
The coupling surface is divided in Np identical patches of area ∆s, the size of each patch is ∆s.
Before the critical frequency, the smallest error is obtained when the mesh is larger than the half wavelength of the plate and lower than two times the acoustic wavelength. On the contrary, after the critical frequency, the smallest error is obtained when the mesh is larger than the half acoustic wavelength and lower than two times the wavelength of the plate. In other words, to summarize the results of figure 1, two criterions can be proposed. They are based on wave
must be larger than half wavelength of the subsystem having slower waves speed. Secondly, to obtain a good characterization of the coupling, the patch spacing must be smaller than two times the wavelength of the subsystem having faster wave speed. Note that the method needs an under sampling of the surface (relatively to the wavelength), contrary to finite element method witch need an over sampling.
The errors on the radiation efficiency are the values indicated inside the circles on figure 1. The accuracy varies from 2dB to 7dB when the cavity has a low damping. When the cavity has a high damping, the accuracy varies from 0dB to 3dB, and only the first criterion seems to be necessary. The method may be well suited for radiation into damped cavities and also to infinite medium.
4. THEORY-EXPERIMENT COMPARISON.
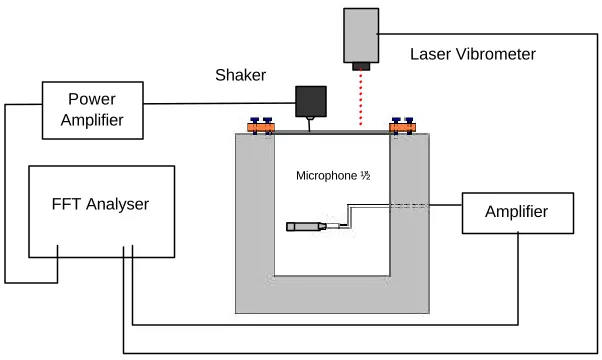
[image:4.596.143.444.411.591.2]An experiment on a plate-cavity system was made. The system was similar to the one used for the previous numerical study, it is shown in figure 2. The simply supported plate is steel made (0.5m x 0.6m), its thickness is h=0.003m. An input force is located at (0.25m, 0.1m) on the plate. The cavity (0.5m x 0.6m x 0.7m) contains air. Like in the numerical study, the analysis is done using a constant frequency bandwidth of 400Hz.
Figure 2: Experimental set up.
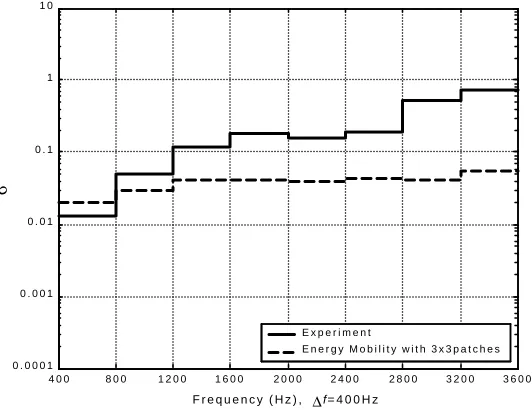
4.1. Case Of Weakly Damped Cavity
The measured loss factors for plate and cavity are given in table 1. The results given by the Energy Mobility method are compared with the experimental ones in figure 3. One observes that 3 x 3 patches is a good choice at low frequency. It is also the best choice in the medium frequency range. But the radiated power is small and very sensitive to the approximations made, so a discrepancy of 10dB occurs above the critical frequency.
Laser Vibrometer
Microphone ½” Shaker
Amplifier FFT Analyser
Table 1: Damping loss factor of the plate:
η
s, and the cavity:η
a.4 0 0 8 0 0 1 2 0 0 1 6 0 0 2 0 0 0 2 4 0 0 2 8 0 0 3 2 0 0 3 6 0 0 0 . 0 0 0 1
0 . 0 0 1 0 . 0 1 0 . 1 1 1 0
F r e q u e n c y ( H z ) , ∆f= 4 0 0 H z
σ
E x p e r i m e n t E n e r g y M o b i l i t y w i t h 3 x 3 p a t c h e s
Figure 3: Radiation efficiency versus frequency, case of weakly damped cavity.
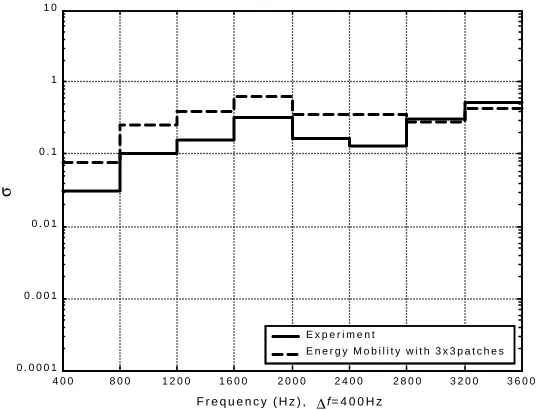
4.2. Case Of Highly Damped Cavity
The measured plate and cavity loss factors (
η
s andη
a) are given in table 2. The plate dampingwas unchanged; but some absorbing material was added inside the cavity. The damping inside the cavity increases (approximately multiplied by 10). Results given by the Energy Mobility method are compared with the experimental ones on figure 4.
Center Frequency 200 600 1000 1400 1800 2200 2600 3000 3400 3800
η
s x 10-3
1.59 1.00 1.69 4.22 5.07 5.61 5.86 5.31 5.44 4.21
η
a x 10-3
50.06 42.40 27.96 23.90 33.62 14.86 12.34 9.72 11.68 8.00
Table 2: Damping loss factor of the plate:
η
s, and the cavity:η
a.When the damping of the cavity is large, the size of the patch must satisfy only one criterion. It must be larger than the half wavelength of the subsystem with slower wave speed. One observes that 3 x 3 patches is a good choice at low frequency, and one patch may be sufficient in the medium frequency range. The discrepancy is close to zero above the critical frequency, and only of 4dB at low frequency. In this case the radiated power is larger than the radiated power of the previous simulation, and it is less sensitive to the approximations made.
Center Frequency 200 600 1000 1400 1800 2200 2600 3000 3400 3800
η
s x 10-3
1.59 1.00 1.69 4.22 5.07 5.61 5.86 5.31 5.44 4.21
η
a x 10-3
4 0 0 8 0 0 1 2 0 0 1 6 0 0 2 0 0 0 2 4 0 0 2 8 0 0 3 2 0 0 3 6 0 0 0 . 0 0 0 1
0 . 0 0 1 0 . 0 1 0 . 1 1 1 0
F r e q u e n c y ( H z ) , ∆f= 4 0 0 H z
σ
[image:6.596.156.425.82.287.2]E x p e r i m e n t E n e r g y M o b i l i t y w i t h 3 x 3 p a t c h e s
Figure 4: Radiation efficiency versus frequency, case of highly damped cavity.
5. CONCLUSION.
This work shows that the Energy Mobility approach may be used to study the vibroacoustic coupling. The method is based on the double integration of the classical point mobility of the subsystems over coupling patches and over a frequency band. The size of patches must be larger than the half wavelength of the subsystem with slower waves. Contrary to the other numerical methods, this criterion implies that the solution is obtained through an under sampling of the coupling surface. The numerical results, obtained on a plate-cavity system, indicate that the method may be well suited to compute the radiation efficiency of a structure into an infinite medium. This point is of interest because the accuracy is acceptable at low frequency, and good in the medium frequency range. The next step of investigation will be the prediction of the radiation efficiency, based on the measured point mobilities of a structure. But it will be necessary to better understand the reasons why, in the case of weakly damped cavity, the prediction is unsatisfactory after the critical frequency.
References:
1. J.L.Guyader, C.Cacciolati and H.Nelisse, “Acoustical mobility for vibroacoustic prediction”, in
Proceedings of Internoise97, Budapest, 1997, pp. 715-720.
2. G.Orefice, Description par Mobilités Energétiques des échanges vibratoires dans les
systèmes couplés, Thesis, INSA de Lyon, 1997.
3. G.Orefice, C.Cacciolati, J.L.Guyader "The Energy Mobility", accepted to Journal of Sound