Essays on innovation, productivity and knowledge flows: evidence for Spanish firms
189
0
0
Texto completo
(2) Department of Econometrics, Statistics and Spanish Economy Faculty of Economics and Business University of Barcelona. ESSAYS ON INNOVATION, PRODUCTIVITY AND KNOWLEDGE FLOWS: EVIDENCE FOR SPANISH FIRMS. Esther Goya Carrillo. Supervisors: Dr. Esther Vayá Valcarce and Dr. Jordi Suriñach Caralt. Ph.D. Dissertation Ph.D. program in Statistics January 2015.
(3)
(4) To my family.
(5)
(6) Acknowledgments At this moment of my life, I feel happy and very lucky. During these years, many wonderful people and opportunities have surrounded me. This is the moment where I express my gratitude to everyone who has been there to help and support me. Above all, I would like to thank my supervisors, because without them this thesis would have never seen the light of day. Firstly, I am very grateful to Jordi Suriñach for introducing me into the “world of research” and for the trust he placed in me from the beginning. Certainly, his guidance, support and encouraging words have helped me throughout the course of this thesis. Secondly, I am indebted to Esther Vayá for her dedication and total commitment with this thesis. She has been a tremendous mentor for me. I am completely sure that without her I would never have finished this thesis and I am truly and deeply grateful to you, Esther, for having been “the best supervisor ever!”. I am thankful to the Catalan Government for their financial assistance and to the Department of Econometrics, Statistics and Spanish Economy for its support. In addition, I am very grateful to the AQR Research Group for giving me the opportunity to be part of it, in addition to the assistance I received during these years. I want to express my gratitude to everyone who kindly gave me advice and support at some point, in particular, Raul Ramos, Vicente Royuela, Enrique López-Bazo, Elisabeth Motellón, Rosina Moreno and Bibiana Barnadas. In addition, I express my sincere gratitude to my colleagues at the University for the great moments that we shared and all the fun we had. A. v.
(7) special mention goes to Ernest Miguélez, for the great time we spent in room 100, and Erika Badillo, for listening to me when needed, but more importantly, for her friendship. I could not have wished for better officemates. On the other hand, I appreciate all the support from the University of Reading and my host Professor Uma Kambhampati during my visit. It was a pleasure to meet such a lovely people, especially in the Graduate School. It would not have been the same without them. I also would like to express my gratitude to my friends for their support and cheered me up when I needed it most. I am especially grateful to Sandra Nieto, with whom I started this adventure and share a strong friendship. For her affection and moral support, “thank you”. Lastly, my most sincere and biggest thank you is reserved for the most important people in my life, my family. To my mother, Raquel and Pablo for their unconditional love. For believing in me and always being there. For much more than I can write here, “moltes gràcies”.. vi.
(8) Contents List of Tables ............................................................................................ xi List of Figures.......................................................................................... xii Chapter 1:. General framework and outline of the thesis ................ 1. 1.1. Introduction and motivation .............................................................3. 1.2. General background ..........................................................................7. 1.3. Outline of the thesis and research questions...................................11. Chapter 2:. Data ............................................................................................... 15. 2.1. The Technological Innovation Panel (PITEC) ...............................17. 2.2. Innovation and productivity............................................................22. 2.2.1. How to measure innovation and productivity with PITEC .....23. 2.2.2. Evidence for the period 2004-2011 .........................................26. Chapter 3:. R&D, firm performance and spillovers.......................... 33. 3.1. Introduction.....................................................................................35. 3.2. What do we know so far? ...............................................................40. 3.3. Model and estimation strategy ........................................................45. 3.3.1 3.4. Olley & Pakes (1996) estimator...............................................48. Data and variables ..........................................................................51. 3.4.1. Dependent variable ..................................................................52. 3.4.2. Independent variables ..............................................................52. 3.5. Results.............................................................................................56. 3.5.1. Descriptive analysis .................................................................56. 3.5.2. Empirical results ......................................................................59. 3.6. Further explorations ........................................................................64. 3.7. Concluding remarks ........................................................................65. Chapter 4:. The importance of spillovers using the CDM model 69. 4.1. Introduction.....................................................................................71. 4.2. What do we know so far? ...............................................................73. 4.3. Model and estimation strategy ........................................................77. 4.3.1. First stage: The research equations ..........................................78. vii.
(9) 4.3.2. Second stage: The innovation equation ...................................80. 4.3.3. Third stage: The productivity equation ....................................81. 4.4. Data and variables ..........................................................................82. 4.4.1. First stage .................................................................................85. 4.4.2. Second stage ............................................................................88. 4.4.3. Third stage ...............................................................................89. 4.5. Results.............................................................................................91. 4.5.1. Descriptive analysis .................................................................91. 4.5.2. Estimation results .....................................................................94. 4.6. Concluding remarks ......................................................................103. Chapter 5: How important are internal knowledge flows for firm’s innovative performance? ................................................................107 5.1. Introduction...................................................................................109. 5.2. What do we know so far? .............................................................112. 5.2.1. Voluntary knowledge flows ...................................................112. 5.2.2. Involuntary knowledge flows ................................................114. 5.2.3. The role of absorptive capacity ..............................................115. 5.3. Model and estimation strategy ......................................................117. 5.4. Data and variables ........................................................................119. 5.4.1. Dependent variable: Innovation performance .......................120. 5.4.2. Independent variables ............................................................120. 5.5. Results...........................................................................................125. 5.5.1. Descriptive analysis ...............................................................125. 5.5.2. Estimation results ...................................................................128. 5.6. Further Explorations .....................................................................132. 5.6.1. Alternative measure of involuntary knowledge flows ...........132. 5.6.2. Absorptive capacity as a discrete measure ............................135. 5.6.3 Alternative measure for Absorptive Capacity: Personnel in R&D....................................................................................................137 5.6.4 5.7. Is the degree of novelty in the innovation important? ...........139. Concluding remarks ......................................................................142. viii.
(10) Chapter 6:. General conclusions.............................................................145. 6.1. Summary and policy implications ................................................147. 6.2. Limitations and future research ....................................................153. Appendices 157 References 167. ix.
(11) x.
(12) List of Tables Table 1.1 Real GDP and employment (annual growth rates) ........................5 Table 2.1 Industry classification according to technological intensity ........20 Table 2.2 Innovation activities .....................................................................24 Table 2.3 Evolution of innovation 2004-2011 (in %) ..................................26 Table 3.1 Descriptive statistics by technology level ....................................58 Table 3.2 OP estimates. Estimation results of Equation [3.4] 2004-2009. Dependent variable: ln(sales). ......................................................................61 Table 3.3 OP estimates. Estimation results of Equation [3.4] 2004-2009. Dependent variable: ln(sales). ......................................................................65 Table 4.1 Definition of variables .................................................................83 Table 4.2 Descriptive statistics ....................................................................92 Table 4.3 Research Equations (2004-2010) .................................................96 Table 4.4 Innovation Equation (2007-2010) ................................................99 Table 4.5 Productivity Equation (2007-2010) ...........................................102 Table 5.1 Definition of variables ...............................................................124 Table 5.2 Descriptive statistics for innovative firms .................................126 Table 5.3 Estimates of Equation [5.5] using Wooldridge (1995) consistent estimator for panel data with sample selection. PITEC 2004-2011...........131 Table 5.4 Estimates of Equation [5.5] using Wooldridge (1995) consistent estimator for panel data with sample selection. PITEC 2004-2011. Alternative definition for involuntary spillovers. ......................................134 Table 5.5 Estimates of Equation [5.5] using Wooldridge (1995) consistent estimator for panel data with sample selection. PITEC 2004-2011. Dummy variables to proxy absorptive capacity. ......................................................136 Table 5.6 Estimates of Equation [5.5] using Wooldridge (1995) consistent estimator for panel data with sample selection. PITEC 2004-2011. Alternative definition of absorptive capacity. ............................................138 Table 5.7 Estimates of Equation [5.5] using Wooldridge (1995) consistent estimator for panel data with sample selection. PITEC 2004-2011. Estimations according to the degree of novelty .........................................141. xi.
(13) Table A. 1 Outliers by technological level ................................................159 Table A. 2 Descriptive statistics Chapter 3 before filters ..........................160 Table A. 3 Descriptive statistics Chapter 4 before filters ..........................161 Table A. 4 Descriptive statistics Chapter 5 ................................................164 Table A. 5 Estimates of the Equation [5.1]. Probit models. 2006- 2011 ...165. List of Figures Figure 1.1 Real labour productivity (annual growth rate) .............................4 Figure 2.1 Distribution of innovation activities. 2005-2011 ........................28 Figure 2.2 Innovation intensity. 2005-2011 .................................................29 Figure 2.3 Productivity (Sales/Employment) 2004-2011 ............................30 Figure 2.4 Evolution according technology level ........................................31 Figure 3.1 Gross domestic expenditure on R&D (% of GDP).....................36 Figure 3.2 Gross domestic expenditure on R&D in 2012 (% of GDP). Cross-country comparison. ..........................................................................37 Figure 3.3 Business sector expenditure on R&D (% of GDP).....................38 Figure 5.1 High important sources of information (% of innovative firms) ....................................................................................................................127 Figure 5.2 Cooperation in innovation activities with different types of partners (% of innovative firms) ................................................................128. xii.
(14) Chapter 1: General framework and outline of the thesis. 1.
(15) 2.
(16) 1.1 Introduction and motivation The relationship between innovation and productivity has been widely studied for many decades, and nowadays this topic continues to generate great interest among the scientific community. How to increase firms’ performance is a key factor, not only at firm level, but also at a national level, especially in today’s globalized world. This is why the study of its determinants has been at the centre of attention of many researchers over the past few years. As extensively acknowledged, innovation is an essential element and, as it will be seen below, its importance for productivity growth is undeniable. But what does innovation mean? Despite its relevance, the literature does not provide a clear and accurate definition of innovation. It is a wide and complex concept which can be understood in different ways and can be approximated using different variables. All in all, it seems plausible to assume that innovation is something new, not only for products, but also corresponding to a better ways of doing something, and the root of this “newness” is knowledge. Interestingly, knowledge can be created inside firms, shared between different companies or simply spill over firm’s boundaries. As first stated by Griliches (1979), the level of knowledge in one sector depends on own research efforts as well as external knowledge, or as the author puts it “knowledge borrow or stolen from other sector or industries”. Thus, firm performance not only depends on its own knowledge, but also on the knowledge and experience generated by others that it is present in the society. The reason is that knowledge is a (quasi-) public good. In other words, it is non-rival -it can be consumed without depleting it, so its use by. 3.
(17) one firm does not impede others from doing the same- and (at least partially) non-excludable -(almost) no one can be excluded from using it. Taking this into account, this dissertation aims to further understand the bond between innovation and firms’ performance in Spain considering these knowledge flows. In this regard, two distinctions will be drawn in this study: i) depending on the “origin” of knowledge one can distinguish between internal knowledge (transfers within the firm) and external knowledge (coming from outside the company), and ii) depending on the “willingness”, knowledge flows can be voluntary (for example, cooperation agreements) or involuntary (also known as spillovers). The motivation to study Spain lays on the fact that even though productivity has increased in recent years (Figure 1.1), this growth is largely attributable to a drastic reduction in employment instead of an increase in production (Table 1.1). Figure 1.1 Real labour productivity (annual growth rate) 4. 3 2 1 0 2000 2001 2002 2003 2004 2005 2006 2007 2008 2009 2010 2011 2012 2013. -1 -2 -3 -4 European Union (27). European Union (15). Source: Eurostat; own representation.. 4. Spain.
(18) Table 1.1 Real GDP and employment (annual growth rates). 2000 2001 2002 2003 2004 2005 2006 2007 2008 2009 2010 2011 2012 2013. Spain 5.0 3.7 2.7 3.1 3.3 3.6 4.1 3.5 0.9 -3.8 -0.2 0.1 -1.6 -1.2. GDP growth EU 27 EU 15 3.9 3.9 2.0 2.0 1.3 1.2 1.5 1.3 2.6 2.4 2.2 2.0 3.4 3.2 3.2 3.0 0.4 0.1 -4.5 -4.6 2.0 2.0 1.7 1.5 -0.4 -0.5 0.1 0.0. Employment growth Spain EU 27 EU 15 5.1 2.2 2.4 3.2 0.8 1.3 2.5 -0.1 0.7 3.2 0.4 0.5 3.6 0.6 0.8 4.1 1.0 1.0 4.0 1.6 1.5 3.0 1.8 1.6 -0.1 1.0 0.8 -6.5 -1.8 -1.8 -2.2 -0.7 -0.3 -1.9 0.3 0.3 -4.2 -0.2 -0.3 -3.0 -0.3 -0.4. Source: Eurostat.. As shown in Figure 1.1, up until 2007, Spanish firms presented lower rates of labour productivity growth than those recorded by their European counterparts (both EU-27 and EU-15). Since that date, however, Spain’s growth rates have risen notably taking them to the top of Europe’s rankings, with the exception of 2010. This might suggest successful adaptation to the economic crisis; but, the reality is quite different. As can be seen in Table 1.1, the fall in employment in Spain has been much greater than that recorded in the rest of the continent since 2008. As a result, Spanish firms have increased their productivity via the destruction of jobs, as opposed to a production growth. Actually, Spain’s GDP growth rate has been lower than Europe’s during the last years. This fact raises concern about the role played by innovation, since innovation is a key determinant for economic growth, as emphasized by numerous articles. For this reason, it becomes very interesting to obtain a better understanding of the situation in Spain during these recent years.. 5.
(19) All in all, the main goal of this dissertation is to investigate the relationship between innovation and firm performance taking into account the impact of knowledge flows on firm’s innovative behaviour and performance, as well as, on firm productivity. To this end, Spanish firms from both manufacturing and services sectors are considered. As it will be seen in next sections, the evidence for Spain is scant. There has been little discussion about involuntary knowledge flows, both external and internal. In addition, most studies are exclusively focused on the manufacturing sector, while little attention has been paid to the service sector. Therefore, this inquiry attempts to modestly contribute to the literature to some extent. Escalating from a basic and traditional model towards a more complex structural model, each chapter attempts to improve and overcome the limitations encountered along the way. This gradual process has had as a result the following three pieces of research: Goya, E.; Vayá, E. and Suriñach, J. (2012) “Productivity and innovation spillovers: Micro evidence from Spain (2004-2009)” 1 . Submitted to Journal of Productivity Analysis (2nd round evaluation) Goya, E.; Vayá, E. and Suriñach, J. (2013) “Do spillovers matter? CDM model estimates for Spain using panel data” 2 . SEARCH working paper collection, WP4/28.. 1. Presented at the 51th ERSA and 37th AECR Congress 2011, Barcelona (Spain), August 2011, and XV Spanish Applied Economics Meetings, Coruña (Spain), June 2012. 2. Presented at the Workshop on Firm Growth and Innovation, Tarragona (Spain), June 2012; XVI Spanish Applied Economics Meetings, Granada (Spain), June 2013; 40th Annual Conference of the European Association for Research in Industrial Economics, Évora (Portugal), August 2013; XXVIII Industrial Economics Meetings, Segovia (Spain), September 2013; and XXXVIII Spanish Economic Association Meeting, Santander (Spain), December2013.. 6.
(20) Goya, E. (2014) “How important are internal knowledge flows for innovative firm’s performance?”. CIP Discussion Paper No. 112, University of Reading. Submitted to Journal of Technology Transfer. While it is true that each of the above is a separate paper, they all pursue the same goal: to have a better understanding of the impact of knowledge flows on innovation and productivity in Spain. The rest of this introduction provides a brief overview of the relationship between innovation and productivity, followed by a basic review of some concepts regarding knowledge flows. Finally, the outline and research questions are summarized in the last section.. 1.2 General background According to the endogenous growth models (Lucas, 1988; Romer, 1986, 1990), economic growth is driven by investments in human capital and innovation, as well as knowledge spillovers. Therefore, both creation and diffusion of knowledge are key elements in economic development. From an empirical point of view, numerous studies in the previous decades point out the importance of these factors as drivers of productivity. As for human capital, the literature shows its positive influence on productivity; as workers become better trained and acquire more skills, they can carry out tasks more efficiently (Black and Lynch, 1996; Haltiwanger et al., 1999 for the United States; Turcotte and Rennison, 2004 for Canada; Arvanitis and Loukis, 2009 for Greece and Switzerland; Yang, et al., 2010 for China; Lee 2011 for Malaysia). As far as the purpose of this study is concerned, the relationship between innovation and productivity has been widely studied by many authors since. 7.
(21) the pioneering work of Griliches (1979, 1986). Investments in innovation activities lead to a higher stock of knowledge and technological capability having as a result new or improved goods and services and/or higher levels of efficiency in the production process. Thereby, innovation may have an impact on increasing sales and/or reducing costs of production; raising productivity consequently. The results obtained from empirical studies seem to depend on the geographical area analysed and the database and methodology used. Yet in general, the evidence certainly points to a positive and significant relationship between innovation and productivity at the firm level (see Chapter 3 for a review). Nonetheless, it is worthy bearing in mind the “file drawer” problem (Rosenthal, 1979). As argue by Tsai and Wang (2004), the empirical evidence could be “over-optimistic” as for the impact of innovation in productivity, since those papers that do not support such a positive effect have a higher probability of not being published. As mentioned in the previous section, not all of the benefits derived from research efforts are fully appropriable by its producer. On the contrary, when a firm innovates, part of the knowledge generated spills over -being available for others to use it due to the firm’s incapacity to keep it within its boundaries. According to Griliches (1979), there are two types of externalities: rent spillovers and pure knowledge spillovers. The former appears when the market transactions do not reflect the full quality of goods that are purchased at a lower price than their quality improvements, while the latter does not occur in relation to economic transactions but they basically capture flows of ideas and information. Although some studies argue that rent spillovers should not be considered spillovers since they arise from mis-measurements, other papers state the opposite. If a firm pays less than the cost to create the knowledge on its own, then it can be assumed to benefit from spillovers (Keller, 2004). In addition, as Belderbos. 8.
(22) and Mohnen (2013) point out, rent spillovers can include or be correlated with pure knowledge spillovers. For instance, even if the firm pays a price that reflects the technology embodied in the product, it might own some complementary technology that allows it to obtain a higher profit from the good purchased. Moreover, in order to buy and sell products, face-to-face meetings are sometimes necessary, which may have as a result knowledge flows. In any case, as pointed out by several authors, it is very difficult to distinguish between both types of spillovers empirically. For that reason, most articles employ the general notion of ‘knowledge spillovers’. 3. (Mohnen, 1996; Ornaghi, 2006; Bloch, 2013). Another distinction that the literature undertakes is the difference between explicit and tacit knowledge (Polanyi, 1966). Explicit knowledge can be understood as knowledge which can be codified and which is easier to protect (for instance, in a book). On the other hand, tacit knowledge is embodied in people’s abilities being difficult to write down or codify somehow. As Kaiser (2002) points out, tacit knowledge is transmitted involuntarily between firms and, as the author puts it “[it] is a main source of research spillovers”. As mentioned in the previous section, knowledge flows can be considered from different perspectives depending on their “origin” and “willingness”. As for the “origin”, here it will be distinguished between: i) internal knowledge flows (transfers within the firm) and external knowledge flows (information coming from outside the company). As regards the “willingness”, a distinction will be made between: i) voluntary and ii). 3. In this line, here it is also going to be used this broad concept to refer to any kind of externality related to research activities. For that reason, ‘knowledge spillover’, ‘spillover’, ‘externality’ or ‘external knowledge flows’ are going to be used interchangeably henceforth.. 9.
(23) involuntary. Generally speaking spillovers are involuntary as it is supposed that the firm who innovates would like to appropriate of all the benefits from its investment; thus it is considered that knowledge which spills over firm’s boundaries happens involuntarily. However, voluntary knowledge flows can occur if firms decide deliberately to cooperate in order to carry out innovation projects. Although cooperation between firms is beyond the scope of this study, voluntary knowledge flows are going to be taken under consideration when internal transfers are analysed, since the benefits from these internal collaborations are going to remain inside the company (see Chapter 5 for full details). All in all, the diffusion of knowledge can come about in different ways: movements of workers between firms, scientific articles in journals, conferences, informal communications among scientists, disclosure of patents, reverse-engineering, etc. The result, however, is the same: one firm uses the knowledge generated by others without paying for it directly. Nonetheless, the acquisition of external knowledge is not always free. According to Cohen and Levinthal (1989), firms need to be able to recognize external information in order to absorb it and use it for their own benefit. Being exposed to external knowledge is not enough to acquire it. In their seminal article, the authors develop the notion of “absorptive capacity”. This ability is acquired through its own investments in R&D, thus firms with greater technological capital are the ones who obtain the most benefit from external knowledge. Finally, it should be borne in mind that, as knowledge can be transmitted through many different channels, measuring spillovers becomes a complicated task. Thus, despite their recognised importance, there is no established method to quantify them. In fact, several proxies have been used. 10.
(24) in empirical studies to approximate such effects, having a variety of different conclusions as a result (see Chapter 3 for a literature review). Therefore, although the impact of spillovers on firm productivity have been widely analysed, this topic still continues to catch researchers’ attention in both innovation economics as well as industrial organization literature. Capturing knowledge flows and their impact on firms’ performance, as well as firms’ innovative performance is a challenge to be faced. That is why this dissertation will humbly try to shed some light on this issue.. 1.3 Outline of the thesis and research questions As discussed above, this thesis intends to provide a deeper understanding of the role played by knowledge flows on the relationship between innovation and productivity. Below is a summary of the content of each chapter, along with the research questions that this dissertation seeks to address. First of all, Chapter 2 presents the data employed in this thesis. The Technological Innovation Panel (PITEC) is described in detail, highlighting its advantages. In addition, evidence for the period under analysis is presented. Secondly, Chapter 3 analyses the impact that R&D expenditure and intraand inter-industry externalities have on Spanish firms’ performance. While there is an extensive literature analysing the relationship between innovation and productivity, there are far fewer studies in this particular area examining the importance of sectoral externalities, especially focused on Spain. One novelty of this study, conducted for the industrial and service sectors, is that it considers the technology level of the sector in which the firm operates. Following the literature on spillovers, an extended CobbDouglas production function is presented. The Olley and Pakes (1996). 11.
(25) estimator is applied to control for both selection bias and simultaneity problems providing consistent estimates. Research questions Chapter 3: (i) Does the impact of innovation on firm performance differ according to a firm’s technology level? (ii) Are Spanish firms able to benefit from externalities? (iii) If so, do these benefits vary according to a firm’s technology level?. Thirdly, Chapter 4 improves and extends the previous chapter by using a structural model to analyse the impact of innovation activities and externalities on the productivity of Spanish firms. To the best of our knowledge, no previous paper has examined spillover effects by adopting such an approach. This chapter, therefore, is intended to determine the extent to which external knowledge may affect both firms’ behaviour (first stage of the model) and firms’ performance (last stage). Additionally, the firm’s technology level is taken into account in order to ascertain whether there are any differences in this regard between high-tech and low-tech firms both in industrial and service sectors. Research questions Chapter 4: (i) Is the firm’s decision to engage in R&D activities or not affected by what other firms in its sector do? (ii) Do Spanish firms benefit from innovations carried out by the rest of the firms in its sector and in other sectors?. After having investigated the relevance of external knowledge flows, Chapter 5 aims to analyse the extent to which internal knowledge flows may have an impact on a firm’s innovative performance. As most innovation literature has focused its attention on external knowledge transfers, internal knowledge flows have faded into the background.. 12.
(26) However, the transference of information and experience within firms can improve their technological performance, impacting positively on their innovativeness and boosting its innovative sales. Voluntary and involuntary knowledge flows are taken under consideration in this chapter as well as firm’s absorptive capacity. Research questions Chapter 5: (i) Are internal knowledge flows (voluntary and involuntary) important for firm’s innovative performance? (ii) Does this impact differ depending on a firm’s absorptive capacity?. Finally, Chapter 6 summarises the main conclusions and draws some policy implications.. 13.
(27) 14.
(28) Chapter 2: Data. 15.
(29) 16.
(30) 2.1 The Technological Innovation Panel (PITEC) The dataset used is the Technology Innovation Panel (PITEC) 4 , which provides information on the innovation activities of Spanish firms. The National Institute of Statistics (INE), in consultation with a group of experts and under the sponsorship of the Spanish Foundation for Science and Technology (FECYT) and the Foundation for Technological Innovation (COTEC), is responsible for building up this database. PITEC has a panel structure containing information on about 12,000 firms over time. This information comes from successive waves of the Spanish Innovation Survey which is based on the Community Innovation Survey (CIS) following the guidelines of the Oslo Manual (OECD, 2005) and Frascati Manual (OECD, 2002) using a standardized questionnaire. Although these surveys are carried out every two years in most European countries, it is conducted yearly in Spain. Participation in the Spanish Innovation Survey is mandatory. Firms receive the questionnaires via mail and they are requested to complete them in fifteen days. Since 2009 some companies have the option to perform the survey on the Internet. CIS surveys carried out around Europe have proved to be a powerful tool to study innovation activities, and most papers analysing this topic employ CIS type data. In the case of Spain, PITEC has been used in pioneering innovation studies over the last years (see for instance, García-Vega and Huergo, 2011; Montoro-Sánchez, et al., 2011; Nieto and Rodriguez 2011; Santamaría et al., 2012; Trigo and Vence, 2012; Herrera and SánchezGonzález, 2013; Trigo, 2013 to name a few). The reason is that it provides information on individual firm characteristics (employment, sales, exports, 4. Available on the http://icono.fecyt.es/PITEC/Paginas/descarga_bbdd.aspx. 17. FECYT. website:.
(31) the market in which the firm operates, industry sector, etc.), along with detailed information on innovation activities. For instance, it offers information on different types of innovation expenditures as well as innovation outputs, cooperation, barriers to innovation, public financial support to engage in innovation activities, etc. PITEC is made up of four non-excludable samples: (i) firms with 200 or more employees, (ii) firms with internal R&D expenditures, (iii) firms with fewer than 200 employees with external R&D expenditures but which carry out no internal R&D, and (iv) firms with fewer than 200 employees with no innovation expenditures. Although it is carried out since 2003, the information for that year has a severe limitation (only includes samples (i) and (ii)). The restriction was overcome next year incorporating the four samples mentioned above. For that reason, only data from 2004 is used in this thesis. For the analysis carried out in the upcoming chapters, a filtering process is undertaken. In particular, those observations with any kind of incident (for instance, confidentiality problems, takeovers, mergers, employment incidents, etc.) are eliminated from the sample. Additionally, those observations containing obvious anomalies, such as, null sales are also deleted. Following the population defined in the Spanish Innovation Survey, only firms with ten or more employees are included in the analysis. Furthermore, the sample is restricted to firms belonging to the manufacturing and services sectors (as can be seen in Table 2.1), whereas the primary and construction sector are excluded from the analysis. Besides that, the influence of extreme values has been treated to avoid estimation problems. In particular, those observations of physical capital and innovation expenditures (including R&D) which are two times the volume. 18.
(32) of sales have been replaced with this value (see Table A.1 in Appendix). The eventual sample is different in each chapter according to the information available when the papers were written. On the other hand, PITEC can be divided up according to different factors of interest. In the first two chapters of this thesis, the technology level of the sector in which the firm operates is considered. Following the Eurostat classification, firms can be group into the following categories: (i) low and medium-low tech manufacturing industries (LTMI), (ii) medium-high and high-tech manufacturing industries (HTMI), (iii) non-knowledge-intensive services (NKIS), and (iv) knowledge-intensive services (KIS). Table 2.1 provides the correspondence between PITEC and NACE classification by technology level. Finally, PITEC has a triple advantage. Firstly, it is based on a standardised questionnaire, enabling comparisons with other studies. Secondly, it provides information on both the industrial and service sectors. As will be explained in the upcoming chapters, most studies in Spain focus solely on the manufacturing sector, generally using the dataset Encuesta sobre Estrategias Empresariales (ESEE) 5 . PITEC, however, makes possible to overcome this limitation including the service sector under analysis. Finally, it contains a high level of sectoral information covering 55 sectors (following NACE Rev 1.1). This level of detail enables a rich study to be undertaken, examining differences in behaviour between sectors with. 5. The ESEE is a firm-level survey of Spanish manufacturing which has been collecting annual information since 1990.. 19.
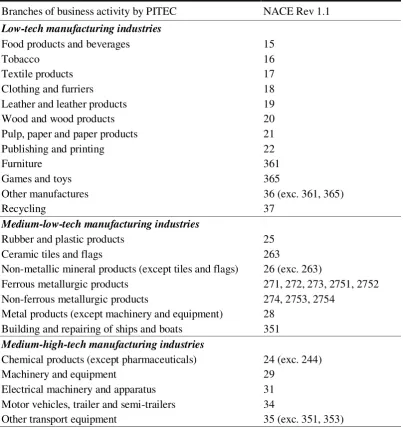
(33) different technology levels and, in turn, making a more interesting study of inter-industry externalities possible (Chapters 3 and 4) 6. Table 2.1 Industry classification according to technological intensity Branches of business activity by PITEC. NACE Rev 1.1. Low-tech manufacturing industries Food products and beverages Tobacco Textile products Clothing and furriers Leather and leather products Wood and wood products Pulp, paper and paper products Publishing and printing Furniture Games and toys Other manufactures Recycling Medium-low-tech manufacturing industries Rubber and plastic products Ceramic tiles and flags Non-metallic mineral products (except tiles and flags) Ferrous metallurgic products Non-ferrous metallurgic products Metal products (except machinery and equipment) Building and repairing of ships and boats Medium-high-tech manufacturing industries Chemical products (except pharmaceuticals) Machinery and equipment Electrical machinery and apparatus Motor vehicles, trailer and semi-trailers Other transport equipment. 15 16 17 18 19 20 21 22 361 365 36 (exc. 361, 365) 37 25 263 26 (exc. 263) 271, 272, 273, 2751, 2752 274, 2753, 2754 28 351 24 (exc. 244) 29 31 34 35 (exc. 351, 353) To be continued on the next page. 6. It is worth mentioning that PITEC is representative at sectoral level, but not at regional level. For that reason, spatial analysis cannot be carried out.. 20.
(34) Table 2.1 – continued from the previous page Branches of business activity by PITEC. NACE Rev 1.1. High-tech manufacturing industries Manufacture of pharmaceutical products Office machinery and computers Electronic components Radio, TV and communication equipment and apparatus Medical, precision and optical instruments, watches and clocks Aircraft and spacecraft Non-knowledge-intensive services Sales and repair of motor vehicles Wholesale trade Retail trade Hotels and restaurants Transport Supporting and auxiliary transport activities, travel agencies Knowledge-intensive services Post Telecommunications Financial intermediation Real estate activities Renting of machinery and equipment Computer activities Other related computer activities Research and development Architectural and engineering activities Technical testing and analysis Other business activities Education Motion picture, video and television programme production Programming and broadcasting activities Other human health and social activities Source: PITEC and Eurostat.. 21. 244 30 321 32 (exc. 321) 33 353 50 51 52 55 60, 61, 62 63 641 642 65, 66, 67 70 71 722 72 (exc.722) 73 742 743 74 (exc. 742, 743) 80 (exc. 8030) 921 922 85, 90, 91, 92 (exc. 921,922), 93.
(35) 2.2 Innovation and productivity As mentioned previously, PITEC offers highly detailed information on innovation activities. It includes several indicators of innovation (from both the input and output sides) as well as of other related variables. In this section definitions of the main variables of interest related to innovation and productivity are presented (however, see each chapter for a detailed definition of all the variables used in the econometric analyses). First of all, it is worth bearing in mind just how the questionnaire itself is organized. At the outset, firms are asked to answer a set of general questions: that is, to provide information about their business activity, ownership (public, private, etc.), year of creation, sales, exports, number of employees, distribution of employees by level of studies, geographical market in which the firm operates (local, national, European, etc.), innovation expenditures, personnel dedicated to R&D activities, financial support for conducting innovation activities, etc. 7. Firms are then questioned about their innovation activities. They are specifically asked if they have introduced a product or process innovation or if they have undertaken an innovation project in the preceding three years (either one that is still in progress or that has subsequently been abandoned). These questions serve as a filter, so only those firms that have initiated an innovation project (regardless of its success and regardless of whether it remains incomplete or has been abandoned) go on to answer a. 7. Unlike PITEC, in CIS questionnaires items related to innovation expenditures or public funding are asked only once firms have confirmed their engagement in innovation activities.. 22.
(36) series of additional questions 8. The additional questions are concerned with finding out about any cooperation agreements they might have signed in order to carry out innovation activities, sources from which firms can obtain information when undertaking or completing innovation projects and the different objectives pursued in their undertaking of innovation activities. Finally, all firms are requested to respond to an additional set of questions, some of which are related to innovation. Thus, for example, they are asked to identify factors hampering innovation activities 9 and about their use of different innovation protection methods. Other questions address nontechnological. innovations,. including,. organizational and. marketing. innovations. 2.2.1 How to measure innovation and productivity with PITEC According to PITEC, innovation activities include all the scientific, technological, organizational, financial and marketing steps taken in developing or implementing innovations. For that reason, they are known as “innovation inputs” in the literature. Although of these inputs, R&D investment is usually the most important, it constitutes just one of them. Table 2.2 outlines the different types of innovation expenditures and includes a corresponding brief description.. 8. R&D expenditure is by definition an innovation activity. Therefore, R&D performers are considered to be firms with innovation activities and so are required to respond to the additional set of questions. 9. The fact that this question is asked to the whole sample (not only to firms with innovation activities) has generated counter-intuitive results in the literature of obstacles to innovation using CIS type data. The reason is that, in general, innovative firms are the ones who perceive these barriers (see Savignac, 2008, and D’Este et al., 2008).. 23.
(37) Table 2.2 Innovation activities Innovation activities In-house R&D External R&D Acquisition of machinery, equipment and software Acquisition of external knowledge (not included in R&D) Training for innovative activities Market introduction of innovations Design and others. Definition Creative work undertaken within the enterprise to increase the stock of knowledge for developing innovations. Same activities as above, but performed by other enterprises (including other enterprises or subsidiaries within the group) or by public or private research organizations and purchase by the firm. Acquisition of advanced machinery, equipment (including computer hardware) or software to produce innovations. Purchase or licensing of patents and non-patented inventions, know-how, and other types of knowledge from other enterprises or organizations for the development of innovations. Internal or external training for firm’s personnel specifically for the development or introduction of innovations. Activities for the market introduction of firm’s innovation, including market research and launch advertising. Activities to design, improve or change the shape or appearance of innovations, and other activities to implement innovations (not included in the previous categories).. Source: PITEC and CIS.. The outcome of investment in innovation activities is an innovation, referred to as the “innovation output”. Here, two types of innovation are considered: product and process innovations 10. PITEC defines a product innovation as the market introduction of a new, or significantly improved, good or service, in terms of its basic characteristics, technical specifications, incorporated software or other components, or user friendliness. It can be originally developed by the firm or by others, but it has to be new to the firm in question, although not necessarily to the market. As such, a distinction can be drawn between product innovations that are new to the firm and the market (what some authors refer to as “radical” or. 10. PITEC also provides information about non-technological (organizational and marketing) innovations as well as about patents.. 24.
(38) “true” innovations) and product innovations that are new only to the firm (or “incremental” innovations or “imitations”). Indeed, PITEC provides information about their respective economic impacts; that is, the percentage of total sales attributable to true innovations and the percentage attributable to incremental innovations. A process innovation, by contrast, is defined as the implementation of a new, or significantly improved, production process, distribution method or supporting activity 11 . As with a product innovation, it may have been developed by the firm or by others and, while it has to be new to the firm, it does not have to be new to the market. It is worth mentioning that while input innovation variables refer to the current period (t), innovation output indicators refer to the preceding three years [t-2, t]. The concept of productivity has been defined in many different ways in the literature, the definition depending basically on the availability of data. Here, the information available on PITEC allows us to compute labour productivity 12 , a measure that has been widely used in the literature to approximate productivity, especially by those authors that use CIS data. Examples of studies adopting this approach include Harhoff (1998) for Germany; Los and Verspagen (2000) for the USA; Lotti and Santarelli (2001) for Germany and Italy; Wakelin (2001) for the UK; Vivero (2002) for Spain; Aiello and Cardamore (2005, 2008) for Italy; Ballot et al. (2006) for France and Sweden; Kafouros and Buckley (2008) for the UK; Mate. 11. Purely organizational innovations are excluded.. 12. PITEC does not contain any data on intermediate inputs or any information from which to build input cost shares, which would be required to compute the total factor productivity (TFP).. 25.
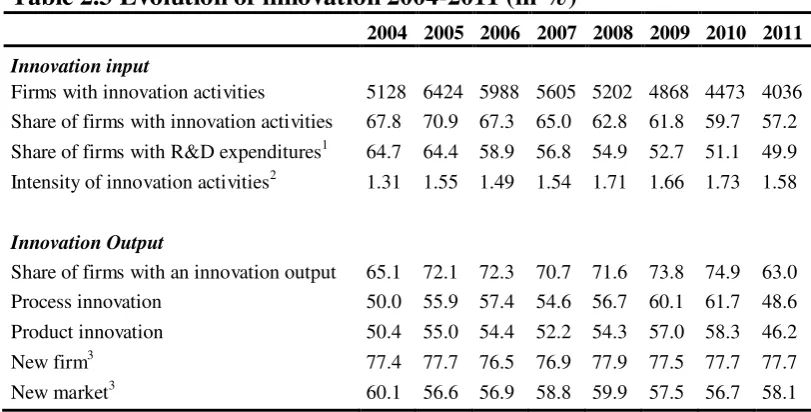
(39) and Rodriguez (2008) for Spain; Ortega-Argiles (2010, 2011) for Europe and Segarra-Blasco (2010) for Catalonia. Given that PITEC is the Spanish version of the CIS questionnaire, labour productivity – defined as firm sales per employee – is adopted here. 2.2.2 Evidence for the period 2004-2011 In this section the evolution taken by innovation and productivity is presented, along with evidence of the level of technology of the sector in which firms operate, to determine whether differences exist with regard to this factor. Table 2.3 Evolution of innovation 2004-2011 (in %) 2004 2005 2006 2007 2008 2009 2010 2011 Innovation input Firms with innovation activities Share of firms with innovation activities. 5128 6424 5988 5605 5202 4868 4473 4036 67.8 70.9 67.3 65.0 62.8 61.8 59.7 57.2. Share of firms with R&D expenditures1 Intensity of innovation activities2. 64.7 1.31. 64.4 1.55. 58.9 1.49. 56.8 1.54. 54.9 1.71. 52.7 1.66. 51.1 1.73. 49.9 1.58. Innovation Output Share of firms with an innovation output Process innovation. 65.1 50.0. 72.1 55.9. 72.3 57.4. 70.7 54.6. 71.6 56.7. 73.8 60.1. 74.9 61.7. 63.0 48.6. Product innovation. 50.4. 55.0. 54.4. 52.2. 54.3. 57.0. 58.3. 46.2. New firm3 New market3. 77.4 60.1. 77.7 56.6. 76.5 56.9. 76.9 58.8. 77.9 59.9. 77.5 57.5. 77.7 56.7. 77.7 58.1. Notes: Input innovation variables refer to year t, while innovation output indicators refer to the period [t-2, t]. (1) It includes internal and external R&D. (2) Intensity is defined as total innovation expenditures over sales. (3) Share of product innovators with an innovation new only to the firm (market). Source: PITEC; own calculations.. As shown in Table 2.3, the share of firms reporting involvement in innovation activities has fallen since 2005 as has the share of firms investing in R&D. As can be seen, most firms engaging in innovation do so, at least, in R&D (but not exclusively), with only about 7% of firms engaging in innovation activities other than R&D. Interestingly, even. 26.
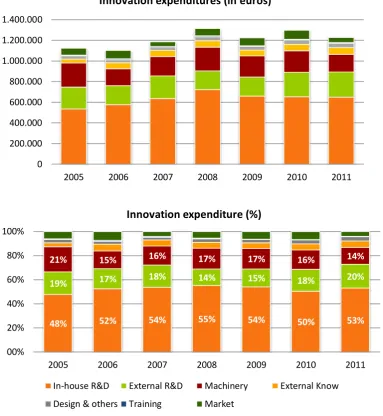
(40) though the proportion of innovative firms has decreased, the intensity of investment has risen. In particular, since 2008 the percentage of innovation expenditures over sales has presented a higher coefficient than in earlier years (for instance, total innovation expenditures represented 1.73% of sales in 2010). However, in 2011 this figure had fallen to levels comparable with those for 2007. Figure 2.1 allows us to analyse the distribution of innovation expenditure and its intensity over the period 2005-2011 13. The first graph indicates that, in real terms, innovation spending has risen, since the average innovation expenditure in 2011 was higher than that in 2005. The second graph shows that the distribution seems to have remained stable over time. Specifically, around three quarters of total innovation expenditure is dedicated to R&D (internal and external), some 17% to the acquisition of machinery, equipment and software, with the remaining being distributed among the other four categories. Finally, Figure 2.2 indicates that, in general, R&D (internal and external) accounts for a large proportion of the innovation intensity, followed by investment in machinery, equipment and software. In-house R&D intensity presented a positive trend up to 2008 before falling. Similar results can be found for investment in machinery, while the opposite is true for external R&D intensity, which has increased after 2008. An examination of the innovation output measure (see Table 2.3) indicates that, on average, around 70% of firms have made at least one innovation in the period 2004-2011, the percentage being slightly higher for process than for product innovations. In terms of novelty, about 77% of product innovators have developed a product that was new to the firm (though not. 13. Information on training, market, design and other innovation activities is available from 2005 onward.. 27.
(41) to the market), while this number fell to 58% when considering a “true” innovation. Figure 2.1 Distribution of innovation activities. 2005-2011 Innovation expenditures (in euros) 1.400.000 1.200.000 1.000.000 800.000 600.000 400.000. 200.000 0 2005. 2006. 2007. 2008. 2009. 2010. 2011. Innovation expenditure (%) 100% 80%. 21%. 15%. 16%. 17%. 17%. 16%. 14%. 60%. 19%. 17%. 18%. 14%. 15%. 18%. 20%. 48%. 52%. 54%. 55%. 54%. 50%. 53%. 2005. 2006. 2007. 2008. 2009. 2010. 2011. 40% 20% 00% In-house R&D. External R&D. Machinery. Design & others. Training. Market. Source: PITEC, own calculations.. 28. External Know.
(42) Figure 2.2 Innovation intensity. 2005-2011 2,0%. 1,5%. 1,0%. 0,32%. 0,22%. 0,29%. 0,25%. 0,74%. 0,78%. 2005. 2006. 0,5%. 0,30%. 0,28%. 0,28%. 0,23%. 0,25%. 0,31%. 0,31%. 0,83%. 0,94%. 0,90%. 0,87%. 0,84%. 2007. 2008. 2009. 2010. 2011. 0,24% 0,28%. 0,22%. 0,0%. In-house R&D Design & others. External R&D Training. Machinery Market. External Know. Source: PITEC and own calculations.. Figure 2.3 shows a fall in productivity between 2005 and 2009, at which point it began to climb. As discussed in the first chapter, however, this ratio may have been affected by the evolution of employment. Specifically, the rise recorded in recent years could be due to a fall in the number of employees as opposed to an actual increase in sales. The information supplied by PITEC does not seem to capture this trend over the last few years (i.e., no reduction in employment); however, it should be borne in mind that these graphs show the sample aggregated. In other words, it is possible that in recent years some firms might have suffered the effects of the economic crisis and reduced the size of their workforce (and/or their sales), especially small and medium-sized firms, whereas large companies with huge workforces may not have experienced the same difficulties.. 29.
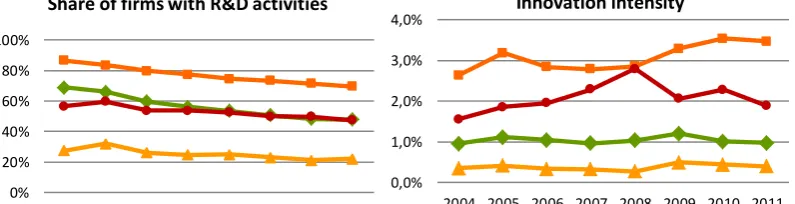
(43) Figure 2.3 Productivity (Sales/Employment) 2004-2011 255.000 250.000 245.000 240.000 235.000. 230.000 225.000 220.000. 2004. 2005. 2006. 2007. 2008. 2009. 2010. 2011. Source: PITEC; own calculations.. Finally, an examination is undertaken to determine whether there are differences according to the level of technology of the sector in which a firm operates. First of all, Figure 2.4 shows that high-tech manufacturing industry (HTMI) has the greatest share of firms engaged in R&D activities, while firms belonging to the non-knowledge intensive services (NKIS) have the lowest proportion. It can also be seen that the advanced sectors (HTMI and KIS) are those with the highest ratios of investment in innovation (over sales) and the ones that have recorded some growth during this period. For instance, high-tech manufacturing firms increased their innovation intensity from 2.64% in 2004 to 3.46% in 2011. In contrast, less advanced sectors (LTMI and NKIS) present the lowest levels of intensity and a constant ratio over the period. On the output side, it can be seen that the proportion of firms achieving an innovation (product or process) was, on average, 84% for high-tech manufacturing firms, 74% for low-tech manufacturing firms, 66% for knowledge intensive services and 46% for non-knowledge intensive services. As shown, up to 2010, there was a positive evolution, regardless of the level of technology; however, since that date, the percentage of innovators has fallen. Finally, overall productivity is highest. 30.
(44) in the manufacturing sector, while service firms, especially knowledgeintensive service firms, present the lowest values. Figure 2.4 Evolution according technology level Share of firms with R&D activities. Innovation intensity. 4,0%. 100%. 3,0%. 80%. 2,0%. 60% 40%. 1,0%. 20% 0,0%. 0% 2004 2005 2006 2007 2008 2009 2010 2011. 2004 2005 2006 2007 2008 2009 2010 2011. Sales/L. Share of innovators. 400.000. 100% 80%. 300.000. 60%. 200.000. 40% 100.000. 20% 0%. 0 2004 2005 2006 2007 2008 2009 2010 2011. 2004 2005 2006 2007 2008 2009 2010 2011. Source: PITEC; own calculations.. In short, the results presented in this chapter highlight that there are, indeed, differences in both innovation input/output and in productivity with the level of technology employed by a firm. As a result, this factor is taken into consideration in the following chapters.. 31.
(45) 32.
(46) Chapter 3: R&D, firm performance and spillovers. 33.
(47) 34.
(48) 3.1 Introduction As discussed in the introduction of this dissertation, the decline in GDP highlights the importance of innovation as an economic growth factor. This raises a number of questions that need to be addressed: Does Spain suffer from a lack of innovation activity? Or is Spain unable to translate its investments into production growth? This last issue is critical, since it is widely acknowledged that if a firm can increase its productivity it is likely to gain in competitiveness, an essential attribute in today’s globalized world. In recent decades, the number of studies examining the relationship between innovation and firm productivity has increased (see following section for a literature review). In general, the findings stress the importance of R&D as a determinant of economic performance. According to the Frascati Manual (2002): “Research and experimental development (R&D) comprise creative work undertaken on a systematic basis in order to increase the stock of knowledge, including knowledge of man, culture and society and the use of this stock of knowledge to devise new applications”. As stated by the Lisbon Strategy, all EU members were expected to be investing 3% of their GDP in R&D activities by 2010. Since most countries failed to reach the target, the Europe 2020 Strategy, approved in 2010, opted to maintain the same objective for the next ten years. Thus, the member states are expected to invest 3% of their GDP in R&D activities by 2020. Despite this, a number of countries have adopted their national R&D intensity targets, which is the case of Spain. Specifically, the Spanish government has set an R&D intensity target of 2% (0.8% of this investment to be made by the public sector 14 and 1.2% by the business sector).. 14. Public sector includes the government and the higher-education sector.. 35.
(49) As shown in Figure 3.1, up until 2009 Spain presented a positive evolution in its investment in R&D. The European Commission reported that Spanish R&D intensity increased with an annual average growth of 4.3% over the period 2000-2009, well above the European average. However, after that date, and contrary to the overall trend in Europe, Spanish R&D intensity has fallen reaching just 1.3% of GDP in 2012 15. Figure 3.1 Gross domestic expenditure on R&D (% of GDP). 2,5. 2,0 1,5. 1,0 0,5 0,0 2000 2001 2002 2003 2004 2005 2006 2007 2008 2009 2010 2011 2012. European Union (27). European Union (15). Spain. Source: Eurostat; own representation.. In general, R&D investment has grown substantially in Spain over the last decade. Nevertheless, despite this positive evolution, investment levels are still below European levels (2.08% for EU-27 and 2.16% for EU-15 in 2012) and fall well short of meeting the target set for 2020 (see Figure 3.2).. 15. This figure can be broken down according to the source of funding: 0.69% was invested by the business sector and 0.61% by the public sector (0.25% by the government and 0.36% by higher education) in 2012.. 36.
(50) Figure 3.2 Gross domestic expenditure on R&D in 2012 (% of GDP). Cross-country comparison. 4,0 3,5. EU Target =3%. 3,0 2,5. Spanish Target = 2%. 2,0. 1,5 1,0 0,5. Cyprus. Romania. Latvia. Bulgaria. Greece. Croatia. Slovakia. Malta. Poland. Lithuania. Italy. Spain. Hungary. Portugal. Luxembourg. United Kingdom. Ireland. Netherlands. Czech Republic. Estonia. France. Belgium. Austria. Slovenia. Germany. Denmark. Finland. Sweden. 0,0. Source: Eurostat; own representation.. A considerable amount of this R&D investment is undertaken by the business sector. Specifically, roughly two thirds of the total R&D intensity should be carried out by the private sector. Figure 3.3 highlights two facts: first, Spain’s business R&D to GDP ratio is much lower than that of the European Union and, second, private R&D investment has been affected by the economic crisis. Although, in general, Spain presents a positive evolution, since 2008, investment in R&D has gone into decline, unlike in the rest of Europe, where investments present a positive trend. Based on the national target, Spain faces a major challenge with the private sector having to increase its R&D intensity from 0.61 in 2012 to 1.20% in 2020.. 37.
(51) Figure 3.3 Business sector expenditure on R&D (% of GDP) 1,6. 1,4 1,2 1,0 0,8 0,6 0,4. 0,2 0,0 2000 2001 2002 2003 2004 2005 2006 2007 2008 2009 2010 2011 2012. European Union (27). European Union (15). Spain. Source: Eurostat; own representation.. On the basis of the previous discussion, it is essential to gain a better picture of Spain’s R&D-productivity relationship if we are to further our understanding of it and if we hope to design policies that can raise productivity, especially in the current economic climate. For this reason, the primary goal of this chapter is to analyse the relationship between R&D and firm performance in Spain over the last few years. In the light of previous studies that report differences in the productivity gains attributable to innovation in accordance with a firm’s level of technology, and given that few studies of the Spanish case take this factor into account, here we assess whether differences can be found between high- and low-tech firms. Additionally, as explained in section 1.2, it should be borne in mind that the knowledge derived from a firm’s investment in innovation is likely to spill over, given its inability to reap all the benefits from its investment. Therefore, when examining the impact of innovation on productivity, the diffusion of the innovation and any externalities generated also need to be. 38.
(52) taken into account. Several papers have analysed the importance of spillovers; however, there has been little discussion about this aspect from a sectoral perspective, particularly in Spain. Thus, the second goal of this chapter is to study the extent to which a firm’s performance is influenced by the innovation carried out by other firms in the same sector (intra-industry externality) or by the innovation activities of firms in other sectors (interindustry externality). The study is conducted using PITEC (see Chapter 2 for a full description of the database) for the period 2004 to 2009. The Olley and Pakes (1996) estimator is adopted for the econometric analysis. By doing so, unobserved heterogeneity, simultaneity issues and selection biases can be accounted for. These are common problems that arise when a productivity analysis is carried out. However, by using this method, consistent and reliable coefficients can be obtained. To sum up, the aim of this chapter is twofold. First, it seeks to analyse the extent to which the technology level of Spanish firms affects their returns from their investment in innovation. Second, it assesses how this factor influences potential knowledge flows from other firms’ innovations, both intra- and inter-industry externalities. Thus, this chapter aims to answer the following questions: (i) Does the impact of innovation on firm performance differ according to a firm’s level of technology? (ii) Are Spanish firms able to benefit from externalities? (iii) And if so, do these benefits vary according to a firm’s technology level? This chapter is organized as follows. Section 3.2 presents the literature review, section 3.3 the model, section 3.4 describes the variables used in the analysis, section 3.5 shows the results, section 3.6 presents some further explorations and finally the conclusions are drawn in section 3.7.. 39.
(53) 3.2 What do we know so far? Since the pioneering work of Griliches (1979, 1986), the relationship between innovation and productivity has been widely studied by many authors at both national and sectoral levels as well as at the firm level. The well-known Cobb-Douglas production function is normally used to conduct the empirical analysis, with the traditional inputs of physical capital and labour being extended to include innovation expenditures. In general, the evidence reveals a positive and significant relationship between innovation and productivity at the firm level (see Hall and Mairesse, 1995 for France; Harhoff, 1998 for Germany; Lotti and Santarelli, 2001 for a comparative study of Germany and Italy; Parisi et al., 2006 for Italy and Ballot et al., 2006 for France and Sweden; Ortega-Argilés et al., 2010 and 2011 for European firms). However, the results obtained seem to depend on the geographical area being analysed as well as on the nature of the database and methodology used. It is worth mentioning that most of these articles undertake cross-country analyses, and pay scant attention to the impact that the sector in which a firm operates might have. As stressed in the previous section, the first goal in this chapter is to determine whether there are any differences in the impact of innovation on productivity depending on the level of technology of the firm’s sector. Empirical evidence to date suggests that the impact of R&D expenditures on a firm’s productivity is more marked in high-tech sectors than it is in their low-tech counterparts (see Verspagen, 1995 for nine OECD countries; Tsai and Wang, 2004 for Taiwan; Ortega-Argilés et al., 2010 and 2011 for European firms). In addition, this chapter seeks to determine if the stock of knowledge available at the firm level is dependent on both the firm’s own innovation. 40.
(54) and on externalities. As discussed above, the benefits derived from innovation in a firm (or sector) are likely to spill over because of the firm’s inability to channel all of the benefits obtained from its investment effort. Thus, a firm’s performance can be explained by its own knowledge as well as by the knowledge generated somewhere else which is in the public domain. For this reason, externalities need to be taken into consideration. From an empirical perspective, most articles employ a production function where spillovers are included as an additional input (following Griliches, 1979). Although there has been a considerable number of studies that have analysed the impact of R&D spillovers on productivity, a general consensus has yet to be reached on just what that effect might be. Despite the positive impact reported by some authors (Griliches, 1992; Nadiri, 1993; Cincera, 2005 for a worldwide analysis; Wiese, 2005 who reviews various studies conducted in the ‘80s and ‘90s; Aiello and Cardamone, 2005 and 2008; Cardamore, 2012 for Italy and Bloch, 2013 for Denmark), others draw different conclusions. For example, Klette (1994), in an examination of the effect of R&D spillovers in Norway for the period 1975-1986, concludes that the impact depends on the technological level of the recipient firm. Thus, only high-tech industries are able to benefit from spillovers; low-tech firms, by contrast, present a negative coefficient. Similarly, Los and Verspagen (2000) study the impact of technological spillovers on the productivity of 7,000 American firms between 1977 and 1991. They consider four definitions of spillovers and offer different conclusions depending on technology level and the kind of estimation conducted (within or between). While within estimations present a positive impact of spillover regardless of the definition adopted, between estimations lead to positive, non-significant and negative results. Harhoff (2000) analyses 443 German firms for the period 1977-1989 and finds that the effect of spillovers is. 41.
(55) positive only for high-tech firms and that it is conditioned by the firm’s own R&D intensity. However, negative elasticities are reported for firms in less sophisticated industries. Wakelin (2001) investigates the impact of intraand inter-industry spillovers on the productivity of 170 UK manufacturing firms between 1988 and 1996. Although spillovers are not a relevant factor in the enhancement of productivity in general, when firms are separated according to their innovation history new evidence comes to light. Specifically, firms belonging to sectors defined as “net users of innovation” present a strong positive impact of intra-industry spillovers. Kafouros and Buckley (2008) using a balanced panel of 117 UK manufacturing firms for the period 1995-2002 analyse intra- and inter-industry externalities according to technology level and firm size. Their findings show that hightech firms are able to benefit from the innovation of others; whereas lowtech firms present a negative coefficient. Firm size is also a relevant factor in this study, with small firms increasing their labour productivity with both types of externalities, unlike large firms which record a negative impact from intra-industry externalities. Finally, Medda and Piga (2014) study the impact of intra- and inter-industry spillovers on the TFP growth of 3,077 Italian firms from 1998 to 2000. While intra-industry spillovers present a clearly positive coefficient, inter-industry externalities show different effects. Specifically, spillovers originating from supply sectors have a positive impact whereas knowledge coming from customers presents a negative coefficient. Overall, the evidence is unclear, with spillovers having an apparently heterogeneous effect (being positive, negative or not significant). Yet, it should be borne in mind that the results are conditioned by the sector or country under analysis and that they are highly dependent on the way in which externalities are quantified. In this regard, it seems that most papers. 42.
(56) opt to use a weighted sum of R&D as a measure of spillover. However, there is no general agreement on how these weights should be defined. The guiding idea is that the closer two firms are the more likely it is that spillovers will occur 16. This proximity can be measured in different ways with technological similarity, geographical distance and commercial relations being the principal types considered in the literature. In the case of the former, technological proximity, most papers follow Jaffe (1986), who defines proximity between firms using patent data (Cincera, 2005). Others, however, employ a set of firm characteristics in their approximations (Aiello and Cardamore, 2008). The strand of the literature that uses geographical distance to formalise spillovers relies on the idea that the greater the spatial proximity the more firms can gain from each other’s knowledge 17 (Bloch, 2013). Finally, some researchers adopt an input-output approach using trade flows to weight the external pool of knowledge; thus, the more commercial relationships a firm establishes, the more it will benefit from the research activities of these other firms (Medda and Piga, 2014). To sum up, although the importance of spillovers is beyond question, how they should be measured at the micro level and what their effect is on firm performance remain far from clear. If we focus on the case of Spain, the relationship between innovation and productivity has been examined by a number of authors, who conclude that innovation has a positive impact on productivity. However, a general limitation of most of these studies is that their analyses are restricted to. 16. Interestingly, Nooteboom et al. (2007) point out that being too far apart or too close is not beneficial for a firm. If two firms have very different knowledge bases there is less chance of knowledge flowing, whereas if there are overlaps because firms are very similar technologically then there are fewer learning opportunities or complementarities. 17. Despite the importance of spatial proximity (see Audretsch and Feldman, 1996; Döring et al. 2006), its analysis lies beyond the scope of this study.. 43.
Figure


+7


Documento similar
This research focuses on increasing the available stock of knowledge with regards to assessing the resulting impact of collaboration between firms and knowledge
They show a mix behavior between specialized and diversified cities as they positively depend on city size, type of specialization and labor composition, but at the same time,
The results indicate that internal routines and processes for absorbing external knowledge help explain radical innovation as they show a significant effect of potential and
For the case of Corporate main-inventors with Academic co-inventors, patents show a basicness index that is smaller than when only Academic inventors are involved, but higher than
Regarding the correlation between loans and GDP, has been analyzed both financial flows and stocks, first by analyzing flows, there are also obtained data in conjunction
(1999) “The impact of stocks and flows of organizational knowledge on firm performance: An empirical investigation of the biotechnology industry” Strategic Management Journal,
Tecnológico de Monterrey has decided to focus this scientific activity on eight main strategic research areas, encouraging innovation, knowledge generation and knowledge transfer,
Consequently, this research will advance the literature by providing empirical evidence of the effects of location on the sustainability performance of Spanish firms through
