Analytical Models for the Multiplexing of
Worst Case Traffic Sources and their
Application to ATM Traffic Control.
r 9 f 2 r
Analytical Models for the Multiplexing of
Worst Case Traffic Sources and
their Application to ATM Traffic Control.
José M. Barceló Ordinas
This thesis has been written at Polytechnic University of Catalonia, Computer Architec-ture Department, c/ Gran Capitán, Modulo C6-E105, Barcelona E-08071, Spain,
tel : + 34 3 4016798, fax : + 34 3 4017055, e-mail : josebac.upc.es
This thesis has been promoted by:
PhD advisor: Dr. Jorge García Vidal Universidad Politécnica de Cataluña. Spai: PhD Tutor: Prof. Dr. Olga Casals Torres Universidad Politécnica de Cataluña. Spai:
Members of the PhD thesis tribunal:
Prof. Dr. Chris Blondia University of Antwerp, Belgium Prof. Dr. Jorma Virtamo Telekniikan Laboratorio, Finland
Contents
List of Figures. List of Tables. Preface.
1 Introduction. 11 1.1 Moving towards B-ISDN 11 1.2 Controlling the ATM traffic 12 1.3 Outline 13 2 Traffic Contract and Cell Delay Variation in ATM networks. 18 2.1 Traffic Contract and ATM Transfer Capabilities 18 2.2 ATM Traffic Control and Traffic Congestion Functions 22 2.3 Ruled based traffic parameters 23 2.4 Models to quantify the CDV in ATM networks 25 2.4.1 Single queues 25 2.4.2 Tandem queues 26 2.4.3 Impact of CDV on resource allocation 27 3 Cell Delay Variation introduced in a real network. EXPLOIT and BAF
Testbeds. 29 3.1 Delay and CDV in an ATM Access Network. The BAF Testbed 30 3.1.1 ATM-PON system architecture 31 3.1.2 The MAC protocol 31 3.1.3 APON slot format 33 3.1.4 The BAF Testbed 35 3.1.5 Performance of the Access Network 36 3.2 Experimental evaluation of CDV impact on ATM resource management.
4 The Benes approach applied to ATM Networks. 56 4.1 The Benes approach to the virtual Waiting Time 56 4.2 Queueing models at cell level using the Benes approach 61 4.2.1 The M/D/1 system 61 4.2.2 The N • D/D/l system 63 4.2.3 The modulated N • D/D/l system 65 4.2.4 The M + D/D/l queue system 67 4.2.5 Other queue systems at cell level 68 4.3 Queueing models at burst level using the Benes approach 68 4.4 The ballot theorem applied to periodic queues 68 4.4.1 The ballot theorem 68 4.4.2 The ballot theorem applied to the ND/D/l queue system 69 5 Multiplexing Worst Case Traffic (WCT) Sources. 71 5.1 Worst Case Traffic compatible with Leaky Bucket control 71 5.1.1 Worst Case traffics based on traffic parameters 72 5.2 Multiplexing WCT sources in a slotted queue 74 5.2.1 Waiting time Distribution 74 5.2.2 Busy periods 78 5.3 The fluid WCT model 78 5.4 Upper bound models to the WCT model 81 5.5 Performance results 82 5.6 Conclusions and comments 88 6 Other WCT models for DBR connections. 90 6.1 WCT models Poisson distributed 91 6.2 Multiplexing WCT sources with CBR traffic or Poisson Traffic 92 6.2.1 Periodic WCT traffic with periodic CBR traffic 92 6.2.2 Periodic WCT traffic with Poisson traffic 95 6.3 Multiplexing WCT or Batch sources Poisson distributed with Poisson Traffic. 96 6.3.1 Multiplexing WCT sources Poisson distributed with Poisson Traffic. 96 6.3.2 Multiplexing Batch sources Poisson distributed with Poisson Traffic. 98 6.4 Conclusions and comments 99 7 WCT in a tree network of ATM multiplexers. 100 7.1 Concentrating trees of discrete-time queues 101 7.1.1 Pooling of data from M buffers into a single buffer 101 7.1.2 Buffer length in the root queue 102 7.2 WCT multiplexing in an M-stage tree queueing network 103 7.2.1 Two-stage tree network 103 7.2.2 M-stage tree network 109 7.3 Results 109 7.4 Average queueing delay in the root queue 110
8 Resource management. 120
8.1 The concept of negligible CDV 121 8.2 Traffic shaping mechanisms 122 8.3 A simple model to study the spacing of WCT sources 123 8.4 Trade-offs in the design of a CAC combined with a Traffic-Shaping
mech-anism 125 8.5 Performance evaluation of the CAC combined with a traffic-shaper 127 8.6 Scheduling algorithms 129
8.6.1 Weighted Fair Queueing - Packet by Packet Generalized Processor Sharing 131 8.6.2 Virtual Spacing - Self-Clock Fair Queueing 133 8.6.3 Scheduling Algorithms in ATM 133 8.7 Conclusions and comments 136
9 General conclusions and comments. 139
Acronyms.
List of Figures
2.1 Generic Ceil Rate Algorithm 24
3.1 BAF access network 30 3.2 Architecture of the access network 32 3.3 Upstream transmission format 34 3.4 Downstream transmission format 34 3.5 Architecture of the access network Testbed 35 3.6 Experimental results for transfer delay: GBR reference source for 3
differ-ent bit rates 37 3.7 Experimental results for 1-pomt CDV: CBR reference source for 3 different
bit rates 38 3.8 Network configuration 39 3.9 EXPLOIT Testbed map 41 3.10 ETB configuration network 42 3.11 EPFL configuration network 43 3.12 CTD CPDF for a TUT PCR of 21.2 Mbit/s (SO'OOO cells/sec). Configuration 1.
m is the number of multiplexing stages 49 3.13 CTD CPDF for a TUT PCR of 8.98 Mbit/s (21'180 cells/sec). Configuration 1.
m is the number of multiplexing stages 49 3.14 CTD CPDF for a TUT PCR of 4.55 Mbit/s (10'731 cells/sec). Configuration 2. 50 3.15 CTD CPDF for a TUT PCR of 7.93 Mbit/s (18703 cells/sec). Configuration 2.
Comparison with M/D/l and Erlang-M models 50 3.16 CDV as a function of the number of stages for a PCR of 5448 cells/s 53
4.1 Realization of the process e(t) 57 4.2 Property 2 59 4.3 Disjoint events 61 4.4 Loss of accuracy due to cancelation of terms in the M/D/l model for p = 0.8 . . 63 4.5 Modulated process 66
5.8 Queue length CPDF for several B3, given a T=15, for WCT sources and batch
sources 84 5.9 Queue length CPDF for several periods, given a B3=5, for WCT sources and
batch sources 84 5.10 Approximating WCT system by a bound 85 5.11 Admissible load for connections with T=15 86 5.12 Scanning AAL buffers of a multimedia workstation 86 5.13 Acceptable CDV tolerance as a function of the PCR 87 5.14 CPU time as a function of the number of sources 88 5.15 CPU tune as a function of the burst size 88
6.1 Comparison between WCT analytical and WCT simulation: p = 0.6 92 6.2 Comparison between WCT analytical and WCT simulation: p = 0.8 92 6.3 Comparison between analytical and simulation: p = 0.8, Twct = Bs * 15, Tcjr=10. 94
6.4 Comparison between analytical and simulation: p = 0.8, Ttucí=100, B3=IQ,
TC6r=10. Pwct and pcbr varies 94
6.5 Comparison between analytical and simulation: pwct and pc&r fixed, T„rCt=100,
BS=W and Nwct=2, Tcbr varies 94
6.6 Buffer size as a function of the Tcbr, r„,ct=100 and 5S=10 95
6.7 Comparison between the analytical model with simulations. pp = 0.4, pwct = 0.4,
Bs varies, Twct = WBS 97
6.8 Comparison between the analytical model with simulations. pp and pwct varies.
Twct = 100. Bs = 10 97
7.1 Equivalent queue in concentrating trees 102 7.2 Equivalent queue in a tandem queue system 103 7.3 WCT and Batch periodic sources 104 7.4 Two-stage tree network 104
7.5 Cases to calculate the term R™(t,kt,nt}, (with b=l) 106
7.6 Equivalent system to calculate term £(i,ni,...,n/r,nr). a) Original system, b)
Auxiliary system, where bursts from the auxiliary second stage queues and exter-nal WCT bursts plus cells belonging to bursts that began in the previous period arrive to the auxiliary root queue, c) Auxiliary system, where only bursts from the auxiliary second stage queues and external WCT bursts arrive to the auxiliary root queue 108 7.7 Three stage network 109 7.8 Equivalent network 109 7.9 Queue Length CPDF for the root queue. Two stages. T = 15. p = 0.8 and
Bs = 4 varies 110
7.10 Queue Length CPDF for the root queue. Two stages. Ba = 4, p = 0.8 and Period
8.1 Shaper in the multiplexor only applied to high bit rate connections 126
8.2 Admissible load for a buffer size of 128 and CLR=1CT9 127
8.3 CAC algorithm flowchart 128 8.4 CAC curve for Tmai=80, Buffer Size=128 cell slots, CLR=10~9 129
8.5 Shaped traffic versus all the traffic with the former QoS conditions 129 8.6 Shaped traffic versus all the traffic with Tmai=150 connections 130
List of Tables
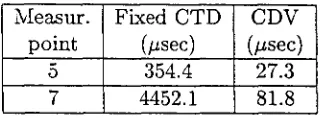
3.1 CBR sources parameters for the background traffic 44 3.2 Comparison of exact CDV-T with the simple delay approximation 48 3.3 CTD and CDV without background traffic on the ETB and EPFL 49 3.4 Measured CDV in ¿ísec (1CT6 quantile of the CTD CPDF). "na'! means
non available, the recirculation technique was not used due to high TUT PCR 51 3.5 Estimated CDV in ¿zsec (10~6 quantile of the CTD CPDF) using the
Erlang-M approximation 51 3.6 Gamma approximation in fj,sec (10~6 quantile of the CTD CPDF). "na"
means non available 52 3.7 Estimation of the CDV from a delay measurement 53 5.1 Buffer size for a quantile of the queue length distribution with e = 10~8
for several periods T and bursts sizes (Bs). . 83 5.2 Buffer size for a quantile of the queue length distribution with e = 10~8 . 84
7.1 Comparison between CBR sources and Poisson sources in a single stage. . 117 7.2 Two stage tree network with K=2 buffers and K=4 buffers that pool
the root queue, balanced load in each buffer. Comparison between CBR sources and Poisson sources 118 7.3 Two stage tree with K=2 buffers that pool the root queue, load in Q\ is
Pi = 0.2p and load in Q-¿ is p% = Q.Sp 118
Preface.
This document gathers the work of my PhD during the last years. In this time I have collaborated in fourth European projects: EXPLOIT, BAF, EXPERT and NETPERF and I have been introduced to give lectures at University in the areas of basics on oper-ating systems and basics on network computers.
With the defence of my PhD I end my fourth life cycle as a student. In every one of these cycles: primary school, secondary school, University and PhD, I have known many people and learnt from their experience and friendship. Now, It is time to acknowledge those ones that have belonged to this last cycle of my life.
Of course, first of all, I must thank my family. In my Mediterranean education family is a concept that involves not only my parents, brothers and sisters but also a set of relatives with whom I have a close relation. I would like to thank them all for supporting me during all the years of my life. They make myself feel sure.
A very special acknowledge to Olga Casals and Jorge Garcia for not only introducing me in the ATM world, but also for all the knowledge, help, advise, support, guidance, etc. they have given me in these years. It has been a pleasure to work with them.
With Fernando Cerdán and Llorenç Cerda I have shared a lot of interesting moments at University. With Llorenç I have shared the work-room for the last two years and a lot of interesting discussions. The same with Fernando. Furthermore with Fernando and Mikel Una. I have visited a good percentage of restaurants, pubs, discos, bars and other "tugurios" in Barcelona. Well. Fernando and Mikel, there are still a lot of places to "visit1'.
A special regard to Frank Kloster and Aimee Figueroa for their friendship and all the wonderful moments we have had in Barcelona. I hope that when they are far from Barcelona they will remember our friendship, although if they definitively move out to Mexico I will go from time to time. Also a kind regard to very different people that I have met or with whom I have lived in the last years: Nuria, Rosa. Cristina, Elena. Ingmar. Stephan, Katy, Masae, Gemma.
When I arrived to the department, I was confined in a big room with several students. All of them were working in projects. We call ourselves the "008 room", and spent a lot of wonderful moments. Regards to Maite, Luz, Merce, Susana, Cris, Enric. Quique. Luis, Gerard, Toni, Andres, Joan Manel, Pepe and "afines". Also those ones that did not belong to the "008" but that joined us as Josep Ramon or Jordi G. Sorry If I have missed someone.
to me in that time as OS. Also to those ones who help me in CBXC. To Marga Grimait who programmed in her PFC the scheduling simulators.
I spent my first two years working in the EXPLOIT project. My work consisted in a set of trials on ATM Traffic Control. We had to travel a week per month in average to Basel. I would like to regard all the people I met in this project: all people of ASPA (Manuela, Gabi, Max, George), people of other WPs as Thomas, Chris, Anne-Marie, Martin, Harald, Stephane, Dani, Steven, Laurie, and others that I can not remember. There were so many people in that project. I don't forget the people of my own WP: Vassilis Nellas, Antonio Martinez, Nicolas Mitrou and specially to Laurent Jaussi with whom I spent a lot time working, eating and playing sometimes squash in Basel. We also spent a lot of weekends working together, Laurent at EPFL and I at UPC. Hard days trying to get something from that platform, but we also had a lot of fun.
Other project in which I knew very nice people was BAF. We had very interesting days plenty of work and fun in Milan with Frans Fanken, Babul Miah and Steven Winstanley. Thanks also to Hans Boekhorst in ATT Huzen and Luigi Capprioti in Milan for the technical and human support in the experimental work in this project.
In projects as EXPERT and NETPERF I have also met very interesting people to whom I acknowledge, although my involvement in these projects have allowed me only to met them from time to time.
I thank to all referees that have given me some input when I have sent a paper to a con-ference and to the referees that have given me the different input and comments before the presentation of this thesis.
Chapter 1
Introduction.
1.1 Moving towards B-ISDN.
Broadband digital networks (B-ISDN) are intended to transport all kind of communica-tions services. As we move towards integration in telecommunication networks, Asyn-chronous Transfer Mode (ATM) has been proposed as the mechanism to transport data, video and voice in B-ISDN. The ATM technique offers switching based on statistical mul-tiplexing to any kind of digital communication services. Typical rates in ATM are 155,52 and 622,08 Mbps, although lower and higher rates can be utilized. In ATM, information is transmitted in the form of fixed packets called cells. The different communication services are distinguished in the way their sources produced cells (e.g. at constant bit rate as those produced by circuit-switched channels and some video coders, at variable bit rate as those ones as variable video coders or bursty data sources).
In [84"_ (see also [4]), some guidelines about the nature of broadband nature are given in the form of a classification in three service categories: interactive communications as telephony, video-conferences, transmission of live events or circuit emulation: transfer of stored information for temporary storage as bulk data transfer, off-line transfer of movies, transfer of text or pictures in databases (WWW) and finally transfer of audio and video for immediate playback. This classification is based on the timeless requirements of user applications and does not cover all kind of applications as distributed computing. Fur-thermore, there is not a clear mapping between these service categories and the ATM transfer capabilities proposed in the ITU-T 371. [1].
linked with the idea of keeping at the same time QoS objectives that are very different from one service to other. Furthermore, a network operator would like a network able to transport the maximum number of connections possible, it is to say, maximum utilization factors in each network node. Here, we have three ideas that make one to think: How is it possible to integrate services with so different traffic characteristics and different QoS requirements obtaining at the same time maximum network efficiency ? A short old question not still fully answered. That is one of the reasons of so many ATM studies in the last years.
There are so many aspects to be studied in ATM networks that it is difficult to begin to describe what has been or is being investigated in ATM: ATM switches, multiple-access protocols, ATM LAN emulation, ATM Adaptation layer protocols, Traffic Control and Congestion Control Functions, multicast, IP over ATM, etc. This thesis is centered in concepts used in Traffic Control and Congestion Control Functions. Therefore, we will focus in this area assuming that the reader knows the basics ideas behind ATM. For those ones who begin in ATM we recommend ATM publications as [47], '53] or [60].
1.2 Controlling the ATM traffic.
Traffic parameters, tolerances and Quality of Service requirements are essential in the specification and design of Traffic Control and Congestion Control Functions such as Con-nection Admission Control (CAC), Usage/ Network Parameter Control (UPC/ NPQ. Network Resource Management (NRM) or traffic shaping among others. For instance, the CAC must be able to accept or reject connections meeting the QoS objectives (e.g. a Cell Loss Ratio) required in the ATM Traffic Contract or the UPC function has to mon-itor a connection based on the specified traffic parameters and tolerances (e.g. a peak cell rate and a cell delay variation tolerance). On one hand, these parameters have to be easily understandable by the end user. On the other hand, they must be enforceable by the Control Functions and participate in resource allocation schemes. The ITU-T 371 specifies a set of traffic parameters and tolerances in order to describe the source behavior and in order to be easily used by the Control Functions: the peak cell rate, the cell delay variation tolerance, the sustainable cell rate and the burst tolerance are among them.
As another example we can think on the UPC mechanism and the Constant Bit Rate connection. The function of the UPC is to monitor that the traffic sent by a connection is according to its Traffic Contract, the PCR used in the C AC algorithm. For that pur-pose, the UPC function must enforce the defined Traffic Contract parameters and may use cell tagging or cell discarding mechanisms to mark or drop those cells that does not conform with the declared Traffic Contract. However, there are many factors that may affect the Constant Bit Rate connection making that the ingress CBR traffic is not a pure periodic traffic: AAL mechanisms, physical layer interfaces as SDH or El, access networks or previous multiplexing stages are some of the factors that may introduce jit-ter (called in ATM Cell Delay Variation) in a source. To avoid the tagging or dropping of cells of a connection that has suffered some jitter, the source declares in the Traffic Contract a Cell Delay Variation tolerance (CDV-T) that will be taken into account by the UPC mechanism. But now, due to this tolerance, there are many kind of traffic patterns that conform with the UPC definition and that have different congestion effects in the switches: pure CBR periodic traffic, CBR jittered traffic or a burst of back-to-back periodic cells can be conforming to the UPC mechanism. In fact, a CBR connection is not necessary a pure periodic source, and can be a source that transmits as a maximum cell rate its PCR. The larger the CDV tolerance is defined the higher the number of cells that will be conforming, even if the traffic pattern is very different to that expected. For instance, assuming a periodic CBR source with declared peak emission interval (the inverse of the peak cell rate) equal to 10 cell slots and a declared CDV tolerance of 100 cell slots, a leaky bucket as a UPC function might allow pass as conforming either a periodic traffic of 1 cell every 10 cell slots or a periodic traffic of 12 back-to-back cells every 120 cell slots. The congestion that would produce both kind of sources in a buffer that multiplex a given number of connections (being the system stable) is very different.
1.3 Outline.
In this thesis, we investigate the effect of multiplexing in a buffer CBR sources that have declared a peak cell rate and a CDV tolerance but that send different traffic patterns. For that purpose we have chosen a worst case traffic definition that fulfils the Traffic Contract and that it is enforceable by the UPC mechanism.
Of course, assuming traffic sources that emit back-to-back cells, we are considering a pessimistic picture of the network. We remit to the ITU-T 371 recommendation tha: literally says: "When allocating resources, the network should take into account the worst case traffic passing through UPC/NPC in order to avoid impairments to other ATM connections. The trade-offs between UPC/NPC complexity, worst case traffic and optimization of network resources are made at the discretion of network operators". As-suming that all connections can send worst case traffic at the same time can be taken as too pessimistic. However, the study of a worst case situation can give us an insight o: how expensive in terms of networks resources is to have a safe CAC and the complexity of resource allocation even for the multiplexing of CBR connections.
• Chapter 2 begins with an overview of which parameters and procedures defined in the Traffic Contract are necessary to operate resource allocation schemes and Control Functions. The ITU-T 371 and the ATM Forum, [1] and [3], specify these parameters. In this chapter the ATM transfer capabilities, the Connection Traffic Descriptor and the set of QoS parameters that an ATM connection may negotiate at call set up are outlined. An algorithm called Generic Cell Rate Algorithm (GCRA) gives the cell conformance of a connection respect to the cell rate and a tolerance. The chapter ends with a description of models proposed in the COST 242, [4], to quantify the Cell Delay Variation of a CBR connection crossing either a single queue system or a tandem of queues.
• Chapter 3 describes how Cell Delay Variation is introduced in real networks. For that purpose, a set of experiments performed in two ATM Testbeds where delay distributions were measured are presented. The first Testbed is an ATM optical access network belonging to the BAF Testbed (BAF: Broadband Access Facilities, RACE project 2024). The experiments obtained resulted in the writing of a deliver-able. [9]. where all the partners participated. The results presented in this chapter are an extract of [9] that was published in [72]. The second example is a set of experiments performed in the EXPLOIT Testbed in Basel (EXPLOITation of an ATM Technology Testbed for Broadband Experiments and Applications, RACE project 2061). together with the Swiss ATM pilot network as a part of the Pan European ATM pilot Network (PEAN) and the Telecommunications Laboratory of the Ecole Polytechnique Fédérale de Lausanne (EPFL). Results on experiments performed in the EXPLOIT Testbed centered in CDV can be found in : 14], [57] and [58]. The experimental results are compared with some of the models to quantify CDV described in chapter 2. The contributions to the thesis in this chapter are the experimental results together with the experience gained in how to set up a complex network configuration in a real network.
• Chapter 4 introduces the Benes approach to the Virtual Waiting Time as a tool that can be used in a wide range of queuing models. This approach expresses the Virtual
Waiting Time. Vs, of a G/G/1 queue and gives an upper bound of the queue length. In this chapter some of the most used models in ATM networks using this approach at cell level are described: the M/D/1, the ND/D/1, the modulated XD/D/1 and the M+D/D/1. The chapter finishes with other analytical tool presented by P.
Humblet et ai in [55] based on the Ballot Theorem ofTakacs.
• Chapter 5 defines the concept of Worst Case Traffic (WCT) as that traffic
WCT conditions is also studied. Finally, the analytical model is used to analyze the impact of Cell Delay Variation on resource management in a real network. Taking che EXPLOIT testbed experiments and using a worst case situation, a bound on the maximum number of cells in a burst can be computed. An interpretation of the impact of worst case traffic in the buffers is given, concluding that the high peak bit rate sources are the most dangerous. The analytical model and some of the examples can be found in [44] and [45], the last example can be found in [14], •57] and [58]. The contributions to the thesis in this chapter are the discrete-time and the fluid-flow model to analyse the superposition of WCT sources. I also give a set of examples of the impact of WCT sources in a multiplexor and I compared the exact model with two bounds that up to this moment were in the literature. I also comment the limitations of the exact model.
• Chapter 6 compares some WCT models using several traffic inputs: WCT bursts Poisson distributed. CBR multiplexed with periodic WCT. or Poisson traffic multi-plexed with WCT bursts Poisson distributed are some of the models studied. Some of these analytical models are exact while others are approximations that behave better or worst depending on the traffic parameters. The models are reported in 19]. The contribution of this chapter consists of a set of models to overcome some of the limitations of the periodic WCT model: homogeneity and computational complexity when the number of sources and the burst size grows.
• Chapter 7 studies what happens when periodic WCT or CBR traffic is multiplexed in networks with tree topology of rooted queues. To solve this kind of config-urations, we derive closed-form formulas for the queue length distributions in a discrete-time M-stage tree queueing network loaded with periodic traffic sources. We obtain expressions for the CPDF of the Virtual Waiting Time in any queue of •he tree. We also calculate the average queueing delay and average waiting time in any queue of the tree network. Results of this chapter can be found in the BC:98,
"21]. and as interim reports in [22] and [23]. The contribution of this chapter con-sists of the solution of a two stage network with a tree topology. The extension to a Q stage network is based on previous works found in the literature. However, this extension is based on the two and one stage systems. Therefore these are the important cases to study.
sources and their impact in other connections such as CBRs. • Chapter 9 is devoted to general conclusions and comments.
As can be seen, the thesis has a mixture of simulations, experimental work and analytical models. The advantage of simulating is the freedom in changing variables, design param-eters and the scalability of a simulator. The simulators have been programmed in C and executed in workstations running UNIX OS. The input traffic is modeled as statistical sources that generate cells following a probabilistic function. These functions make use of random numbers generated by the computer. A major problem in simulating is that the simulation has to run a long number of cell slots to obtain small probabilities. For in-stance to get a cell loss probability of 10~e in a Virtual Connection (VC) is recommended
to generate a multiple of 10e cells on that VC (e.g. 100 times 106). Furthermore, one has
to generate cells belonging to other VCs. That leads to run long simulations if low proba-bilities are required. Simulations have been performed taking confidence intervals of 95 %. The experimental work has been performed in two Testbeds: BAF and EXPLOIT. Some drawbacks were encounter when the experiments were carried out. The first was the newness of the experimental platforms. At that time most of the equipment was not still full commercial and came from prototypes, being sometimes unstable. Therefore, the experiments were performed at the same time that we learned how to fix bugs. Our experience in the platforms make us conclude after some time that changing dramatically the configuration of the network meant a lot of software crashes in some equipments as the traffic generators/analyzers. Hopefully, we had full support from the manufacters. An experimental session in EXPLOIT consisted of a week's work every month for each Work Package. During the two years I worked in the project, my Work Package dedi-cated the last half of the second year to perform experiments related with jitter and its impact on resource management. Thus, in this thesis I will only refer to these specific experiments.
As I mentioned, we tried as much as possible to keep always the same equipment and lines configured. Since the equipment available to perform experiments were limited, mainly the traffic generators, we had to make up some ideas: obtain phase-moving sources, recy-cling traffic, duplication of traffic using optical splitting devices and load balancing when multiplexing in the buffers were some of the solutions that we applied to go on with the experiments session after session. Of course, the network configuration become rather complex and the number of traffic assumptions were quite high: correlated traffic was a result on these assumptions. However, I think that we minimize as much as possible the correlation effects achieving a fair network configuration with the definition of an experimental criteria or rules that we followed rigorously. These conditions are outlined in chapter 3. In the experiments performed in the BAF Testbed, we again encountered many of these problems. For instance, we had only a traffic generator and we had to use again optical splitters. To solve the mentioned correlation effects, the traffic at T-0 interfaces was policed at different values. In this way, the VPs lost some background traffic due to cell dropping. Of course, incorrelations were not fully eliminated but at least minimized.
Chapter 2
Traffic Contract and Cell Delay
Variation in ATM networks.
This chapter describes functions and parameters for traffic and congestion control in ATM. The objective is to introduce the ATM Traffic terminology that will be used through the thesis. The ATM Traffic Contract specifies the connection traffic descriptor together with the ATM transfer capabilities and Quality of Service objectives. The main goal of Control and Congestion Functions in ATM is to protect the user and the network in order to achieve network Performance objectives. The different Control Functions are briefly outlined. Cell conformance of a cell stream to negotiated parameters is obtained making use of a reference algorithm. Finally the chapter summarizes different models to account for Cell Delay Variation.
The chapter is organized as follows: section 2.1 is dedicated to the Traffic Contract and ATM Transfer Capabilities and Quality of Service parameters. Section 2.2 describes the ATM Traffic Control and Traffic Congestion Functions. Section 2.3 defines the Generic Cell Rate Algorithm for cell conformance and how can be modeled as a G/D/l queue system. The concept of Cell Delay Variation is introduced together with the clumping and dispersion effects. Finally, section 2.4 is referred to models to quantify the CDV in ATM networks (single queue systems and tandem of queues) and the parameters that influence the choosing of CDV tolerances are outlined.
2.1 Traffic Contract and ATM Transfer Capabilities.
A traffic contract is specified at connection set-up. This contract specifies the negotiated characteristics of the connection. At the public UNI (User Network Interface), the traffic contract consists of:
• The selected ATM Transfer Capability.
• A Connection Traffic Descriptor: Source Traffic Descriptor (e.g. Peak Cell Rate, PCR, Sustainable Cell Rate, SCR, Maximum Burst Size, MBS, Minimum Cell Rate. MCR), the CDV tolerance and the conformance definition.
Loss Ratio. CLR, 2-point CDV, ...) classified in classes by ITU-T 356, see [2] (e.g. stringent class, tolerant class, bi-level class and unspecified class).
• The setting of the tagging option.
Note that the CAC (Connection Admission Control) and UPC/NPC (Usage/Network Parameter Control) may use the parameters described by the traffic contract to operate their procedures and achieve the best network resource utilization (CAC and UPC/NPC procedures are network operator specific). Therefore the interest in describing the most important parameters than can be used in these procedures.
ATM Transfer Capabilities.
ATM transfer capabilities (ATC) are defined by the ITU-T 371, [1], as a way to specify a combination of QoS commitments and ATM traffic parameters into a set of traffic pro-cedures suitable for some ATM applications and that allows efficient resource allocation. It is mandatory that the ATC used by an ATM connection be implicitly or explicitly declared at connection set-up.
ATM transfer capabilities are called service categories in ATM Forum terminology, [3". Some of the ATC are equivalent to the ATM Forum service categories but with other names. However a few discrepancies stay, see [3] for a mapping between ATC and ATM Forum services categories.
Deterministic Bit Rate (DBR): is used by connections that request a static amount of bandwidth characterized by the peak cell rate (e.g. voice, video, emu-lating circuit switching facilities). At connection set-up, a user can negotiate one of the following three source traffic descriptors (PCR for user data CLP=0+1 and PCR for end-to-end user 0AM cells, PCR for user data CLP=0+1 or the service type (e.g. telephony or video-phone)). For each PCR is mandatory to declare a CDV tolerance. Note that the DBR capability is not only defined for GBR applica-tions but also for those ones that may not continuously transmit at the negotiated PCR but wants a negotiated contract (e.g. in terms of QoS) compatible with the DBR capability.
Statistical Bit Rate (SBR): is used for connections that want to send at a vari-able rate obtaining multiplexing gain. SBR uses the SCR/IBT parameters together with the PCR and CDV tolerance to describe in great detail the traffic flow being transmitted by the source. The SBR capability can also specify as source traffic descriptor the service type.
ATM Block Transfer (ABT): In this capability the transfer characteristics are negotiated on an ATM block basis. Once an ATM block is accepted, the network allocates resources according to the QoS received to that block, as it would do with a DBR connection with the same peak cell rate and QoS. The user negotiates for each direction the PCR and CDV tolerance and the pair SCR/IBT.
Two ABT capabilities are specified: the ATM Block Transfer with Delayed Trans-mission (ABT/DT) and ATM Block Transfer with Immediate TransTrans-mission (ABT/ IT). With DT the peak cell rate of successive blocks is negotiated dynamically with the network making use of Resource Management (RM) cells. In the IT definition, the user sends an ATM block without the positive acknowledge of the network. If there are not enough resources available in the network when transmitting a block, this one can be discarded.
• Available Bit Rate (ABR): With this capability it is intended that the user adapts to the network characteristics upon receiving feedback from the network (reactive control). The feedback is conveyed to the source through special cells called Resource Management (RM) cells. With this idea in mind it is intended that all the available resources of the network are used providing moreover a fairly bandwidth share among users.
At connection set-up the user specifies to the network a maximum cell rate (its PCR) and a minimum usable bandwidth (the Minimum Cell Rate, MCR. that may be 0). Then, the bandwidth available varies from the PCR to the MCR depending on the network conditions. The RM cells are in charge to inform the end user of the state of the network in order the user can adapt its cell rate. The QoS re-quirements are very loose, there are no Cell Transfer Delay or Cell Delay Variation commitments in ABR, and as far as the user adapts its rate as the RM cells specify it, the QoS on Cell Loss Ratio remains.
Connection Traffic Descriptor.
The Connection Traffic Descriptor specifies the traffic characteristics of an ATM con-nection. It consists on the source traffic descriptor, the Cell Delay Variation Tolerance (CDV-T) and the conformance definition.
The source traffic descriptor is the set of parameters of an ATM source and is used to capture the intrinsic traffic characteristics of the connection requested by a particular source. Any of these traffic parameters may participate in resource allocation schemes and have to be enforceable by the UPC/NPC. As main parameters, we can mention the following:
• The Peak Cell Rate (PCR) of an ATM connection is the inverse of the minimum inter-arrival time (TPCR) of two ATM cells, where TPCR is called the Peak Emission Interval (PEI).
• The Sustainable Cell Rate (SCR) gives an upper bound on the conforming average rate of an ATM connection. SCR can be expressed in terms of its inverse TSCR-• The Intrinsic Burst Tolerance (TIBT) is defined together with the SCR and it is a
parameter used by a traffic source within the customer equipment that accounts for the Maximum Burst Size (MBS) that can be transmitted at peak rate and still be in conformance with the GCRA, being MBS=[1 + ^—^f J cells.
The Cell Delay Variation (CDV) tolerance is intended to capture the cell delay variation or jitter caused on an ATM connection. The CDV tolerance, T, is defined respect to the GCRA(Tpcn-r). The CDV tolerance defined with the TSCR in the GCRA is the TSCR-In fact TSCR is composed by two terms: TIBT and an additional tolerance added at the customer equipment that accounts for the CDV introduced by multiplexing stages at the cell level and at the burst level called T'SCR. Thus TSCR — TIBT -t- T
*CR-The Generic Cell Rate Algorithm (GCRA) is used to define conformance with respect to the traffic contract. For each cell arrival, the GCRA specifies if the cell is conforming or not. In the case the cell is not conforming several actions can be carry out (e.g. cell tagging, cell discarding). See chapter 2 for a definition of the GCRA.
Quality of Service parameters.
2.2 ATM Traffic Control and Traffic Congestion Functions.
ATM traffic congestion is defined by the ITU-T 371, [1], as the state of Network Elements in which the network is not able to meet the negotiated Network Performance objectives for a given established connection. As an example, we can assume a connection crossing an ATM switch and therefore being multiplexed with other connections in the switch shared buffers. Since the buffer is finite, we can find multiplexing situations due to the nature of the multiplexed streams (e.g. peak rates, burst lengths, activity factors, etc) for which the number of cells lost in our connection is higher than the negotiated QoS Cell Loss Ratio parameter. It is clear that there must be Control Functions able to dis-tinguish situations where there may be cell losses due to buffer overflows and check up whether the negotiated QoS are met or not.
The ITU-T defines two types of Control Functions:
• Traffic Control Functions: defined as the actions taken by the network to avoid congestion. As Traffic Control Functions the ITU-T mentions the following:
— Network Resource Management (NRM): makes use of Virtual Paths (VPs) e.g. to simplify CAC or facilitate the segregation of traffic types requiring different QoS.
- Connection Admission Control (CAC): allows to determine if a Virtual Path/ Channel connection can be accepted or rejected given that the QoS require-ments have to be met.
— Usage/Network Parameter Control (UPC/NPC): allows to monitor and con-trol the accepted connections in such a way that the parameters negotiated are not violated.
— Priority Control and Selective Cell Discarding: the network may selectively discard cells of the lower priority or if allowed change the Cell Loss Priority bit to a lower priority (tagging option).
— Traffic Shaping: alters the traffic characteristics of a connection to achieve a better performance: e.g. spacing cells or using scheduling mechanisms. - Fast Resource Management (FRM): is used to dynamically allocate resources
to connections.
• Congestion Control Functions: defined as the actions taken by the network to minimize the intensity, spread and duration of the congestion.
— Selective Cell Discarding.
— Explicit Forward Congestion: is a mechanism that allows the network to re-cover/avoid of congestion states.
2.3 Ruled based traffic parameters.
The most usual example of a DBR ATM source is one which transmits one cell at peri-odic intervals given by its Peak Emission Interval - PEI - (conversely its Peak Cell Rate - PCR), which is a parameter declared by the source at connection set-up within the Traffic Contract. In order to control congestion, the traffic that the DBR sources emit is monitored and controlled by a mechanism called Usage Parameter Control (UPC). The point at which the UPC mechanism controls the traffic should be at the network ingress. When the traffic reaches the said point it may have been distorted due to the use of ATM Adaptation Layers, due to multiplexing with traffic from other connections or by the use of medium access protocols in the network which give access to the ATM network. These phenomena produce a jitter in the cells that is known as Cell Delay Variation (CDV). In order to avoid cells from sources which emit traffic in accordance with the declared Traf-fic Contract being erroneously declared non-conforming by the UPC, the sources must include in its Traffic Contract a parameter known as CDV Tolerance (CDV-T) which quantifies the said phenomenon. The UPC mechanism must therefore take into account the CDV-T in order to avoid declaring cells from sources that fulfil the Traffic Contract to be non-conforming.
The cell conformance of a connection to the negotiated cell rate 1/T and the tolerance allocated T is defined in respect of a reference algorithm called the Generic Cell Rate Algorithm - GCRA (e.g. the continuous-state leaky bucket algorithm or the virtual scheduling algorithm). A cell k is conforming to GCRA(T, T), if y k = Ck — a,k is smaller than T, where a^ is the arrival time of cell k. and Cfc is a "theoretical time" calculated recursively as:
*/ 0 < yk < T
if yk<Q (2.1 <
if yk> T
In the case of DBR connections, T is the PEI (T = I/PCR) and T is the CDV-T. For SBR connections T is the reciprocal of the SCR and T is the sum of the IBT and the CDV-T at sustainable cell rate level.
The GCRA can be modeled as a G/D/l queue system, [4]:
• The set of arrivals times {a^} defines a general arrival process to a virtual deter-ministic queue of service duration T,
• The set of theoretical times {ck} represents the virtual departure times from the virtual single server queue, (cfc represents the departure of the previous arrived cell).
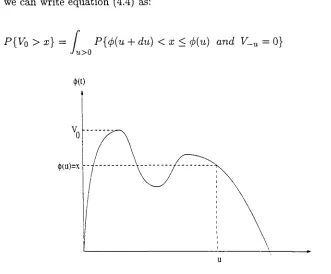
• If ijk = Cfc — a,k is negative, cell k initiates a busy period and a^ — Ck is the duration of the previous idle period, see figure 2.1.
ri
t c,wnungtime M| ^
ofœlll
Figure 2.1: Generic Cell Rate Algorithm.
From the last point, a cell is conforming if y^ < T, which means that T gives a bound to the queue waiting time a cell has in the G/D/l queue system. If r is a multiple of T, the G /D ¡I queue capacity would be of r/T. Therefore, a bound in the number of conforming cells accessing the conformance algorithm can be established, see [69] for a proof:
(2.2;
where. £?, is the maximum burst size allowed by the conformance algorithm, I/A is the access rate of the line on which the cell is observed, and fx] is the upper integer part of
x. In the particular case in which the access line rate is the same as the link rate. I/ A = 1.
Note, that if r is smaller than T — A, that is, only a negligible amount of CDV can be tolerated, the burst size is 2. A lower bound on the minimum CDV that any network must tolerate is given in [1]:
Trmn = maz{T, /(T)} where /(T) = a • A • (1 - — )
where a is a dimensionless coefficient whose suggested value is a = 80 (this quantity comes as a quantile of the waiting time distribution for the cells of a deterministic source with period T multiplexed in a FIFO queue with Poisson background traffic with load 0.85, it is to say, the M + D/D/l queue system). The function /(T) gives an upper bound on the CDV in a multiplexing stage performing Peak Cell Rate spacing on a link loaded at 0.85.
Due to the different traffic conditions, a cell belonging to a cell stream can experience shorter delays than other cells belonging to the same stream. That means that this cell has an emission interval shorter than the source Peak Emission Interval during a period of time. This effect is called the clumping effect, see [1] or [3]. Furthermore, other cells experience larger delays during periods of time that previous cells, have This effect is called the dispersion effect.
not well defined, a clumping effect due to the jitter can produce the discarding of the cell in the GCRA(T.r). If a cell is clumped too much, it will move away of the theoretical time, producing a higher y k (remember that y k = c¿ — ofc). So, when y k > T the cell will be non-conforming. Here comes the importance to evaluate the cell delay variation a cell suffers in its route.
The Leaky Bucket is one of the most studied and used mechanisms to provide policing in ATM networks. The Leaky Bucket is closely related to the GCRA, and it is also called token bucket filter. We can find a description of this mechanism in numerous papers, e.g. [4], [34], [35], [79] are some references to find some information about the token bucket filter or the Leaky Bucket. Following the nomenclature of [34], the token bucket filter is characterized by a leak rate, r, and a depth or token pool, b. A token bucket is filling up with tokens at a rate of r up to the depth ò (its maximum). When a packet is generated, p tokens are removed from the bucket (p is the size of the packet).
If pi is the size of packet i that is generated at time í¿, a traffic stream conforms to a token bucket filter (r, ò) if there are always tokens in the bucket each time a packet is generated. That means that the traffic stream conforms if the sequence n¿ defined as following is higher than 0 for all i (n¿ > 0):
o =
m — min{b,ni-\ + (ti — ti-i)r — pi} ¿ > 0
In ATM networks, where packets are of fixed size, the token bucket filter corresponds to a GCRA(^. ^r-). If u(i, s) is the amount of data that enters the network in the interval (í, s). the token bucket filter guarantees a bound on the input traffic to the network:
u(i.s) <b+(t-s)r (2.4)
2.4 Models to quantify the CDV in ATM networks.
We now know the importance of setting traffic parameters and specially the CDV toler-ance. which appears as a parameter that bounds the number of conforming cells passing through the UPC function. To set this value, a good idea would be to quantify the CDV introduced by the different elements in an ATM network. One of the most important elements that introduces jitter in ATM is the queueing delay. We can find in [4] a survey of models to account for Cell Delay Variation and methods for setting traffic parameters values. We here summarize some of them.
2.4.1 Single queues.
The simplest way to approximate the CDV introduced in an ATM network is through the GCRA. If T is the Peak Emission Interval (PEI) of a CBR connection, we said that a cell is conforming if y k = c^ — a^ < T, where a^ is the arrival time of cell A; and Cfc is the theoretical time arrival. Let W} — Wl be the difference between cell transfer times from
\)k = Ck - ak = (¿o + W0 + kT) - (¿Q 4- kT + Wk) = WQ-Wk<r (2.5)
Therefore, T can be chosen as an upper bound for W0 — Wk for all cells conforming the
GCRA. We can use Wmax defined as a quantile of the distribution of the observed
trans-fer time for a single cell: Wmax = sup{w \ P{W < w} < I — e}, where e is the target
value for the probability of transmitting a non-conforming cell. This model applies when the negotiated PEÍ. T, is equal to the original time period of the connection (there is no over-allocation of resources to the connection). If T is less than the original time period this approximation is a conservative worst case for estimating T. The draw back of this approximation is that the cell transfer time distribution has to be known.
During the COST 242 several methods based on a GI approximation for the case the cell transfer time distribution is not known were proposed. All the methods are fed by a renewal input and makes use of the GI/D/l queue model described in the former subsection. Note that if TCBR is the mean value of the GI inter-cell time, and T is the negotiated PCR. then T < TCBR to be the GI/D/l queue stable. Then, the CDV toler-ance r is taken as the level in the infinite queue for which the probability of overflow is less than the target non-conforming value. Examples of this methods are the heavy traf-fic assumption and the Kingman's bound that provide upper bounds for T. Kingman's bound gives closer results than the heavy traffic assumption, see [4] for more information about the study of these approximations.
2,4.2 Tandem queues.
The CDV is accumulated when the connection is multiplexed with interfering traffic across several multiplexing stages. In such situation two models are proposed to evaluate the CDV tolerance: the convolution approach and the recursive approach, see [4]. The convolution approach considers independence in the delays in successive queues. Given the delay distribution in single stages, the end-to-end delay distribution can be computed as the convolution of the distributions in successive individual queues. This approach has the draw back of needing the delay distribution at each queue. Since in general this is unknown, some approaches are proposed. The first one considers a single queue whose input is Poisson traffic (note that Poisson is considered as the worst case traffic of the multiplexing of smooth sources). Thus, the M/D/l queue system is used as a model if the rate of the connection is small with respect to the capacity channel. Now. using the heavy traffic approximation for the delay distribution for a single stage and being x the transmission time unit:
W(x) = 1 - e~ax where a = ^—— (2.6)
P
M
=W
zM
~
l
°~°*
(2
-
T)
Now. as in thé former subsection, we can approximate the CDV tolerance as an upper bound to WM(Z) (taking a quantile to a target value e). As we will see when we present experimental results, it is expected that this approximation gives pessimistic results if the queue is not heavily loaded or if the rate is high with respect the capacity channel. Another possibility is to compute statistical characteristics such as mean and variance of the queueing time in a single queue and assuming independence at each queue match the end-to-end queueing delay distribution with a Gaussian or Gamma distribution. The effect of increasing the number of stages M in r/T has been illustrated in [4]. Simula-tions show that if M increases, T increases moderately, however using the convolution approach the end-to-end delay increases steeply. This shows that the convolution ap-proach is accurate only for a limiting number of multiplexing stages (in the example they studied p = 0.85. T=Tcbr=5, e = 1CT3, then M < 10).
Finally, the recursive approach can be used when the number of stages is high. This approach applies if the load at each queue is 1 and the interfering traffic is batch Bernoulli. and it allows to derive recursively the successive inter-cell time distributions along the tandem networks, see [4] for a deeper study.
2.4.3 Impact of CDV on resource allocation.
The traffic characteristics of a connection depend on several parameters as the statistical parameters of the source, however also on the negotiated traffic contract. Amonz the parameters that influence the choosing of the CDV tolerance are, see 4]:
• Load of the access network: the CDV tolerance is an increasing function of the access network load.
• Original statistical characteristics: For a CBR source multiplexed with Poisson background traffic, the CDV tolerance is an increasing function of the PEI, and the maximum burst size Bs = I + \^\ decreases as the PEI increases.
• Influence of the background traffic: the CDV tolerance depends on the statistical characteristics of the background traffic. If the background traffic is not fully characterized, it can be difficult to choose a CDV tolerance value.
• Over-allocation factor: decreasing the over-allocation factor (T < Tc&r), where T is
the negotiated rate and Tc¿r is the original rate, the CDV decreases.
guarantee that the QoS of the connections already established would not be damaged by the new connections that are accepted and at the same time has to try to achieve the maximum utilization of the network. However, among the resource allocation proposals, some presuppose the knowledge of parameters that are difficult to obtain and control, others require a great deal of calculations while others cannot guarantee the complete ab-sence of network congestion. Furthermore, in order to have a CAC method that achieves the aforementioned requirements, it is necessary to use mechanisms of Traffic Shaping ([28] and [80]) or Scheduling ( [34], [48] and [74]) that would bring additional cost to the designing of the network.
Chapter 3
Cell Delay Variation introduced
in a real network. EXPLOIT and
BAF Testbeds.
Although a lot of theoretical research has been done and is available in the literature, few experimental works can be found. The main reason is the high cost of building and maintenance of an ATM platform. European projects have in the recent years funded ATM Testbeds for experimental research. In this section we want to show two examples of how the jitter is introduced in a real network. For that purpose, we present a series of experiments performed in ATM Testbeds where delay distributions were measured. The first one was an ATM optical access network belonging to the BAF Testbed (Broad-band Access Facilities. RACE project 2024). The experiments were performed in Milano during two weeks. The aim of the experiments were to validate the access network per-formance, matching the results of a set of experiments with the results of simulators developed during the design of the access network by several partners of the project. The specifications and description of the BAF experiments can be found in [8]. The experiments were performed by partners from the University of Nijmegen (Netherlands), Queen Mary & Westfield College (Great Britain) and Polytechnic University of Catalonia (Spain). The experiments obtained resulted in the writing of a deliverable, [9], where all the partners participated. The results presented in this chapter are an extract of [9] that was presented in [72].
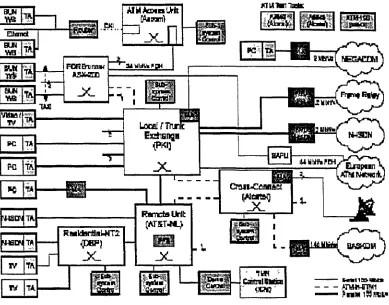
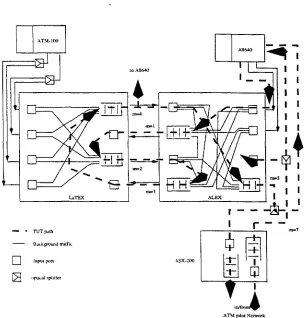
The specifications and description of the experiments can be found in [10] and [14]. The experiments were performed by partners from the Ecole Polytechnique Fedérale de Lausanne (EPFL: Switzerland), Alcatel STR AG (Switzerland), Telefónica I+D (TID: Spain), National Technical University of Athens (NTUA: Greece), Laboratoires d Elec-tronique Philips (LEP: France) and Polytechnic University of Catalonia (UPC: Spain). Results on experiments in the EXPLOIT Testbed by our work-package group can be found in deliverables [11], [12], [14] and published in [24], [56], [57] and [58]. Among the experiments carry out during the project, we present those ones centered in CDV performed by partners from EPFL. Alcatel STR and UPC.
The chapter is organized as follows: section 3.1 describes the ATM Access Network, the BAF Testbed and the results obtained in the BAF demonstrator. Section 3.2 describes the network configuration used in the EXPLOIT experiments. The total EXPLOIT Testbed is not shown since involve part of the equipment not used during this phase of the experiments as some ATM switches, TV coders, mappers, ISDN over ATM, or PC adapters. Section 3.3 is devoted to conclusions and comments about the experiments.
3.1 Delay and CDV in an ATM Access Network. The BAF
Testbed.
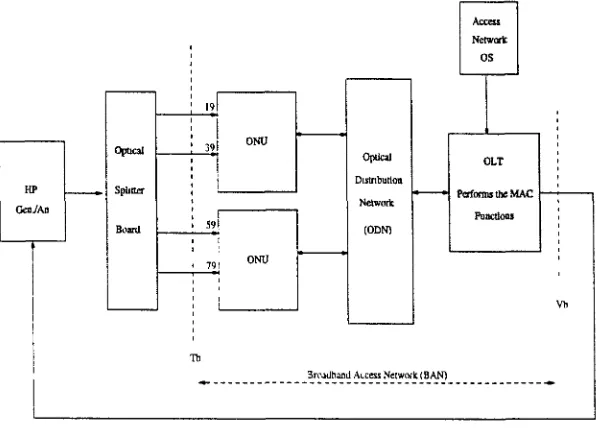
The BAF project main task was the development and study of an ATM access network. The access network objectives are to support the sharing of access resources efficiently among small business and residential users who can not afford the high costs of a unique interface in a single integrated service network. The ATM Passive Optical Network (APON) with a tree topology seems a good candidate to provide access to public net-works to these users by providing a high degree of resource sharing and a flexible and low cost access.
The main objectives of the experiments were the validation of the BAF architecture and the evaluation of the MAC protocol. The measurements were performed between the T& that give access to users and the V¿, interface that give access to a local exchange, see figure 3.1.
Here, we describe briefly the APON architecture of the BAF system, the Medium Access Control (MAC) protocol that provides access to the shared medium, the ATM access network Testbed and results on delay distributions and 1-point CDV, see also [9], [17]. [32], [33], [43], [60], [71] and [72].
3.1.1 ATM-PON system architecture.
The architecture of the access network under consideration consists of 3 main subsystems, namely the OLT (Optical Line Terminator), the ODN (Optical Distribution Network) and the ONU (Optical Network Unit) as is depicted in Figure 3.2. The OLT is directly connected to the local exchange and forms the entrance to the access network, with re-spect to the backbone (or core) network. The OLT also contains the algorithm that distributes the available data rate over all terminations connected. This algorithm is the
engine of the MAC protocol, whose primary goal is to prevent collisions in the ODN
between ATM cells originating from different network terminations.
Either an Optical Network Unit (ONU) or a Network Termination (NT), supporting re-spectively Fiber To The Curb (FTTC) and Fiber To The Home (FTTH), terminates the access network. In the case of FTTC an ONU serves up to eight NTls and the path to the home can be completed by either copper or wireless communications. In the case of FTTH, the NT represents a home. Each NT1 or NT provides one T6-interface. The total
access network is limited to a maximum of 81 T¡, interfaces (or customers). To provide each customer a reasonable data rate, the transmission rate at T¿ and Vj, interfaces are assumed to be 149.76 Mbit/s (STM1 in SDH) and 599.04 Mbit/s (STM4 in SDH) re-spectively.
The ODN is situated between the ONU and the OLT. The ODN is a Passive Optical Network (PON) with a tree topology and a splitting ratio of 1:32. The maximum dis-tance between the OLT and ONU is assumed to be 10 km, covered by fibers. Among many transmission technologies applicable to the access network (ADSL, CATV systems. Active nets, etc.). the PON represents a very promising solution. Using this approach, multiple users may share photonic equipment and fibers in the local loop. In the down-stream direction (i.e. network to user) the splitting point of the PON provides a passive instrument that broadcasts ATM cells to all terminations connected. In upstream direc-tion, the access network performs a multiplexing function. Access to the shared medium is arbitrated by the MAC protocol, operating on the ATM layer.
3.1.2 The MAC protocol.
UPSTREAM » INTERLEAVING
DOWNSTREAM
BROADCASTING
622 08 MBit/s
ATM in SDH 15552MBit/s (optical)
(FTTH)
(FTTC) Splitting Max 32
•*•« ?_ 1
s
BAF-LT
Funcüons
*l
ETWORK
<- -ffic ™~ vb
LEX
Figure 3.2: Architecture of the access network.
collision-free access.
The MAC protocol implemented in the access network under consideration was proposed by partners from the University of Nijmegen and Polytechnic University of Catalonia and was chosen for the implementation of the prototype used during the experiments. The MAC protocol implemented was called Global FIFO and has been described in detail in [32]. Furthermore, the performance of the Global FIFO and other MAC protocols for the APON technology were compared in [4, Part II] and [60]. These performance comparisons were based on simulation results.
This Global FIFO MAC protocol operates on a request/permit basis. Requests are sent upstream to inform the Permit Distribution Algorithm (PDA) in the OLT about the number of ATM cells waiting in the buffer of the network termination (NT). The PDA then issues Permits to allow a termination to send a single ATM cell, each permit allows a single cell to be transmitted. Although the network termination may be either an ONU or an NT1. for reasons of simplicity we use the acronym NT.
Requests
An NT1 advertises its transmission requirement by sending requests to the MAC con-troller, which is the master of the protocol and is located in the OLT. A request contains information about the state of the buffer in the termination. Two types of requests are distinguished:
1. requests coupled with upstream cells An upstream cell originating from an NT1 is preceded by a request field that contains the queue length of the NT1 buffer. The format of an APON slot is described in the following point.
that a termination can only reveal its state when it is allowed to send a cell in the upstream direction. To overcome from this drawback, RBs are introduced. An RB contains the request of nine consecutive NTls. It has the same length as an upstream cell.
Permits
A permit is the output of the PDA. As soon as a network termination receives a permit, it is allowed to send one ATM cell in the upstream direction. Two types of permits are distinguished:
1. permit for an ATM cell. When the central controller decides that an NT1 can send an ATM cell, it forwards a permit containing the address ofthat NT1 to the Global
FIFO buffer. This permit can consequently be added to a downstream ATM cell.
Remark that since the downstream cell is broadcasted no coupling between the address of permits and ATM cells is required. The permit class bit CL=1 indicates that this is a permit for an ATM cell.
2. permits for request blocks. When the Global FIFO buffer is empty, a permit for an RB is issued. Such a permit contains the address of the NT1 that is the first one to contribute to a new RB. A total of nine NTls can contribute to one RB. As the OLT only issues a permit for an RB when it has no permits for ATM cells, none of the available data rate is wasted by sending permits for RBs. Besides giving all NTls the possibility to advertise their needs for transmission requirements since their last request, the introduction of RBs increases the reaction speed of the protocol. Permits are issued by the Permit Distribution Algorithm, which uses two counters and a special rule to determine when a permit for an ATM cell can be issued. A bundle-spacer is used to space the cells generated by all the connections that share a Tb since the PDA only knows the data rate requirements of a whole T¡, and not of each individual connection of the Tf,. For more specific information regarding the implementation of the counters and the used rule we refer to [17] and [43], respectively.
3.1.3 APON slot format.
Transmissions in both the upstream and the downstream directions are organized in TDM slots of 448 bits each. These slots are referred to as APON slots.
both an upstream ATM cell and to each request field that contributes to a RB. Although theoretically a total of 14 NTs can send their buffer status to the OLT simultaneously, for implementation reasons it was assumed that only 9 NTs can contribute to a single RB, prevailing a relative gap of 20 bits.
ATM
1 APON slot (448)
ATM ATM
Request Block (448)
REQ
i REQ
itl — REQ
1*9 ATM
PL: Physio! byer Preamble
QL Que« Length
Figure 3.3: Upstream transmission format.
1 APON slot (448)
ATM ATM ATM ATM
ATM cell (424)
CL (1)
Permit
(7)
Preamble (16)
Figure 3.4: Downstream transmission format.
3.1.4 The BAF Testbed.
[image:38.568.168.467.199.416.2]The RACE project 2024 provides a powerful platform to experiment and validate in a real environment the architecture and topology of the optical access network and the performance of the MAC protocol.
Figure 3.5: Architecture of the access network Testbed.
Figure 3.5 depicts the configuration of the ATM Access Network used for the experiments. The platform consists of a traffic Generator / Analyzer (HP E4210) and the Access Net-work demonstrator. The Broadband Access NetNet-work was controlled by software from the Access Network OS. This software mainly performs operations such as start-up control. VP configuration, alarms and events handling, encryption control and status informa-tion in the Broadband Access Network. These allow us to operate the access network manually (e.g. install and monitor VP connections, VP policing, ranging procedures. T, address definitions, etc).
fully eliminated, but they were minimized as much as possible. To build a fairly loaded Access Network configuration, the four TVs were given equi-spaced addresses, that is, the addresses assigned to the Tj interfaces were respectively 19, 39, 59 and 79 (see figure 3-.5). The HP test equipment allowed us to timestamp the CBR tagged source to measure off-line network performance parameters as defined in [2] (e.g. Cell Transfer Delay and Cell Delay Variation). However, since the analyzer module was able to capture a maximum of 130K reference cells with calendar time-stamps (resolution of 100 ns), statistics could be calculated for this amount of cells only. Different tagged sources (in terms of data rates) were multiplexed with background traffic (CBR and Poisson traffic) to obtain results for three different load conditions. It must be stated that since the generator only offered an STM-1 line the traffic is multiplexed inside the generator.
3.1.5 Performance of the Access Network
This section reports performance results of the ATM layer experiments, [72] and [9], carried out on the access network demonstrator. Performance evaluation is achieved by studying the complementary distribution function (i.e. Pr{X > x} ) of two important performance measures, namely the transfer delay and the 1-Point CDV. ATM cells of one particular reference (or tagged) CBR connection were monitored, under different load conditions, at the borders of the access network.
As we saw in subsection 2.4.3, the impact on the performance measures chosen depend on the load conditions of the access network, the data rate of the reference CBR source and the characteristics of the background traffic. Therefore, sources of 64 K bit/s, 2 M bit/s and 34 M bit/s were chosen as reference connections while a combination of CBR and Poisson connections were chosen as background traffic. Experiments were performed in cases where the access network was loaded up to 0.4 and 0.8. The background traffic was composed with a mixed of 4Mbit/s CBR sources and Poisson traffic, see [9] for a description of the background traffic profile. We must mention that the Poisson traffic is generated inside the HP test equipment. Since we have a unique link interface, the Poisson traffic behaves as Bernoulli. In addition, experiments were performed in the case where the reference source was the only input the policing unit allowed, referred to as solely réf. source. Results of these three different load conditions lead to a better understanding of both the behavior of the access network and the impact of background traffic.
Transfer delay
The transfer delay of the access network is defined as the time difference between the sending of a cell at the output port of the traffic generator (« time arriving at T¡, in-terface) and the reception of this cell at the input port of the traffic analyzer (« time arriving at Vj, interface).
for-Transfer Delay [n s]
(a) 64 kbit/s
Transfer Delay [ji sj
(b) 2 Mbit/s
Transfer Delay [^ s)
(c) 34 Mbit/s
Figure 3.6: Experimental results for transfer delay: CBR reference source for 3 different bit rates.
mation/deformation and the presence of the OAM cells which are issued every 512 cells in the demonstrator, but were not modeled within the computer simulator. The 'steps' shown in Figure 3.6.(c) can be ascribed to the formation/deformation of SDH containers and the granularity effects introduced by the traffic generator resulting from the fact that the service rate used is not divisible by the maximum rate provided. Clearly, this effect becomes larger for higher service rates while its impact on low bit rates was overruled by the variation in delay introduced by the MAC protocol.
The total delay introduced by the access network described comprises the following com-ponents:
• the time needed until a request can be sent (variable). • the request propagation delay (fixed).
• the delay introduced by the PDA (variable).
• the waiting time in the Global FIFO queue (variable). • the permit propagation delay (fixed).
• the cell propagation delay (fixed).
• the delay introduced by the intermediate hardware, such as T&, Ub and V& interfaces. In addition, there is a fixed delay and negligible delay that is introduced in the fibers from and to the traffic generator/analyzer.
We can observe that the delay introduced in the reference source has two components: a fixed delay component mainly due to propagation delays of the transmissions of requests, permits and cells (around 145 ß s ) , and a variable component due to the MAC protocol. The last component is the one that contributes to the CDV. If we take a quantile of the variable delay and take this value as the CDV, we observe a CDV of the order of 20-25
/j,s. This CDV is mainly due to the delay introduced by the time needed until a request
1-Ponl-CDV(|i s] (a) 64kbit/s
1-Pomt-CDVI|isl (b) 2 Mbit/s
1-Pont-COVJn s] (c) 34 Mbit/s
Figure 3.7: Experimental results for 1-point CDV: GBR reference source for 3 different bit rates.
The 1-Point CDV
The most important reason why the access network causes Cell Delay Variation (CDV) is that variable queuing, VP-shaping and multiplexing of VCs disturb the profile of each connection. An accurate performance characterization of CDV is a network performance parameter known as 1-Point CDV. The 1-Point CDV describes the variation of the arrival times pattern with respect to the negotiated peak cell rate. It is measured by observing successive upstream cell arrivals at the F¡,-interface and only considers cell clumping, i.e. the effect of cell inter arrival distances which are shorter than T, the reciprocal of the peak cell rate. The characterization of CDV by means of 1-Point CDV was given in [2] and is recommended for CDV assessment by ITU-T.
As with the transfer delay, in [72] the results obtained from the experimental platform, are compared with those obtained by means of computer simulations and match rather well. We can first check that taking a quantité of the transfer delay is a good approxima-tion of the CDV. The conclusions of taking a direct measurement of the CDV will be the same as those ones taken by the transfer delay distribution. However, we could add some comments. In the cases where the reference source has a higher bit rate, the relative contribution to the total load of the TO, which is possibly shared with other connections, is subsequently higher. The bundle spacing function of the PDA therefore spaces the individual cell stream more accurately, leading to less CDV. If the reference source is the only active source, CDV is mainly introduced because an NT must wait for a request block before it can inform the LT about new arrivals. That means that the sources without background traffic (and more for low bit rate connections) rely exclusively on the RB mechanism for sending requests. In the case the reference source is multiplexed with background traffic, the CDV introduced is due to the mechanism of sending permits together with the CDV introduced by the Global FIFO.