Species ecology determines the role of nitrogen nutrition on the frost tolerance of pine seedlings
44
0
0
Texto completo
(2) Species ecology determines the role of nitrogen nutrition in the frost tolerance of pine seedlings. Andrei Toca1,3, Juan A. Oliet2, Pedro Villar-Salvador1, Judit Maroto1,2, 5. Douglass F. Jacobs3,4 1. Forest Ecology and Restoration Group, Departamento de Ciencias de la Vida, Apdo.. 20, Universidad de Alcalá, E-28805, Alcalá de Henares, Madrid, Spain 2. E.T.S. Ingenieros de Montes, Forestal y del Medio Natural, Departamento de Sistemas y. Recursos Naturales, Universidad Politécnica de Madrid, 28040 Madrid, Spain 10. 3. Hardwood Tree Improvement and Regeneration Center, Department of Forestry and. Natural Resources, Purdue University, West Lafayette, IN 47907, USA. 4. Corresponding author: [email protected], Phone +765.494.3608, +Fax. 765.496.9461 15. Revised for Tree Physiology on September 2017 Text pages 30, 6 Figures, 1 Tables 1. Supplementary material: 1 Table and 1 Figure. 1.
(3) 20. Abstract: Frost determines the evolution and distribution of plants in temperate and cold regions. Several environmental factors can influence frost acclimation of woody plants but the magnitude and direction of the effect of nitrogen (N) availability is controversial. We studied the effect of N availability on root and shoot frost tolerance in mid-fall and in winter in seedlings of four pines of contrasting ecology: Pinus nigra, P.. 25. pinaster, P. pinea and P. halepensis. Needle and root N and soluble sugar concentration, and timing of cessation of shoot elongation were measured to assess the physiological mechanisms underlying frost acclimation. N was supplied at high and low rates only during the pre-hardening period and at a moderate N rate during hardening in the fall. Shoot frost tolerance increased over winter while root frost tolerance did not change in. 30. any species. Pre-hardening N availability affected the frost tolerance of both roots and shoots, although the effect was species-specific: high N reduced the overall root and shoot frost tolerance in P. pinea and P. halepensis, increased the frost tolerance in P. nigra, but had no effect in P. pinaster. N supply in the fall consistently increased frost tolerance in all species. Differences in frost tolerance among species and N treatments. 35. were not explained by variations in organ N or soluble carbohydrate concentration, nor by timing of cessation of shoot elongation; although the most frost tolerant species ceased elongation earlier than the least frost tolerant species. Despite the close phylogenetic relatedness of the studied species, the effect of N availability on seedling frost tolerance differed among species, indicating that species ecology (especially frost. 40. acclimation physiology and timing of N supply) drives the effect of N availability on frost tolerance of pine species. Keywords: cessation of shoot elongation, cold hardiness, soluble carbohydrates, fall fertilization, Pinus, root frost tolerance, species ecology.. 2.
(4) 45. Introduction Low temperature is a key environmental factor determining the evolution and distribution of plants (Grace 1987, Hawkins et al. 2014). Frost can damage plants through xylem embolism and the formation of extracellular ice, which causes cell dehydration and disruption of cell membranes (Zwiazek et al. 2001, Willson and. 50. Jackson 2006, Charrier et al. 2015). Woody plants have remarkable differences in frost tolerance, which are frequently related to the minimum temperatures within their distribution range (Kreyling et al. 2014). At a plant scale, organs also differ in frost tolerance, with aboveground vegetative parts having greater frost tolerance than roots (Bigras et al. 2001, Charrier et al. 2015). Plants have developed specific adaptations to. 55. low temperatures (Levitt 1980, Larcher 2005). Perennial plants from cold and temperate biomes undergo a complex cold acclimation process during fall in which they experience deep reversible physiological changes to survive the cold season (Bigras et al. 2001, Charrier et al. 2015). Consequently, plant frost tolerance increases through the fall to a maximum in mid-winter and releases in spring to a minimum tolerance in early. 60. summer. However, decoupling of cold plant acclimation with timing of climate events has increased in the last decades. This phenomenon increases the chance of frost damage to plants due to unusual fall and spring frosts events, which are expected to increase with climate change (Augspurger 2013). At the same time, the reduction of the snow cover and earlier snow melting can increase the risk of root frost damage due to. 65. lower soil and root insulation (Groffman et al. 2001, Schaberg et al. 2008). Cessation of shoot elongation is a requisite for frost acclimation (Greer et al. 2000, Repo et al. 2000, Heredia-Guerrero et al. 2014), triggering the accumulation of nutrients and the synthesis of metabolites involved in frost tolerance (Charrier et el. 2015). Specifically, soluble carbohydrates (SC) progressively accumulate in plant 3.
(5) 70. tissues during cold acclimation (Schulze et al. 2005, Martínez-Vilalta et al. 2016). In vitro addition of sucrose enhances structural stability of the cell membrane to frost damage and increases cytoplasm osmotic potential, which stabilizes intracellular structures and lowers the freezing point (Wolfe and Bryant 2001, Uemura and Steponkus 2003, Charrier et al. 2015). These cellular changes explain the reported. 75. positive relationship between frost tolerance and SC concentrations in plants (Ogren et al. 1997, Tinus et al. 2000, Kreyling et al. 2012). Lipid concentration and composition also varies during frost acclimation, reducing the protein to lipid ratio and increasing the degree of unsaturation of the hydrocarbon chain in membranes. These changes increase membrane fluidity and also reduce their disintegration when plant tissues freeze. 80. (Schulze et al. 2005). Finally, antifreeze proteins and several amino acids are involved in the frost tolerance of plants (Griffith and Yaish 2004), inhibiting the growth of ice crystals (Atıcı and Nalbantoǧlu 2003) and contributing to osmotic adjustment (Zwiazek et al. 2001). Photoperiod and temperature trigger and determine the intensity and speed of. 85. frost acclimation in woody plants (Welling et al. 2002, Charrier et al. 2015). While both temperature and photoperiod control shoot frost tolerance, temperature seems to be the main control of root frost tolerance (Fernández et al. 2008, Ryyppö et al. 2008). Nutrient availability, especially of nitrogen (N), can also affect plant frost tolerance (Taulavuori et al. 2014, Charrier et al. 2015). However, some studies indicate that roots. 90. do not harden in response to environmental variations such as temperature, even in cold climates (Tinus et al. 2000; Schaberg et al. 2008). In contrast to temperature and photoperiod, however, no clear conclusions have been developed regarding the relationship between frost tolerance and N availability (see Taulavuori et al., 2014). Because frost tolerance of roots and shoots responds differently to environmental 4.
(6) 95. stimuli such as temperature and photoperiod, N may have variable effects on the frost tolerance of plant organs. Nitrogen deposition increases soil N and is a major environmental issue associated with global change (Rennenberg and Gessler 1999). Therefore, knowledge of the relationship between N and frost tolerance is important for assessing the potential. 100. responses of forest species to N deposition. Some studies have reported that high N availability reduces frost tolerance (Hellergren 1981, Schaberg et al. 2002, VillarSalvador et al. 2013, Heredia-Guerrero et al. 2014), associated with a lower tissue SC concentration (Andivia et al. 2012) and delayed cessation of shoot elongation in fall (Hawkins et al., 1995; Heredia-Guerrero et al. 2014). In contrast, other evidences. 105. suggest that plant frost tolerance increases with N availability in trees from temperate climates (DeHayes et al. 1989, Andivia et al. 2012, Taulavuori et al. 2014). N-rich osmolytes such as amino acids and cryoprotection proteins are expected to increase with soil N availability during frost acclimation (Lähdesmäki and Pietiläinen 1988; Griffith and Yaish 2004, Berrocal-Lobo et al. 2011). This may explain why N supply in fall. 110. during cold hardening increases frost tolerance in plants from cold and temperate ecosystems (DeHayes et al. 1989, Andivia et al. 2012). Contradictory results among studies on the effect of N on tree frost tolerance could be related to differences in N availability and application timing (Oliet et al. 2013) and to environmental conditions during the experiment (Heredia-Guerrero et al.. 115. 2014). However, variation among studies could also be attributable to functional differences among species. Particularly, physiology of dormancy as related to species ecology could determine the effects of N on frost tolerance during acclimation. Frost acclimation in trees adapted to mild winters is mainly controlled by temperature, while photoperiod plays a secondary role (Nguyen et al. 1995). These trees maintain growth 5.
(7) 120. during fall as long as temperature is not limiting and mild temperature spells in winter can quickly reduce frost tolerance (Charrier et al. 2015). High N availability, especially during the hardening period in fall, may hinder frost tolerance in these tree species (Puertolas et al., 2005). In contrast, frost acclimation in tree species from cold winter climates is usually under tight environmental control. Frost acclimation and cessation of. 125. shoot elongation begins early in the fall with photoperiod triggering frost acclimation (Charrier et al. 2015). These species usually maintain high frost tolerance during the cold season irrespective of winter conditions (Repo 1992). We expect that high N availability during the pre-hardening and hardening periods will enhance frost tolerance in these tree species. Therefore, to better understand the relationship between frost. 130. tolerance of tree species and N nutrition, and help to disentangle the underlying physiological mechanisms, comparative experiments where species are grown under the same environmental conditions are needed. The objective of this investigation was to analyze the role of plant ecology in determining the effect of N on frost tolerance. We selected four pine species that have. 135. contrasting ecological characteristics and differ in their frost acclimation physiology that were cultivated under the same environmental conditions. We compared frost tolerance of roots and shoots of seedlings during cold hardening in mid-fall and in winter. We also evaluated tissue N and SC concentration in needles and roots, and cessation of shoot elongation to assess the physiological mechanisms underlying frost. 140. acclimation. Differences in N and SC concentration in organs and growing cessation were achieved by supplying N at high and low rates during the pre-hardening period (growing season) and N loading during cold hardening in fall. The selected pine species are widespread in southern European regions characterized by Mediterranean climates. Pinus halepensis Mill. and Pinus pinea L. are 6.
(8) 145. thermophilic species that inhabit mild winter regions and have weak environmental control of dormancy. During winter, these species have high photosynthetic activity, can reactivate growth during mild spells (Puértolas 2005, Climent et al. 2011) and do not set buds in autumn during the seedling and early sapling stage (Mutke et al. 2012). Pinus pinaster Ait. is a mesophilic species that thrives mostly in mid-elevation mountains in. 150. Mediterranean-climate locations, while Pinus nigra J.F. Arnold is a high mountain, psychrophilic pine (Barbero et al. 1998). The last two species, especially P. nigra are usually exposed to intense and frequent frost events, set buds before dormancy in winter mediated by a strong endodormancy, and develop secondary needles earlier in their ontogeny than P. halepensis and P. pinea (Kreyling et al. 2012, Lafuente Laguna et al.. 155. 2013, Peñuelas et al. 2013). Some of these species coexist in the limits of their altitudinal range. We hypothesized that 1) the effect of N availability on frost tolerance during acclimation will be mediated by species ecology: while pine species inhabiting mild winter regions will have reduced frost tolerance under high N availability, those from cold winter regions will be positively influenced; 2) while timing of nutrient. 160. application (i.e., pre-hardening versus fall hardening) will affect frost tolerance of seedlings, the magnitude of this effect will depend on species; and 3) frost tolerance of roots will be less affected by N availability and timing of supply than shoots, because roots experience less cold acclimation in response to environmental shifts. The findings of this study can shed light on the mechanisms of frost tolerance in. 165. response to N availability, which up to date are far from being clarified for forest species (Taulavuori et al. 2014). This could help to better understand the effects of global change drivers such as N deposition on plant functioning, as well as to improve the cultivation of nursery seedlings.. 7.
(9) 170. Materials and methods Plant material and experimental design Seeds of the four-pine species were collected in the Southern part of the Iberian range (eastern Iberian Peninsula (Table S1, in Supplementary Material, Alía et al., 175. 2009). Seeds were sown on February 2012 at the Centro Nacional de Recursos Genéticos Forestales “El Serranillo” (Central Spain, 40º40’N, 3◦10’W, 650 m a.s.l.) into plastic trays (Plasnor® 190/300-45, Legazpi, Spain). These trays have 45 cells of 300 ml, and cultivation density is 283 plants·m-2. Growing medium was Sphagnum peat moss pH=4.7, enriched with a 16-10-20 NPK slow release fertilizer at a rate of 0.9. 180. kg·m-3 (Kekkila® White 420 F6, Finland). Trays were kept in an unheated greenhouse during germination and emergence phases to avoid late spring frost damage. On May 17, 2012 seedlings were transferred to the School of Forestry at the Technological University of Madrid (40°27’N; 3°43’W, 664 m a.s.l.) where the plants remained outdoors for the rest of the experiment. Plants were assigned to three fertilization. 185. treatments: 1) Pre-hardening high and 2) low fertilization, where each plant was supplied with 150 and 20 mg N, respectively, during the seedling active growth period before fall cold hardening, from May 22 to September 19, 2012; 3) Fall fertilization, where each plant was supplied with 60 mg N during the seedling active growth period from May 22 to September 19 2012 plus 40 mg N·plant-1 during the fall, from. 190. September 26 to November 8, 2012. Fertilizer was applied by hand at a weekly constant rate using a water-soluble fertilizer. Fall fertilization extra supply was applied as ammonium nitrate, while for the rest of treatments the fertilizer was 20N–20P2O5– 20K2O (Scotts Co., Marysville, OH, USA) with N sources being ammonium nitrate (10%) and urea (10%). On every fertilization date, each seedling received 55 ml of the 8.
(10) 195. fertilization solution. After fertilization, seedlings were watered for 5 min to remove the fertilizer remaining on the needles. Supplemental irrigation was applied to field capacity based on gravimetric methods (Timmer and Armstrong 1987). Each fertilization treatment had three trays, resulting in a total of nine trays per species. Trays were completely randomized in space and their position was rotated every 15 days to. 200. minimize edge effects. Experimental design was a two factorial, with species (four levels) and fertilization treatments (three levels) as main effects. Seedlings were grown under full sun except from June 20 to September 15, where plants grew under a shading with a 20 % light transmission to reduce evapotranspiration.. 205. Frost tolerance measurements Freezing tests were carried out on two dates: in mid-November 2012, when seedlings were still frost acclimating and in late-January 2013, when plants are fully frost-hardened (Climent et al, 2009; Pardos et al. 2014). The temperature was measured every 10 minutes during the acclimation period using temperature probes placed. 210. adjacent to the experiment (Figure S1, in Supplementary Material). Accumulated chilling hours (air temperature ≤ 8 ºC calculated from September 1) in the nursery were 130 h in mid-November and 1367 h in January. Temperature frequently dropped below 0 ºC before the freezing test in January, reaching a minimum temperature of -4.9 ºC, while in November frosts were only registered in three days (Figure S1, in. 215. Supplementary Material). The average temperature the 20 days before the freezing tests was 10.0 ºC in autumn and 5.9 ºC in winter (Figure S1, in Supplementary Material). Frost tolerance was assessed on intact plants and freezing separately the roots and the shoots. Six seedlings per species, treatment and plant fraction (two seedlings per tray, 72 seedlings per plant fraction) were randomly selected on each date and subjected to an 9.
(11) 220. 8-h frost cycle in freezing chambers with a programmable temperature controller (ASLSnijders International® CON-550-20, Madrid, Spain and Dycometal® CCK81, Barcelona, Spain, for the November and January tests, respectively). Temperature was reduced from 5 ºC to a target temperature where plants remained for 4 h. Then the temperature was progressively raised until 5 ºC. The target temperatures varied. 225. depending on the date and plant fraction (roots and shoots) (Table 1) and were chosen based on previous results obtained in other studies with these species (Puértolas et al., 2005; Villar-Salvador et al., 2013; Kreyling et al., 2012; Climent et al., 2009). Cooling and warming rates in a frost cycle ranged between 2 and 8 ºC h-1 in order to simulate natural frost cycle and to keep the freezing test duration to 8 h.The exception was for. 230. the target temperature of -23 ºC, where the cooling rate was 13 ºC h-1 while warming rates were 18 ºC h-1. Frost tolerance of shoots was assessed by inserting the trays in a polystyrene box that isolated the plugs from the frost. A thermocouple was placed inside the insulation cover and attached to the surface of the plug to record its temperature, which was on average 6.5 ºC higher than the air inside the freezing chamber for the -8. 235. ºC freezing test and 12.5 ºC higher for the remaining target temperatures. To assess the frost tolerance of roots, seedlings were placed in a modified cultivation tray in which the wall of the cells was replaced by a 2-mm plastic mesh that allowed the plug to be fully frozen. To prevent root desiccation, the plants were watered the day before and the plug was wrapped in aluminum foil during freezing tests. Shoots were insulated from. 240. frost by the same polystyrene cover used to isolate the root system. After freezing tests, seedlings were transferred to a 60% light transmission greenhouse and kept watered at field capacity for two months. The average temperature in the greenhouse was 17 ºC during the two months following November frost tests and 19.5 ºC for the two months after the January frost tests. After the two months, shoot 10.
(12) 245. damage was assessed visually by two independent observers as the percentage of withered needles. This value (visual damage index, VDI) is strongly correlated with other frost tolerance indicators (Andivia et al. 2011) and was considered as an estimator of shoot or root frost tolerance based on previous studies that show that root and shoot damage have an effect on the whole seedling (Carles et al. 2011).. 250. Growth and nitrogen and soluble carbohydrates concentration From August 21, 2012, prior the hardening stage, to January 3, 2013, seedling height was measured weekly on five randomly chosen seedlings per tray (15 plants per fertilization treatment and species, 180 seedlings in total). Measurements were carried 255. out on the same plants throughout the study period. Shoot height was measured from a set point 5 mm below the cotyledon insertion scar to the apex of the bud in P. nigra, and to the tip of the shoot in the remaining species, which do not set a bud during the first years of life. The Julian day of cessation of shoot elongation was determined when weekly shoot elongation was lower than 0.6 cm (Heredia et al., 2014).. 260. To determine seedling mass and N and SC concentration during hardening, 15 seedlings per species and treatment (five seedlings per tray) were randomly harvested at both freezing test dates and frozen to -20 ºC until processing. Once defrosted, shoots were cut 5 mm below the cotyledon insertion point and separated into needles and stems, and roots were carefully washed from the growing medium with tap water.. 265. Samples were rinsed in distilled water for 3 min to avoid contamination. Then leaves, stems and roots were dried at 60 ºC for 48 h and weighed to assess their mass. To analyze organ N and SC concentrations, the organs of the five seedlings of the same tray were composited and ground in a ball mill (PM 100, Retsch, Haan, Germany).. 11.
(13) SC were analyzed in leaves and roots using a high-performance liquid 270. chromatograph (HPLC). Grounded leaf samples of 50 mg were extracted twice in 80% aqueous ethanol (v/v) at 80 ºC for 90 min. Samples were centrifuged at 13000 g for 5 min and the supernatant was completely evaporated and resolubilized in 5 ml distilled water and boiled for 5 min. The resulting solution was filtered through a 0.45 μm nylonsyringe and 20 μl was injected to HPLC using an Agilent 1100 Series (Agilent. 275. Technologies, Palo Alto, CA) equipped with a refractive index detector. A carbohydrate column (SupelcogelTMCa, 30 × 0.78 cm, Supelco, Bellefonte, PA, US) was used for the analysis. SC peaks were detected by refractive index and were identified and quantified by comparison with retention times of fructose, glucose and sucrose standards (Heredia et al. 2014). Determination of leaf and root N concentration was done by the standard. 280. Kjeldahl method using an auto-analyzer (CFA SAN++, Skalar, Breda, The Netherlands).. Data analysis For all analyses, P-values were computed using F-tests as well as a 285. randomization protocol that generated null distributions of variables and interactions by randomly reshuffling these data across species 1000 times (Monte Carlo method, Crowley 1992). For each of these subsamples we obtained the F-value of a two-way ANOVA analysis with species and treatments as main factors including interactions. The resulting 1000 F-values were compared with the F-value (ANOVA) from the. 290. observed data. The P-value is the proportion of all data arrangements resulting in a test statistic at least as extreme in magnitude as the F-value from the observed data. P-values thus generated are expected to be more robust against potential biases in data (Crowley 1992). The differences between means were identified using Fisher’s least significant 12.
(14) difference (LSD) test. All analyses were performed in R software (R Foundation for 295. Statistical Computing, Vienna, AT).. Results Differences in root frost damage Species differed in VDI after root freezing at -10 °C both in November and 300. January (Table 1). Pinus halepensis and P. pinea had the highest VDI values, with no significant differences between them (30.6% ± 6.7 in November and 36.2% ± 9.3 in January for P. halepensis and 26.0± 5.7 and 33.5% ± 9.4, respectively for P. pinea). In contrast, P. nigra had the lowest VDI values (7.6% ± 1.5 and 2.6% ± 0.6 in November and January, respectively), while P. pinaster had intermediate VDI values (12.4% ± 1.5. 305. and 20.9% ± 3.4 in November and January, respectively) between P. nigra and the other pine species (Figure 1). Fertilization significantly affected VDI after root freezing, but differences among treatments depended on species in November (interaction Species × Fertilization, Table 1). By this date, the highest VDI occurred for the high pre-hardening. 310. fertilized P. halepensis and P. pinea seedlings, while the opposite was observed for P. nigra, with the low pre-hardening fertilized seedlings having the highest VDI. In addition, fall-fertilized seedlings presented similar or slightly lower VDI values than those from low fertilized plants and in most cases, lower VDI values than those from high fertilized plants (Figure 1a).. 315. In January, fall-fertilized seedlings showed the lowest root VDI values (7.0% ± 1.5), while high and low pre-hardening fertilized seedlings showed the highest VDI (Figure 1b). Among species, P. pinaster VDI responses to fertilization were the less. 13.
(15) plastic at both dates. On average, root VDI remained similar between November and January (18.5%± 2.3 and 23.4%± 3.7, respectively). 320. Differences in shoot frost damage Species differed in VDI after shoot freezing at -8°C in November, with overall VDI values of 50.0% ± 8.3, 36.0% ± 5.2, 17% ± 2.9 and 4.0% ± 0.7 for P. halepensis, P. pinea, P. pinaster and P. nigra, respectively. However, a strong Species × 325. Fertilization interaction was observed (Table 1). Low fertilization resulted in the highest VDI values in all species except for P. pinaster, which showed the highest VDI values in both high and low fertilized plants. Fall fertilized seedlings had the lowest VDI in P. halepensis and P. pinaster, while no difference between fall and high fertilization was found in the rest of species. In contrast, high fertilization led to intermediate VDI values. 330. between high and fall fertilized plants in P. halepensis (Figure 2a). After the -15 ºC frost in November, VDI differed among species but not among fertilization treatments (Table 1). While P. halepensis and P. pinea showed almost complete damage (overall mean for both species: 98.7% ± 0.7) irrespective of fertilization treatment, P. nigra had the lowest VDI values (17.7% ± 4.2 across. 335. fertilization treatments). Finally, P. pinaster had intermediate VDI values (61.8% ± 6.1) between P. nigra and the other pine species. In January, after a -15 °C frost VDI significantly differed among species (Table 1), with P. halepensis and P. pinea showing the highest values (59.3% ± 8.8 and 41.3% ± 5.2, respectively) followed by P. pinaster (17.8% ± 2.0) and finally P. nigra, which. 340. had the lowest VDI value (3.4% ± 0.5). We found a marginally significant Species × Fertilization interaction (P=0.065), explained by a maximum VDI of high fertilized P. 14.
(16) halepensis and P. Pinea seedlings, that did not occur in P. nigra and in P. pinaster (Figure 2b). On average, shoot VDI after -15°C frost decreased strongly from November to January (69.4 ± 4.3 and 29.7 ± 3.6, respectively). 345. In January, all seedlings of P. halepensis, P. pinea and P. pinaster died after the -23°C frost test. In contrast, most P. nigra seedlings survived with fall fertilized and pre-hardening high fertilized seedlings having the lowest VDI values, without significant differences between them (9.3% ± 2.4 and 16.8% ± 5.5, respectively), while low fertilization the highest (32.5% ± 7.7) (Species × Fertilization interaction, Table 1).. 350. Cessation of shoot elongation On average, P. nigra and P. pinaster seedlings ceased shoot elongation 17 days earlier than P. halepensis and P. pinea (F=14.9, P<0.001), while no significant difference existed between the species within the two previous groups (Figure 3). 355. However, a significant Species × Fertilization interaction occurred on cessation of shoot elongation (F=7.8, P<0.01). The effect of N fertilization on the cessation of shoot elongation presented a similar pattern in P. halepensis, P. pinea and P. nigra, with high and fall fertilization delaying the cessation of shoot elongation by 20 days on average relative to low fertilized plants (Figure 4). In contrast, fall fertilized P. pinaster plants. 360. stopped shoot elongation earlier than high and low fertilized plants, which showed no differences between them.. Nitrogen and soluble carbohydrates concentration Needle N concentration was highest among the fall and high fertilized seedlings 365. and lowest in the low fertilized plants in all species and in both dates. However, in both 15.
(17) freezing dates, the fertilization effect on needle N concentration was mediated by an interaction between Species and Fertilization, (F=3.4, P<0.008). In November, fall fertilized P. halepensis seedlings showed higher needle N concentration than high fertilized seedlings (Figure 4a) while in January, needles of high fertilized P. pinea 370. seedlings had higher N concentration than the fall fertilization treatment (Figure 4b). Root N concentration was lower than needle N concentration but differences among species and fertilization treatments followed an overall similar pattern as described for needle N (interaction Species × Fertilization at both dates, F=3.4, P<0.007; Figure 4c and 4d), especially in P. pinaster and P. nigra.. 375. Irrespective of fertilization treatment, N concentration differed among species in November. By this date, species ranking in both needle and root N concentration was P. nigra > P. halepensis > P pinea = P. pinaster (Figure 4). N concentration decreased in both needles and roots from November to January in all species and differences in organ N among species were small in January.. 380. Needle and root SC concentration varied significantly among species in November (F= 19.6 P<0.001 for roots; F= 57.7 P<0.001 for needles). Pinus pinaster and P. nigra needles showed the highest and lowest needles SC concentration respectively, while P. halepensis and P. pinea had intermediate values between the former species with no significant differences between them (Figure 5a). In contrast, SC. 385. concentration in roots was higher in P. nigra and P. pinea than in P. pinaster and P. halepensis, while no significant differences existed between the species within the two previous groups (Figure 5b). On the same date, high and fall N fertilization had similar but higher needle SC concentration than the low N fertilization (F=8.0, P<0.01). Root SC concentration in November was highest in the high fertilized plants followed by fall. 16.
(18) 390. fertilized seedlings, while low fertilized seedlings showed the lowest SC concentration (F=19.9, P<0.001). No interaction between Species and Fertilization occurred for SC. In January, SC concentration was affected by a significant Species × Fertilization interaction in both shoots and roots (F=3.4, P=0.015 and F=7, P<0.001, respectively). In both fractions, high fertilized P. nigra seedlings had higher SC. 395. concentration than low and fall fertilized seedlings, which showed no difference between them (Figure 6). In contrast, fall fertilized plants and low fertilized plants had in almost all cases the highest and lowest SC concentration, respectively, in P pinea and P. halepensis. Finally, P. pinaster root and needle SC concentrations were not affected by N fertilization (Figure 6). Root and shoot SC significantly decreased between. 400. November and January (F=4.5, P=0.007 and F=7.1, P<0.001, respectively).. Discussion Despite the close phylogenetic relatedness of the studied species, N availability differentially affected seedling frost tolerance among them. These differences conform 405. with knowledge of their ecology and frost acclimation physiology. We found three patterns in the frost tolerance responses to N availability during the pre-hardening period: 1) High N increased frost tolerance in P. nigra, the psychrophilic species that lives in cold winter locations and has strong endodormant control of growth and cold acclimation (Peñuelas et al. 2013); 2) High N hindered frost tolerance in the. 410. thermophilic species, P. halepensis and P. pinea, the species inhabiting the mild winter sites and having an eco-dormant growth and cold acclimation physiology (Navarro Cerrillo et al. 2013, Puértolas et al. 2013); and 3) N fertilization had little effect on the frost tolerance of the mesophilic species P. pinaster. This result supports our first hypothesis and indicates that species ecology and dormancy physiology determine the 17.
(19) 415. effect of N availability on plant frost tolerance. A major finding of our study was that despite strong species differences in the frost response to N availability during prehardening, N supply in the fall during the hardening period consistently increased the frost tolerance in all species. This result does not support our hypothesis that the timing of nutrient application will have a varying effect among species with contrasting. 420. ecology. In contrast to findings linking frost tolerance to cessation of shoot elongation in the fall (Repo et al. 2000, Heredia-Guerrero et al. 2014), SC concentration (Greer et al., 2000; Tinus et al., 2000; Villar-Salvador et al. 2013), and organ N concentration (DeHayes et al., 1989, Rikala and Repo, 1997), we found these attributes to be largely unrelated to frost tolerance differences across species and N treatments. It is possible. 425. that the differences among species may be the result of different strategies in using N for frost tolerance and mechanisms of growth control (Charrier et al. 2013). We discuss these species differences in frost tolerance strategies below. Root and shoot frost tolerance Shoot and root frost acclimation physiology showed notable differences. First,. 430. shoot frost tolerance increased in all species between mid-fall and early-winter as indicated by lower VDI values in January than in November after the -15°C freezing tests. This result agrees with the well-known fall freezing acclimation patterns observed in the aboveground tissues of temperate- and cold-climate trees (Tinus et al. 2000, Bigras et al. 2001, Pardos et al. 2014). In contrast to shoots and consistent with our third. 435. hypothesis, frost tolerance of roots remained unchanged between studied dates in all species (Figure 1). A similar lack of root cold acclimation through the fall was found for P. halepensis and Pinus radiata (Tinus et al. 2000) and Juglans regia (Charrier, Poirier, et al. 2013). In contrast to our findings, significant fall root cold hardening was reported for Pseudotsuga menziesii (Tinus et al. 2000). Soil insulates the roots from frost under 18.
(20) 440. natural conditions, which could explain the low or lack of cold acclimation in some woody species. In climates where snow remains on soil for an extended period, however, the reduction of snow cover and/or earlier snow melting increases the risk of root damage by frost (Groffman et al. 2001, Schaberg et al. 2008).. Second, shoot and root frost tolerance responded similarly to N availability 445. during pre-hardening in the psychrophilic and mesophilic species (P. nigra and P. pinaster, respectively) and the response changed little between the studied dates. N availability during pre-hardening also affected frost tolerance in the thermophilic pines (P. halepensis and P. pinea) but unlike the psychrophilic pines, the response of frost tolerance to N availability diverged between organs and dates. While the roots exhibited. 450. lowest frost tolerance in mid-fall and in winter with high rate of pre-hardening N fertilization, shoots had the opposite response in November, showing the lowest frost tolerance with the low rate of pre-hardening N fertilization. However, in January shoots had the same response to N as roots. The different effect of N availability on shoot frost tolerance in the thermophilic species through the cold season likely was the result of. 455. distinct physiological processes, which importance varied along the cold acclimation process. We suggest that shoot frost tolerance was lowest in low fertilized seedlings in November, likely due to low N-rich cryoprotectant metabolites (Andivia et al. 2012). This hypothesis is supported by the fact that needle N concentration in November in the low fertilized plants was in most cases close to 10-13 mg g-1 (Figure 4), which is. 460. considered deficient for these species (deficient threshold values for studied species range between 11 to 15 mg g-1 (Oliet et al. 2006, Lafuente Laguna et al. 2013, Navarro Cerrillo et al. 2013, Peñuelas et al. 2013, Puértolas et al. 2013). In contrast to results in November, the lower frost tolerance of high N fertilized seedlings in January of thermophilic species might be explained by cold dehardening compared to the other N 19.
(21) 465. treatments (Fløistad and Kohmann 2004), thereby reducing their frost tolerance. The earlier cold dehardening in high N fertilized seedlings could be due to the increase in temperatures registered in mid-January (Figure S1, in Supplementary Material). In the cryophilic species, P. nigra and to a lesser extent in P. pinaster, frost tolerance in both shoots and roots was lowest for the low N pre-hardening treatment during both fall and. 470. winter, which also supports the N deficiency hypotheses. Contrary to shoots, the effect of N availability on root frost tolerance remained similar among species over the cold season in our study, probably because roots do not experience cold hardening in these species (Tinus et al. 2000, Kreyling et al. 2012). Fernández et al (2017) showed no differences among our studied species in. 475. vulnerability to stem xylem freezing-induced embolism. Thus, we presume that differences in stem xylem freezing-induced embolism at interspecific level due to changes in N availability are unlikely and that the differences in frost sensitivity in response to N availability are due to differences in foliage and root frost sensitivity. Cessation of shoot elongation. 480. Cessation of shoot elongation is essential for frost acclimation to occur (Greer et al. 2000). The idea that high-N fertilized plants are more vulnerable to frost lies on observations that high N availability delays the cessation of shoot elongation in fall (Heredia-Guerrero et al., 2014; Rikala and Repo, 1997). Consistent with this idea, an increase in N availability delayed the cessation of shoot elongation in our study.. 485. However, we did not find a clear connection between cessation of shoot elongation and frost tolerance. Several results support this assertion. First, low N availability during pre-hardening advanced the cessation of shoot elongation 20 days in three out of four species, but low N seedlings had the lowest shoot frost tolerance in November (Figure 20.
(22) 2). Second, fall fertilization strongly delayed growth cessation in most species but these 490. seedlings showed the highest frost tolerance in mid fall. Third, P. nigra and P. pinaster showed similar timing of cessation of growth elongation but P. nigra was more coldtolerant than P. pinaster. A similar lack of relationship between frost tolerance and growth cessation was found in Pseudotsuga menziesii (Hawkins et al., 1995) and Pinus sylvestris (Rikala and Repo 1997). Thus, our results illustrate that cessation of shoot. 495. elongation may trigger frost acclimation but does not affect the intensity of frost acclimation. Consequently, species with late cessation of shoot elongation such as P. pinea and P. halepensis incur a higher risk of freezing damage due to early fall frost than species that cease elongation earlier in the fall, but without additional cascading effects. We believe that the benefit of high N availability during fall may override. 500. differences in timing of growth cessation once it has occurred (mid-fall frost tolerance measurements were conducted after shoot growth cessation of all treatments and species), and reinforces the idea that N supplied during hardening is preferentially invested in frost tolerance N-rich metabolites. Soluble carbohydrates. 505. The general consensus in scientific literature is that SC are involved in plant frost tolerance and an increase in frost tolerance is positively related to SC at a withinspecies level (Greer et al. 2000, Tinus et al. 2000, Morin et al. 2007, Kreyling et al. 2012). However, we did not find a clear link between frost tolerance across N fertilization treatments and SC. In our study, needle SC concentration was lower in the. 510. psychrophilic (most frost tolerant) species P. nigra, than in the thermophilic (least frost tolerant) species. Within species, frost tolerance followed a very different pattern compared to SC concentrations under the influence of N treatments. Furthermore, SC 21.
(23) concentration in November was higher than in January; however, shoot frost tolerance increased over the same period. The lack of studies that compare the effect of soluble 515. carbohydrates on frost tolerance across species complicates the clarification of this relationship. To our knowledge, this relationship has only been addressed in two interspecific studies (Morin et al. 2007, Charrier et al. 2013); however, the results are not conclusive, especially when broadleaves and conifers are compared under the same environmental conditions. Nevertheless, some studies show that a clear cause/effect. 520. relationship does not exist between soluble carbohydrates concentration and frost tolerance (Zhang et al. 2003, Andivia et al. 2011). In agreement with these studies, our results show a similar lack of relationship between soluble carbohydrates concentration and frost tolerance in the tested pine species, reinforcing the idea that other metabolites than soluble sugars such as antifreeze proteins and membrane stabilization metabolites. 525. are more important for cold hardening of pines species (see discussion below). As for the shoot, root SC concentration was unrelated to frost tolerance. Roots of pine species invest most SC in growth during winter (Hansen and Beck 1994) and so it is likely that SC are involved relatively little in frost tolerance; rather, variation in concentration might reflect physiological activities such as storage, remobilization, and. 530. fine root growth over winter. Nitrogen concentration in needles and roots The role of tissue N in the frost tolerance of plants is controversial (VillarSalvador et al. 2015). While some studies have shown positive links between frost tolerance and tissue N (Rikala and Repo 1997, Bigras et al. 2001, Andivia et al. 2011). 535. others have shown the reverse trend (Hawkins et al. 1995, Fløistad and Kohmann 2004, Villar-Salvador et al. 2013). In our study, we have found evidence supporting a positive relationship between both variables. For instance, low-N fertilized plants, which showed 22.
(24) the lowest tissue N concentration (Figure 4), had overall lower shoot frost tolerance in November than the high-N fertilized seedlings. Many plants invest available N during 540. cold hardening in antifreeze proteins and dehydrins (Kontunen-Soppela et al. 2000, Atıcı and Nalbantoǧlu 2003, Griffith and Yaish 2004) and N was found to be critical for repairing root xylem frost-induced embolism in several species (Ewers et al. 2001). Other results of our study, however, do not support a link between frost tolerance and tissue N. For instance, tissue N concentration in November was greatest in the highest. 545. and lowest frost tolerant species, P. nigra and P. halepensis, respectively. Similarly, within species, seedlings showing similar N concentrations varied significantly in their frost tolerance. Specifically, fall fertilized seedlings had higher frost tolerance than prehardening high-N fertilized plants, particularly in thermophilic species. Taken together, our results indicate that timing of N supply is critical for frost tolerance and that the. 550. variation in frost tolerance between treatments and species are not driven by differences in tissue N concentrations per se, but likely by how N is allocated to major plant functions. It is possible that N taken up during the period of cold hardening and cessation of shoot elongation is mainly allocated to N-rich compounds involved in frost tolerance (Andivia et al. 2012), while N supplied during the pre-hardening season is. 555. primarily allocated to growth at the expense of frost tolerance and this trade-off may differ among species. This suggestion could explain why some studies have reported that high fertilization applied at pre-hardening reduced frost tolerance of thermophilic species (Puérolas et al. 2005; Villar-Salvador et al. 2013). Future comparative studies of the timing and magnitude of N availability should be designed to: 1) address whether. 560. species differ in allocation to N-metabolites involved in frost tolerance; and 2) identify specifically which N-metabolites are involved in these processes.. 23.
(25) Conclusions Four Pinus species of close phylogenetic relationship, yet with distinct 565. ecophysiology of cold hardening, showed variable frost tolerance response to N availability at pre-hardening when cultivated under the same environmental conditions. In contrast, N availability during hardening clearly increased frost tolerance of all four species, highlighting the importance of timing of N availability for development of frost resistance of seedlings. Our results can help to design specific fertilization regimes for. 570. plant production, with emphasis on the fall fertilization treatment due to its increase of frost tolerance and N reserves. Differences in frost tolerance among species and levels of N availability were not explained by gradients of soluble carbohydrate concentrations nor by timing of growth cessation. Additionally, frost resistance dynamics during hardening varied between roots and shoots. Shoots and roots were sensitive to N. 575. availability, but while shoots increased in frost tolerance over winter and (in the thermophilic species) can alter the relationships between N and frost tolerance, roots remained unchanged along the hardening period. These contrasting effects of N on the frost tolerance of roots and shoots among pine species may be a result of physiological differences among species and the frost acclimation strategies of specific organs.. 580. Acknowledgements We appreciate the help from the Centro ‘‘El Serranillo’’ (MAGRAMA) and Centro de Investigación Forestal (INIA-CIFOR) which supported the study with seedlings and laboratory assistance. We are grateful to Bruno Vilela for the support with the data analysis. We appreciate the constructive comments of two anonymous. 585. reviewers.. 24.
(26) Funding This research was supported by the projects AGL2011-24296 (ECOLPIN), CGL2014-53308-P (SERAVI) and by the network REMEDINAL 3 (S2013/MAE-2719) 590. of the Community of Madrid.. 25.
(27) References Alía Miranda R, García del Barrio, J.M. Iglesias Sauce S, Mancha Núñez JA, de Miguel y del Ángel J, Nicolás Peragón JL, Pérez Martín F, Sánchez de Ron D (2009) Regiones de procedencia de especies forestales españolas. Organismo Autónomo de Parques Nacionales, Madrid, Spain. Andivia E, Fernández M, Vázquez-Piqué J (2011) Autumn fertilization of Quercus ilex ssp. ballota (Desf.) Samp. nursery seedlings: effects on morpho-physiology and field performance. Ann For Sci 68:543–553. Andivia E, Márquez-García B, Vázquez-Piqué J, Córdoba F, Fernández M (2012) Autumn fertilization with nitrogen improves nutritional status, cold hardiness and the oxidative stress response of Holm oak (Quercus ilex ssp. ballota [Desf.] Samp) nursery seedlings. Trees 26:311–320. Atıcı Ö, Nalbantoǧlu B (2003) Antifreeze proteins in higher plants. Phytochemistry 64:1187–1196. Augspurger CK (2013) Reconstructing patterns of temperature, phenology, and frost damage over 124 years: Spring damage risk is increasing. Ecology 94:41–50. Barbero M, Loisel R, Quézel P, Romane F, Richardson DM (1998) Pines of the Mediterranean Basin. In: Richardson D (ed) Ecology and Biogeography of Pinus. Cambridge University Press, Cambridge, UK, pp 153–170. Berrocal-Lobo M, Ibañez C, Acebo P, Ramos A, Perez-Solis E, Collada C, Casado R, Aragoncillo C, Allona I (2011) Identification of a homolog of Arabidopsis DSP4 (SEX4) in chestnut: its induction and accumulation in stem amyloplasts during winter or in response to the cold. Plant Cell Environ 34:1693–704. Bigras FJ, Ryyppö A, Lindström A, Stattin E (2001) Cold acclimation and deacclimation of shoots and roots of conifer seedlings. In: Bigras FJ, Colombo 26.
(28) SJ (eds) Conifer cold hardiness. Kluwer Academic, Dordrecht-Boston, pp 57– 88. Carles S, Lamhamedi MS, Stowe DC, Bernier PY, Veilleux L, Margolis H a. (2011) Relationships between frost hardiness, root growth potential, and photosynthesis of nursery-grown white spruce seedlings. Ann For Sci 68:1303–1313. Charrier G, Cochard H, Ameglio T (2013) Evaluation of the impact of frost resistances on potential altitudinal limit of trees. Tree Physiol 33:891–902. Charrier G, Ngao J, Saudreau M, Améglio T (2015) Effects of environmental factors and management practices on microclimate, winter physiology, and frost resistance in trees. Front Plant Sci 6:1–18. Charrier G, Poirier M, Bonhomme M, Lacointe A, Améglio T (2013) Frost hardiness in walnut trees (Juglans regia L.): How to link physiology and modelling? Tree Physiol 33:1229–1241. Climent J, San-Martín R, Chambel MR, Mutke S (2011) Ontogenetic differentiation between Mediterranean and Eurasian pines (sect. Pinus) at the seedling stage. Trees - Struct Funct 25:175–186. Climent J, Costa e Silva F, Chambel MR, Pardos M, Almeida MH (2009) Freezing injury in primary and secondary needles of Mediterranean pine species of contrasting ecological niches. Ann For Sci 66:407–407. Crowley PH (1992) Resampling methods for data analysis in ecology and evolution. Annu Rev 23:405–447. DeHayes DH, Ingle MA, Waite CE (1989) Nitrogen fertilization enhances cold tolerance of red spruce seedlings. Can J For Res 19:1037–1043. Ewers FW, Améglio T, Cochard H, Beaujard F, Martignac M, Vandame M, Bodet C, Cruiziat P (2001) Seasonal variation in xylem pressure of walnut trees: root and 27.
(29) stem pressures. Tree Physiol 21:1123–32. Fernández-Pérez L, Villar-Salvador P, Martínez-Vilalta J, Toca A, Zavala MA (2017) Distribution of pines in the Iberian Peninsula agrees with species differences in foliage frost tolerance, not with vulnerability to freezing-induced xylem embolism (under review) Fernández M, Alejano R, Domínguez L, Tapias R (2008) Temperature controls cold hardening more effectively than photoperiod in four Mediterranean broadleaf evergreen species. Tree For Sci Biotechnol 2:43–49. Fløistad IS, Kohmann K (2004) Influence of nutrient supply on spring frost hardiness and time of bud break in Norway spruce (Picea abies (L.) Karst.) seedlings. New For 27:1–11. Grace J (1987) Climatic tolerance and the distribution of plants. New Phytol 106:113– 130. Greer DH, Robinson L a., Hall AJ, Klages K, Donnison H (2000) Frost hardening of Pinus radiata seedlings: effects of temperature on relative growth rate, carbon balance and carbohydrate concentration. Tree Physiol 20:107–114. Griffith M, Yaish MWF (2004) Antifreeze proteins in overwintering plants: a tale of two activities. Trends Plant Sci 9:399–405. Groffman PM, Driscoll CT, Fahey TJ, Hardy JP, Fitzhugh RD, Tierney GL (2001) Colder soils in a warmer world: A snow manipulation study in a northern hardwood forest ecosystem. Biogeochemistry 56:135–150. Hansen J, Beck E (1994) Seasonal changes in the utilization and turnover of assimilation products in 8-year-old Scots pine (Pinus sylvestris L.) trees. Trees 8:172–182. Hawkins BJ, Davradou M, Pier D, Shortt R (1995) Frost hardiness and winter 28.
(30) photosynthesis of Thuja plicata and Pseudotsuga menziesii seedlings grown at three rates of nitrogen and phosphorus supply. Can J For Res 25:18–28. Hawkins B, Rueda M, Rangel TF, Field R, Diniz-Filho JAF, Linder P (2014) Community phylogenetics at the biogeographical scale: cold tolerance, niche conservatism and the structure of North American forests. J Biogeogr 41:23–38. Hellergren J (1981) Frost hardiness development in Pinus silvestris seedlings in response to fertilization. Physiol Plant 52:297–301. Heredia-Guerrero N, Oliet JA, Villar-Salvador P, Benito LF, Peñuelas JL (2014) Fertilization regime interacts with fall temperature in the nursery to determine the frost and drought tolerance of the Mediterranean oak Quercus ilex subsp. ballota. For Ecol Manage 331:50–59. Kontunen-Soppela S, Taulavuori K, Taulavuori E, La P, Laine K (2000) Soluble proteins and dehydrins in nitrogen-fertilized Scots pine seedlings during deacclimation and the onset of growth. Physiol Plant 109:404–409. Kreyling J, Schmid S, Aas G (2014) Cold tolerance of tree species is related to the climate of their native ranges. J Biogeogr 42:156–166. Kreyling J, Wiesenberg GLB, Thiel D, Wohlfart C, Huber G, Walter J, Jentsch A, Konnert M, Beierkuhnlein C (2012) Cold hardiness of Pinus nigra Arnold as influenced by geographic origin, warming, and extreme summer drought. Environ Exp Bot 78:99–108. Lafuente Laguna D, Rodríguez-Núñez L, Majada J (2013) Pinus pinaster A. In: Pemán J, Navarro-Cerrillo RM, Nicolás JL, Prada MA, Serrada R (eds) Producción y Manejo de Semillas y Plantas Forestales. Tomo II. Organismo Autónomo Parques Nacionales, Madrid, Spain, pp 900–927. Lähdesmäki P, Pietiläinen P (1988) Seasonal variation in the nitrogen metabolism of 29.
(31) young Scots pine. Silva Fenn 22:233–240. Larcher W (2005) Climatic Constraints Drive the Evolution of Low Temperature Resistance in Woody Plants. J Agric Meteorol 61:189–202. Levitt J (1980) Responses of plants to environmental stresses. Vol. 1. Chilling, freezing, and high temperature stress. Academic Press, New York. Martínez-Vilalta J, Sala A, Asensio D, Galiano L, Hoch G, Palacio S, Piper FI, Lloret F (2016) Dynamics of non-structural carbohydrates in terrestrial plants: A global synthesis. Ecol Monogr 86:495–516. Morin X, Améglio T, Ahas R, Kurz-Besson C, Lanta V, Lebourgeois F, Miglietta F, Chuine I (2007) Variation in cold hardiness and carbohydrate concentration from dormancy induction to bud burst among provenances of three European oak species. Tree Physiol 27:817–825. Mutke S, Calama R, González-Martínez SC, Montero G, Gordo FJ, Bono D, Gil L (2012) Mediterranean stone pine: Botany and horticulture. Hortic Rev 39:153– 201. Navarro Cerrillo RM, Sánchez Lancha A, Arroyo Sauces M, Plaza Arregui L, Mallofret Carrera E, Lara Gómez M, Monge R (2013) Pinus pinea L. In: Pemán J, Navarro-Cerrillo RM, Nicolás JL, Prada MA, Serrada R (eds) Producción y Manejo de Semillas y Plantas Forestales. Tomo II. Organismo Autónomo Parques Nacionales, Madrid, Spain, pp 928–959. Nguyen A, Dormling I, Dremer A (1995) Characterization on Pinus pinaster seedling growth in different photo- and thermoperiods in a phytotron as a basis for early selection. Scand J For Res 10:129–139. Ogren E, Nilsson T, Sundblad L-G (1997) Relationship between respiratory depletion of sugars and loss of cold hardiness in coniferous seedlings over-wintering at raised 30.
(32) temperatures: indications of different sensitivities of spruce and pine. Plant, Cell Environ 20:247–253. Oliet JA, Puértolas J, Planelles R, Jacobs DF (2013) Nutrient loading of forest tree seedlings to promote stress resistance and field performance: a Mediterranean perspective. New For 44:649–669. Oliet JA, Valdecantos A, Puértolas J, Trubat R (2006) Influencia del estado nutricional y el contenido en carbohidratos en el establecimiento de las plantaciones. In: Oliet J, Valdecantos A, Puértolas J, Trubat R (eds) Calidad de planta forestal para la restauración en ambientes mediterráneos. Organismo Autónomo Parques Nacionales, Ministerio de Medio Ambiente, Serie Forestal, Madrid, pp 89–117. Pardos M, Climent J, Almeida H, Calama R (2014) The role of developmental stage in frost tolerance of Pinus pinea L. seedlings and saplings. Ann For Sci 71:551– 562. Peñuelas JL, Nicolás Peragón JL, Benito Matias LF (2013) Pinus nigra subsp. salzmannii (Dunal) Franco. In: Pemán J, Navarro-Cerrillo RM, Nicolás JL, Prada MA, Serrada R (eds) Producción y Manejo de Semillas y Plantas Forestales. Tomo II. Organismo Autónomo Parques Nacionales, Madrid, Spain, pp 881–927. Puertolas J (2005) Effects of nitrogen fertilization and temperature on frost hardiness of Aleppo pine (Pinus halepensis Mill.) seedlings assessed by chlorophyll fluorescence. Forestry 78:501–511. Puértolas J, Prada MA, Climent J, Oliet J, Del Campo García A (2013) Pinus halepensis Mill. In: Pemán J, Navarro-Cerrillo RM, Nicolás JL, Prada MA, Serrada R (eds) Producción y Manejo de Semillas y Plantas Forestales. Tomo II. Organismo Autónomo Parques Nacionales, Madrid, Spain, pp 855–880. 31.
(33) Rennenberg H, Gessler A. (1999) Consequences of N deposition to forest ecosystemsrecent results and future research needs. Water Air Soil Poll. 116: 47–64. Repo T (1992) Seasonal changes of frost hardiness in Picea abies and Pinus sylvestris in Finland. Can J Bot 22:1949–1957. Repo T, Zhang G, Ryyppö A, Rikala R, Vuorinen M (2000) The relation between growth cessation and frost hardening in Scots pines of different origins. Trees Struct Funct 14:456–464. Rikala R, Repo T (1997) The effect of late summer fertilization on the frost hardening of second-year Scots pine seedlings. New For 14:33–44. Ryyppö A, Repo T, Vapaavuori E (2008) Development of freezing tolerance in roots and shoots of Scots pine seedlings at nonfreezing temperatures. Can J For Res 28:557–565. Schaberg PG, DeHayes DH, Hawley GJ, Murakami PF, Strimbeck GR, McNulty SG (2002) Effects of chronic N fertilization on foliar membranes, cold tolerance, and carbon storage in montane red spruce. Can J For Res 32:1351–1359. Schaberg PG, Hennon PE, D’amore D V., Hawley GJ (2008) Influence of simulated snow cover on the cold tolerance and freezing injury of yellow-cedar seedlings. Glob Chang Biol 14:1282–1293. Schulze E-D, Müller-Hohenstein K, Beck E (2005) Plant Ecology, 1st edn. Springer, Berlin. Taulavuori K, Taulavuori E, Sheppard LJ (2014) Truths or myths, fact or fiction, setting the record straight concerning nitrogen effects on levels of frost hardiness. Environ Exp Bot 106:132–137. Timmer VR, Armstrong G (1987) Diagnosing nutritional status of containerized tree seedlings: comparative plant analyses. Soil Sci Soc Am J 51:1082–1086. 32.
(34) Tinus RW, Burr KE, Atzmon N, Riov J (2000) Relationship between carbohydrate concentration and root growth potential in coniferous seedlings from three climates during cold hardening and dehardening. Tree Physiol 20:1097–1104. Uemura M, Steponkus PL (2003) Modification of the intracellular sugar content alters the incidence of freeze-induced membrane lesions of protoplasts isolated from Arabidopsis thaliana leaves. Plant, Cell Environ 26:1083–1096. Villar-Salvador P, Penuelas JL, Jacobs DF (2013) Nitrogen nutrition and drought hardening exert opposite effects on the stress tolerance of Pinus pinea L. seedlings. Tree Physiol 33:221–232. Villar-Salvador P, Uscola M, Jacobs DF (2015) The role of stored carbohydrates and nitrogen in the growth and stress tolerance of planted forest trees. New For 46:813–839. Welling A, Moritz T, Palva ET, Junttila O (2002) Independent Activation of Cold Acclimation by Low Temperature and Short Photoperiod in Hybrid Aspen. Plant Physiol 129:1633–1641. Willson CJ, Jackson RB (2006) Xylem cavitation caused by drought and freezing stress in four co-occurring Juniperus species. Physiol Plant 127:374–382. Wolfe J, Bryant G (2001) Cellular cryobiology: thermodynamic and mechanical effects. Biophys J 41:1–40. Zhang G, Ryyppö A, Vapaavuori E, Repo T (2003) Quantification of additive response and stationarity of frost hardiness by photoperiod and temperature in Scots pine. Can J For Res 33:1772–1784. Zwiazek JJ, Renault S, Croser C, Hansen J, Beck E (2001) Biochemical and Biophysical Changes in Relation to Cold Hardiness. Conifer Cold Hardiness:165–186. 33.
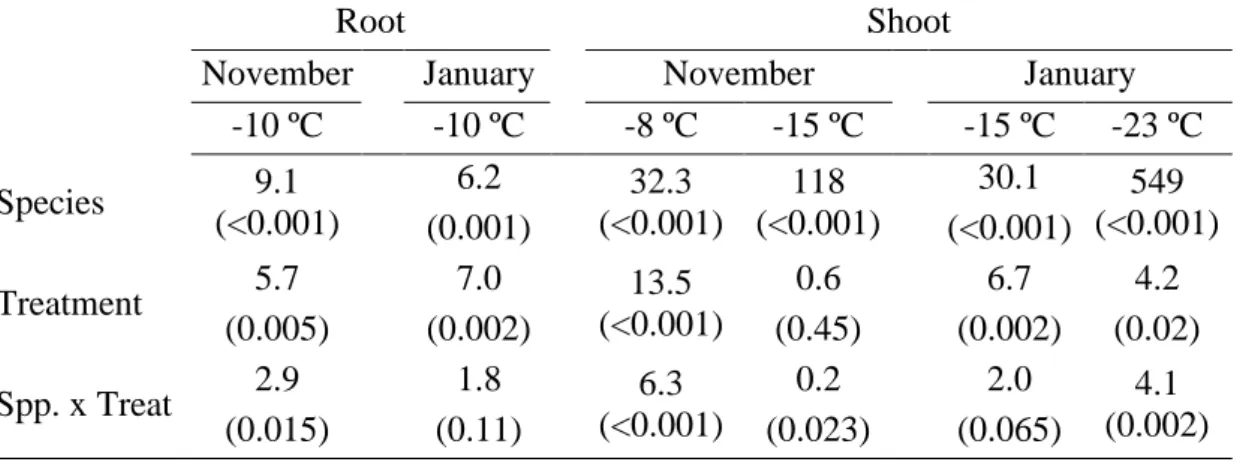
(35) Table 1: Statistical results of the effect of species and fertilization treatments on visual damage index values after root and shoot freezing tests at different target temperatures in November and January. Data are F-values and P-values in brackets.. Root November January -10 ºC -10 ºC 6.2 9.1 Species (<0.001) (0.001) 5.7 7.0 Treatment (0.005) (0.002) 2.9 1.8 Spp. x Treat (0.015) (0.11). Shoot November -8 ºC -15 ºC 32.3 118 (<0.001) (<0.001) 13.5 (<0.001) 6.3 (<0.001). 0.6 (0.45) 0.2 (0.023). January -15 ºC -23 ºC 30.1 549 (<0.001) (<0.001) 6.7 4.2 (0.002) (0.02) 2.0 4.1 (0.065) (0.002). 34.
(36) Figure captions. Figure 1: Visual damage index (VDI) after root freezing at -10 °C in November (a) and January (b) in one-year old seedlings of four pine species that were cultivated with three nitrogen fertilization treatments (pre-hardening low and high N, and fall fertilization). Data are means ± 1 SE. Mean values not sharing common letters are significantly different.. Figure 2: Visual damage index (VDI) after shoot freezing at -8 °C in November (a) and -15°C January (b) in one-year old seedlings of four pine species that were cultivated with three N fertilization treatments (pre-hardening low and high N, and fall fertilization). Data are means ± 1 SE. Mean values not sharing common letters are significantly different.. Figure 3: Julian day of cessation of shoot elongation in one-year old seedlings of four pine species that were cultivated with three N fertilization regimes (pre-hardening low and high N, and fall fertilization). Data are means ± 1 SE. Mean values not sharing common letters are significantly different. Figure 4: N concentration (Mg/g) in one-year old seedlings needles and roots of four pine species that were cultivated with three N fertilization regimes (pre-hardening low and high N, and fall fertilization) in November (a,b) and January (c,d). Data are means ± 1 SE. Mean values not sharing common letters are significantly different. Figure 5: Species (left figures) and N fertilization treatment (right figures) differences in soluble carbohydrates (SC; Glucose+fructose+sucrose) concentration in needles (upper row) and roots (lower row) in one-year old seedlings of four pine species sampled in November. Data are means ± 1 SE. Mean values not sharing common letters are significantly different.. Figure 6: Soluble carbohydrate (SC; Glucose+fructose+sucrose) concentration in needles (a) and roots (b) of one-year old seedlings sampled in January in four pine species that were cultivated with three N fertilization regimes (pre-hardening low and high N, and fall fertilization). Data are means ± 1 SE. Mean values not sharing common letters are significantly different. Figure S1: Temperature (°C) progression in the nursery from September 2012 to the end of January 2013. The arrows indicate the date of the freezing test.. 35.
(37) Figure 1. 100. November -10ºC. a). Low High Fall. 80. VDI %. e de. 60. 40. cd bc abc. abc. abc. abc. abc. 20. ab. ab a. 0 100. b). January -10ºC e. 80. de. VDI %. cde 60. bcde abcd. 40. abcd abc 20. a. ab. a. a a. 0. P. halepensis. P. pinea. P. pinaster. P. nigra. 36.
(38) Figure 2 100. a). f. November -8ºC. Low High Fall. 80. e de. VDI %. 60. cd. 40. cd abc ab. abc. 20. ab. ab a a. 0 100. b). January -15ºC. e. 80. d. cd. VDI%. 60. cd bc bc. 40. ab ab ab 20. a. a a. 0 P. halepensis. P. pinea. P. pinaster. P. nigra. 37.
(39) Figure 3 Growth cessation. Low High Fall. b 300. b. b. b a. Julian day. a ad. a. ad. 270 cd c. c. 240 0. P. halepensis. P. pinea. P. pinaster. P. nigra. 38.
(40) Figure 4 d. a). Needle November. d. 30. N mg g-1. ab. ab. 20. ab. ab. c. d. c). Needles January. b a. cd. acd ac. c. c. Low High Fall. a. b b. 10. cd. a a. d. b. b. 0. b). d). Root November. gh 15. ef. N mg g-1. fg abcde 10. cdef abc. a. def bcdef ab. Root January. h. g abcd. fg def ef. bcde. abcd. ab. P. halepensis. P. pinea. cde abcd a. f abc. 5. 0. P. halepensis. P. pinea. P. pinaster. P. nigra. P. pinaster. P. nigra. 39.
(41) Figure 5 120. a). Needles. b). c. Needles. SC (mg g-1). 105. a. 90. a. a. High Root c. Fall. a b. 75. b 60. 0 30. c) b. Root. b. d). Low. X Data. SC (mg g-1). 25. b a. 20. a. a 15. 10 0. P. halepensis P. pinea P. pinaster P. nigra. Low. High. Fall. 40.
(42) Figure 6 Needles. a). SC (mg g -1). 60. ad ab ab. de e de. Low High Fall. ab a ab. bc c. c. 40. 20. 0. b)P. halepensis. P. pineaRootsP. pinaster. P. nigra. SC (mg g-1). 60. c. c. c. c. 20. ab. ab. b. ab ab. a. a. d. 0. P. halepensis P. pinea. P. pinaster. P. nigra. 41.
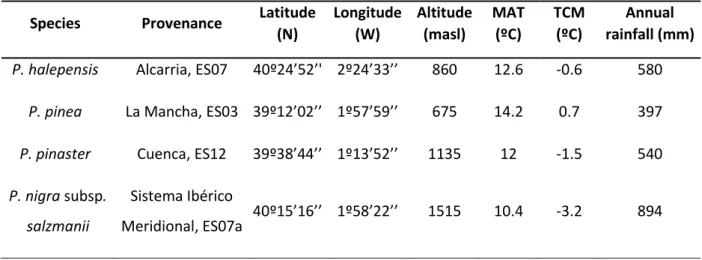
(43) Supplementary material. Table S1: Geographic location and climatic characteristics of the provenances where seeds were collected. MAT= mean annual temperature, TCM= mean of the minimum temperatures of the coldest month. Provenance names follows nomenclature in Alía et al (2009).. Species. Provenance. P. halepensis. Alcarria, ES07. P. pinea. Latitude (N). Longitude Altitude (W) (masl). MAT (ºC). TCM (ºC). Annual rainfall (mm). 40º24’52’' 2º24’33’’. 860. 12.6. -0.6. 580. La Mancha, ES03 39º12’02’’ 1º57’59’’. 675. 14.2. 0.7. 397. 39º38’44’’ 1º13’52’’. 1135. 12. -1.5. 540. 40º15’16’’ 1º58’22’’. 1515. 10.4. -3.2. 894. P. pinaster. Cuenca, ES12. P. nigra subsp.. Sistema Ibérico. salzmanii. Meridional, ES07a. 42.
(44) Figure S1 40. Temperature ºC. 30. 20. 10. 0. -10 September. October. November. December. January. 43.
(45)
Figure
Documento similar
Abstract: Transepidermal water-loss (TEWL), stratum-corneum hydration (SCH), erythema, elas- ticity, pH and melanin, are parameters of the epidermal barrier function and
In the preparation of this report, the Venice Commission has relied on the comments of its rapporteurs; its recently adopted Report on Respect for Democracy, Human Rights and the Rule
The draft amendments do not operate any more a distinction between different states of emergency; they repeal articles 120, 121and 122 and make it possible for the President to
Penelitian ini bertujuan untuk mendapatkan asal daerah bahan baku yang terbaik untuk pembuatan sirup gula kelapa dan untuk mendapatkan konsentrasi arang aktif yang
SECTION 3 - The role of RINGO proteins in the brain 123 RingoA mRNA is expressed in neural stem cells and proliferating progenitor cells 123 Analysis of neural stem cells
Díaz Soto has raised the point about banning religious garb in the ―public space.‖ He states, ―for example, in most Spanish public Universities, there is a Catholic chapel
teriza por dos factores, que vienen a determinar la especial responsabilidad que incumbe al Tribunal de Justicia en esta materia: de un lado, la inexistencia, en el
Let us now advance the main result that we will find: the existence of special points of infinite monodromy around z = ∞ will depend on the structure of the α i : if all the α i
